
 Login Sign Up


| |||||
 |  | ||||

| 12Stocks.com Market Intelligence |
Best Financial Stocks
| In a hurry? Financial Stocks Lists: Performance Trends Table, Stock Charts
Sort Financial stocks: Daily, Weekly, Year-to-Date, Market Cap & Trends. Filter Financial stocks list by size:All Financial Large Mid-Range Small & MicroCap |
| 12Stocks.com Financial Stocks Performances & Trends Daily | |||||||||
|
|  The overall Smart Investing & Trading Score is 90 (0-bearish to 100-bullish) which puts Financial sector in short term bullish trend. The Smart Investing & Trading Score from previous trading session is 60 and an improvement of trend continues.
| ||||||||
Here are the Smart Investing & Trading Scores of the most requested Financial stocks at 12Stocks.com (click stock name for detailed review):
|


| 12Stocks.com: Investing in Financial sector with Stocks | |
|
The following table helps investors and traders sort through current performance and trends (as measured by Smart Investing & Trading Score) of various
stocks in the Financial sector. Quick View: Move mouse or cursor over stock symbol (ticker) to view short-term Technical chart and over stock name to view long term chart. Click on  to add stock symbol to your watchlist and to add stock symbol to your watchlist and  to view watchlist. Click on any ticker or stock name for detailed market intelligence report for that stock. to view watchlist. Click on any ticker or stock name for detailed market intelligence report for that stock. |
12Stocks.com Performance of Stocks in Financial Sector
| Ticker | Stock Name | Watchlist | Category | Recent Price | Smart Investing & Trading Score | Change % | YTD Change% |
| EQR | Equity Residential |   | REIT | 64.87 | 10 | 0.37% | -5.57% |
| GRX | Gabelli Healthcare | | Closed-End Fund - Equity | 9.12 | 0 | -0.44% | -5.59% |
| FCBC | First Community | | Banks - Regional | 37.60 | 30 | 2.51% | -5.62% |
| EARN | Ellington Credit | | Asset Mgmt | 5.73 | 60 | 0.53% | -5.62% |
| BHF | Brighthouse | | Insurance - Life | 45.26 | 30 | -1.50% | -5.69% |
| GLRE | Greenlight Capital | | Insurance - Reinsurance | 12.92 | 60 | 2.13% | -5.76% |
| KNSL | Kinsale Capital | | Insurance - Property & Casualty | 427.32 | 20 | -0.78% | -5.81% |
| EVBN | Evans Bancorp | | Regional Banks | 39.53 | 40 | 0.00% | -5.84% |
| FRT | Federal Realty | | REIT - Retail | 100.22 | 30 | 0.94% | -5.88% |
| MMC | Marsh & McLennan Cos | | Insurance | 196.15 | 0 | -0.63% | -6.13% |
| MSCI | MSCI | | Financial Data & Stock Exchanges | 555.98 | 10 | -3.92% | -6.30% |
| NASB | NASB | | S&L | 34.50 | 20 | -0.89% | -6.30% |
| CCS | Century Communities | | Real Estate - Development | 67.47 | 60 | 0.15% | -6.31% |
| AMP | Ameriprise | | Asset Mgmt | 491.39 | 40 | 1.07% | -6.42% |
| AIV | Apartment | | REIT | 7.90 | 70 | 1.28% | -6.47% |
| AGO | Assured Guaranty | | Insurance - Specialty | 83.03 | 60 | 1.52% | -6.51% |
| KRG | Kite Realty | | REIT - Retail | 22.23 | 20 | 0.91% | -6.63% |
| WD | Walker & Dunlop | | Mortgage Finance | 87.54 | 60 | 2.63% | -6.70% |
| NIQ | NIQ Global | | Closed-End Fund - Debt | 17.73 | 50 | -3.90% | -6.73% |
| EV | Eaton Vance | | Asset Mgmt | 22.00 | 30 | 0.00% | -6.77% |
| MRCC | Monroe Capital | | Asset Mgmt | 7.50 | 90 | 0.40% | -6.83% |
| OCSL | Oaktree Specialty | | Asset Mgmt | 13.42 | 40 | 0.07% | -6.92% |
| TRUP | Trupanion | | Insurance - Property & Casualty | 44.81 | 60 | -0.64% | -7.03% |
| SAMG | Silvercrest Asset | | Asset Mgmt | 16.49 | 90 | 2.68% | -7.28% |
| ARE | Alexandria Real | | REIT - Office | 87.45 | 100 | 2.71% | -7.39% |
| For chart view version of above stock list: Chart View ➞ 0 - 25 , 25 - 50 , 50 - 75 , 75 - 100 , 100 - 125 , 125 - 150 , 150 - 175 , 175 - 200 , 200 - 225 , 225 - 250 , 250 - 275 , 275 - 300 , 300 - 325 , 325 - 350 , 350 - 375 , 375 - 400 , 400 - 425 , 425 - 450 , 450 - 475 , 475 - 500 , 500 - 525 , 525 - 550 , 550 - 575 , 575 - 600 , 600 - 625 , 625 - 650 , 650 - 675 , 675 - 700 , 700 - 725 , 725 - 750 , 750 - 775 , 775 - 800 , 800 - 825 , 825 - 850 , 850 - 875 , 875 - 900 , 900 - 925 , 925 - 950 , 950 - 975 , 975 - 1000 , 1000 - 1025 , 1025 - 1050 , 1050 - 1075 , 1075 - 1100 , 1100 - 1125 , 1125 - 1150 , 1150 - 1175 , 1175 - 1200 , 1200 - 1225 , 1225 - 1250 , 1250 - 1275 , 1275 - 1300 , 1300 - 1325 , 1325 - 1350 , 1350 - 1375 , 1375 - 1400 , 1400 - 1425 , 1425 - 1450 , 1450 - 1475 , 1475 - 1500 , 1500 - 1525 , 1525 - 1550 | ||
 | Click To Change The Sort Order: By Market Cap or Company Size Performance: Year-to-date, Week and Day |  |
|
Get the most comprehensive stock market coverage daily at 12Stocks.com ➞ Best Stocks Today ➞ Best Stocks Weekly ➞ Best Stocks Year-to-Date ➞ Best Stocks Trends ➞  Best Stocks Today 12Stocks.com Best Nasdaq Stocks ➞ Best S&P 500 Stocks ➞ Best Tech Stocks ➞ Best Biotech Stocks ➞ |
| Detailed Overview of Financial Stocks |
| Financial Technical Overview, Leaders & Laggards, Top Financial ETF Funds & Detailed Financial Stocks List, Charts, Trends & More |
| Financial Sector: Technical Analysis, Trends & YTD Performance | |
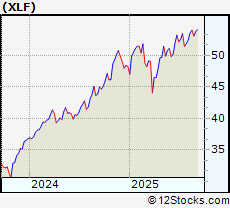
| Financial sector is composed of stocks
from banks, brokers, insurance, REITs
and services subsectors. Financial sector, as represented by XLF, an exchange-traded fund [ETF] that holds basket of Financial stocks (e.g, Bank of America, Goldman Sachs) is up by 13.0735% and is currently underperforming the overall market by -0.7866% year-to-date. Below is a quick view of Technical charts and trends: |
|
 XLF Weekly Chart |
|
| Long Term Trend: Good | |
| Medium Term Trend: Good | |
 XLF Daily Chart |
|
| Short Term Trend: Very Good | |
| Overall Trend Score: 90 | |
| YTD Performance: 13.0735% | |
| **Trend Scores & Views Are Only For Educational Purposes And Not For Investing | |
| 12Stocks.com: Top Performing Financial Sector Stocks | |||||||||||||||||||||||||||||||||||||||||||||||
 The top performing Financial sector stocks year to date are
Now, more recently, over last week, the top performing Financial sector stocks on the move are


|
|||||||||||||||||||||||||||||||||||||||||||||||
| 12Stocks.com: Investing in Financial Sector using Exchange Traded Funds | |
|
The following table shows list of key exchange traded funds (ETF) that
help investors track Financial Index. For detailed view, check out our ETF Funds section of our website. Quick View: Move mouse or cursor over ETF symbol (ticker) to view short-term Technical chart and over ETF name to view long term chart. Click on ticker or stock name for detailed view. Click on to add stock symbol to your watchlist and to view watchlist. |
12Stocks.com List of ETFs that track Financial Index
| Ticker | ETF Name | Watchlist | Recent Price | Smart Investing & Trading Score | Change % | Week % | Year-to-date % |
| CHIX | China Financials | | 10.57 | 20 | 0 | 0 | 0% |
| 12Stocks.com: Charts, Trends, Fundamental Data and Performances of Financial Stocks | |
|
We now take in-depth look at all Financial stocks including charts, multi-period performances and overall trends (as measured by Smart Investing & Trading Score). One can sort Financial stocks (click link to choose) by Daily, Weekly and by Year-to-Date performances. Also, one can sort by size of the company or by market capitalization. |
| Select Your Default Chart Type: | |||||
| |||||
| Click on stock symbol or name for detailed view. Click on to add stock symbol to your watchlist and to view watchlist. Quick View: Move mouse or cursor over "Daily" to quickly view daily Technical stock chart and over "Weekly" to view weekly Technical stock chart. | |||||

 | EQR Equity Residential Properties Trust |
| Sector: Financials | |
| SubSector: REIT - Residential | |
| MarketCap: 25514.6 Millions | |
| Recent Price: 64.87 Smart Investing & Trading Score: 10 | |
| Day Percent Change: 0.371345% Day Change: 0.26 | |
| Week Change: -1.50319% Year-to-date Change: -5.6% | |
| EQR Links: Profile News Message Board | |
| Charts:- Daily , Weekly | |
| Add EQR to Watchlist: View: Get Complete EQR Trend Analysis ➞ | |
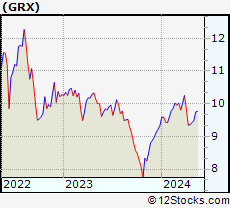 | GRX Gabelli Healthcare & WellnessRx Trust |
| Sector: Financials | |
| SubSector: Closed-End Fund - Equity | |
| MarketCap: 147.31 Millions | |
| Recent Price: 9.12 Smart Investing & Trading Score: 0 | |
| Day Percent Change: -0.436681% Day Change: 0.03 | |
| Week Change: -2.45989% Year-to-date Change: -5.6% | |
| GRX Links: Profile News Message Board | |
| Charts:- Daily , Weekly | |
| Add GRX to Watchlist: View: Get Complete GRX Trend Analysis ➞ | |
 | FCBC First Community Bankshares Inc |
| Sector: Financials | |
| SubSector: Banks - Regional | |
| MarketCap: 687.91 Millions | |
| Recent Price: 37.60 Smart Investing & Trading Score: 30 | |
| Day Percent Change: 2.50818% Day Change: 0.54 | |
| Week Change: 0.642398% Year-to-date Change: -5.6% | |
| FCBC Links: Profile News Message Board | |
| Charts:- Daily , Weekly | |
| Add FCBC to Watchlist: View: Get Complete FCBC Trend Analysis ➞ | |
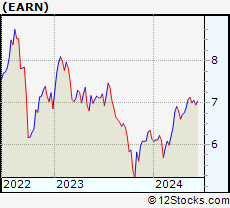 | EARN Ellington Credit Co |
| Sector: Financials | |
| SubSector: Asset Management | |
| MarketCap: 211.83 Millions | |
| Recent Price: 5.73 Smart Investing & Trading Score: 60 | |
| Day Percent Change: 0.526316% Day Change: 0.08 | |
| Week Change: 1.23675% Year-to-date Change: -5.6% | |
| EARN Links: Profile News Message Board | |
| Charts:- Daily , Weekly | |
| Add EARN to Watchlist: View: Get Complete EARN Trend Analysis ➞ | |
 | BHF Brighthouse Financial Inc |
| Sector: Financials | |
| SubSector: Insurance - Life | |
| MarketCap: 2478.13 Millions | |
| Recent Price: 45.26 Smart Investing & Trading Score: 30 | |
| Day Percent Change: -1.50163% Day Change: -0.78 | |
| Week Change: -7.15897% Year-to-date Change: -5.7% | |
| BHF Links: Profile News Message Board | |
| Charts:- Daily , Weekly | |
| Add BHF to Watchlist: View: Get Complete BHF Trend Analysis ➞ | |
 | GLRE Greenlight Capital Re Ltd |
| Sector: Financials | |
| SubSector: Insurance - Reinsurance | |
| MarketCap: 435.68 Millions | |
| Recent Price: 12.92 Smart Investing & Trading Score: 60 | |
| Day Percent Change: 2.13439% Day Change: -0.1 | |
| Week Change: 4.19355% Year-to-date Change: -5.8% | |
| GLRE Links: Profile News Message Board | |
| Charts:- Daily , Weekly | |
| Add GLRE to Watchlist: View: Get Complete GLRE Trend Analysis ➞ | |
 | KNSL Kinsale Capital Group Inc |
| Sector: Financials | |
| SubSector: Insurance - Property & Casualty | |
| MarketCap: 10610.8 Millions | |
| Recent Price: 427.32 Smart Investing & Trading Score: 20 | |
| Day Percent Change: -0.775554% Day Change: -4.59 | |
| Week Change: 0.389983% Year-to-date Change: -5.8% | |
| KNSL Links: Profile News Message Board | |
| Charts:- Daily , Weekly | |
| Add KNSL to Watchlist: View: Get Complete KNSL Trend Analysis ➞ | |
 | EVBN Evans Bancorp, Inc. |
| Sector: Financials | |
| SubSector: Regional - Northeast Banks | |
| MarketCap: 124.899 Millions | |
| Recent Price: 39.53 Smart Investing & Trading Score: 40 | |
| Day Percent Change: 0% Day Change: -9999 | |
| Week Change: 2.1447% Year-to-date Change: -5.8% | |
| EVBN Links: Profile News Message Board | |
| Charts:- Daily , Weekly | |
| Add EVBN to Watchlist: View: Get Complete EVBN Trend Analysis ➞ | |
 | FRT Federal Realty Investment Trust |
| Sector: Financials | |
| SubSector: REIT - Retail | |
| MarketCap: 8919.28 Millions | |
| Recent Price: 100.22 Smart Investing & Trading Score: 30 | |
| Day Percent Change: 0.93665% Day Change: 1.15 | |
| Week Change: -0.22897% Year-to-date Change: -5.9% | |
| FRT Links: Profile News Message Board | |
| Charts:- Daily , Weekly | |
| Add FRT to Watchlist: View: Get Complete FRT Trend Analysis ➞ | |
 | MMC Marsh & McLennan Cos., Inc |
| Sector: Financials | |
| SubSector: Insurance Brokers | |
| MarketCap: 100163 Millions | |
| Recent Price: 196.15 Smart Investing & Trading Score: 0 | |
| Day Percent Change: -0.633232% Day Change: -0.26 | |
| Week Change: -1.31811% Year-to-date Change: -6.1% | |
| MMC Links: Profile News Message Board | |
| Charts:- Daily , Weekly | |
| Add MMC to Watchlist: View: Get Complete MMC Trend Analysis ➞ | |
 | MSCI MSCI Inc |
| Sector: Financials | |
| SubSector: Financial Data & Stock Exchanges | |
| MarketCap: 42949.3 Millions | |
| Recent Price: 555.98 Smart Investing & Trading Score: 10 | |
| Day Percent Change: -3.91608% Day Change: -27.87 | |
| Week Change: -1.27845% Year-to-date Change: -6.3% | |
| MSCI Links: Profile News Message Board | |
| Charts:- Daily , Weekly | |
| Add MSCI to Watchlist: View: Get Complete MSCI Trend Analysis ➞ | |
 | NASB NASB Financial, Inc. |
| Sector: Financials | |
| SubSector: Savings & Loans | |
| MarketCap: 287.77 Millions | |
| Recent Price: 34.50 Smart Investing & Trading Score: 20 | |
| Day Percent Change: -0.890549% Day Change: -9999 | |
| Week Change: 1.11372% Year-to-date Change: -6.3% | |
| NASB Links: Profile News Message Board | |
| Charts:- Daily , Weekly | |
| Add NASB to Watchlist: View: Get Complete NASB Trend Analysis ➞ | |
 | CCS Century Communities Inc |
| Sector: Financials | |
| SubSector: Real Estate - Development | |
| MarketCap: 2067.49 Millions | |
| Recent Price: 67.47 Smart Investing & Trading Score: 60 | |
| Day Percent Change: 0.148434% Day Change: -0.94 | |
| Week Change: 0.626398% Year-to-date Change: -6.3% | |
| CCS Links: Profile News Message Board | |
| Charts:- Daily , Weekly | |
| Add CCS to Watchlist: View: Get Complete CCS Trend Analysis ➞ | |
 | AMP Ameriprise Financial Inc |
| Sector: Financials | |
| SubSector: Asset Management | |
| MarketCap: 46125.2 Millions | |
| Recent Price: 491.39 Smart Investing & Trading Score: 40 | |
| Day Percent Change: 1.0737% Day Change: 6.87 | |
| Week Change: -0.123984% Year-to-date Change: -6.4% | |
| AMP Links: Profile News Message Board | |
| Charts:- Daily , Weekly | |
| Add AMP to Watchlist: View: Get Complete AMP Trend Analysis ➞ | |
 | AIV Apartment Investment & Management Co |
| Sector: Financials | |
| SubSector: REIT - Residential | |
| MarketCap: 1114.45 Millions | |
| Recent Price: 7.90 Smart Investing & Trading Score: 70 | |
| Day Percent Change: 1.28205% Day Change: -0.02 | |
| Week Change: 5.47397% Year-to-date Change: -6.5% | |
| AIV Links: Profile News Message Board | |
| Charts:- Daily , Weekly | |
| Add AIV to Watchlist: View: Get Complete AIV Trend Analysis ➞ | |
 | AGO Assured Guaranty Ltd |
| Sector: Financials | |
| SubSector: Insurance - Specialty | |
| MarketCap: 3913.02 Millions | |
| Recent Price: 83.03 Smart Investing & Trading Score: 60 | |
| Day Percent Change: 1.51608% Day Change: 1.35 | |
| Week Change: 1.56575% Year-to-date Change: -6.5% | |
| AGO Links: Profile News Message Board | |
| Charts:- Daily , Weekly | |
| Add AGO to Watchlist: View: Get Complete AGO Trend Analysis ➞ | |
 | KRG Kite Realty Group Trust |
| Sector: Financials | |
| SubSector: REIT - Retail | |
| MarketCap: 5113.9 Millions | |
| Recent Price: 22.23 Smart Investing & Trading Score: 20 | |
| Day Percent Change: 0.907853% Day Change: -0.16 | |
| Week Change: -1.59363% Year-to-date Change: -6.6% | |
| KRG Links: Profile News Message Board | |
| Charts:- Daily , Weekly | |
| Add KRG to Watchlist: View: Get Complete KRG Trend Analysis ➞ | |
 | WD Walker & Dunlop Inc |
| Sector: Financials | |
| SubSector: Mortgage Finance | |
| MarketCap: 2984.45 Millions | |
| Recent Price: 87.54 Smart Investing & Trading Score: 60 | |
| Day Percent Change: 2.62603% Day Change: -2.04 | |
| Week Change: 1.63706% Year-to-date Change: -6.7% | |
| WD Links: Profile News Message Board | |
| Charts:- Daily , Weekly | |
| Add WD to Watchlist: View: Get Complete WD Trend Analysis ➞ | |
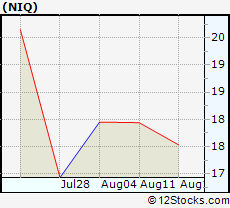 | NIQ NIQ Global Intelligence plc |
| Sector: Financials | |
| SubSector: Closed-End Fund - Debt | |
| MarketCap: 5023.85 Millions | |
| Recent Price: 17.73 Smart Investing & Trading Score: 50 | |
| Day Percent Change: -3.90244% Day Change: 0.37 | |
| Week Change: 3.38192% Year-to-date Change: -6.7% | |
| NIQ Links: Profile News Message Board | |
| Charts:- Daily , Weekly | |
| Add NIQ to Watchlist: View: Get Complete NIQ Trend Analysis ➞ | |
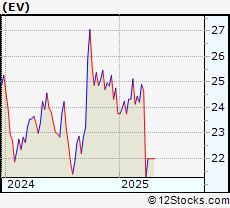 | EV Eaton Vance Corp. |
| Sector: Financials | |
| SubSector: Asset Management | |
| MarketCap: 3644.53 Millions | |
| Recent Price: 22.00 Smart Investing & Trading Score: 30 | |
| Day Percent Change: 0% Day Change: -9999 | |
| Week Change: 0% Year-to-date Change: -6.8% | |
| EV Links: Profile News Message Board | |
| Charts:- Daily , Weekly | |
| Add EV to Watchlist: View: Get Complete EV Trend Analysis ➞ | |
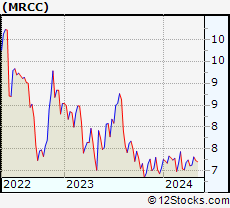 | MRCC Monroe Capital Corp |
| Sector: Financials | |
| SubSector: Asset Management | |
| MarketCap: 163.8 Millions | |
| Recent Price: 7.50 Smart Investing & Trading Score: 90 | |
| Day Percent Change: 0.401606% Day Change: 0.09 | |
| Week Change: 6.08204% Year-to-date Change: -6.8% | |
| MRCC Links: Profile News Message Board | |
| Charts:- Daily , Weekly | |
| Add MRCC to Watchlist: View: Get Complete MRCC Trend Analysis ➞ | |
 | OCSL Oaktree Specialty Lending Corp |
| Sector: Financials | |
| SubSector: Asset Management | |
| MarketCap: 1230.55 Millions | |
| Recent Price: 13.42 Smart Investing & Trading Score: 40 | |
| Day Percent Change: 0.0745712% Day Change: -0.01 | |
| Week Change: -2.32897% Year-to-date Change: -6.9% | |
| OCSL Links: Profile News Message Board | |
| Charts:- Daily , Weekly | |
| Add OCSL to Watchlist: View: Get Complete OCSL Trend Analysis ➞ | |
 | TRUP Trupanion Inc |
| Sector: Financials | |
| SubSector: Insurance - Property & Casualty | |
| MarketCap: 1895.64 Millions | |
| Recent Price: 44.81 Smart Investing & Trading Score: 60 | |
| Day Percent Change: -0.643016% Day Change: -0.02 | |
| Week Change: 3.82298% Year-to-date Change: -7.0% | |
| TRUP Links: Profile News Message Board | |
| Charts:- Daily , Weekly | |
| Add TRUP to Watchlist: View: Get Complete TRUP Trend Analysis ➞ | |
 | SAMG Silvercrest Asset Management Group Inc |
| Sector: Financials | |
| SubSector: Asset Management | |
| MarketCap: 198.81 Millions | |
| Recent Price: 16.49 Smart Investing & Trading Score: 90 | |
| Day Percent Change: 2.67746% Day Change: -0.14 | |
| Week Change: 3.64551% Year-to-date Change: -7.3% | |
| SAMG Links: Profile News Message Board | |
| Charts:- Daily , Weekly | |
| Add SAMG to Watchlist: View: Get Complete SAMG Trend Analysis ➞ | |
 | ARE Alexandria Real Estate Equities Inc |
| Sector: Financials | |
| SubSector: REIT - Office | |
| MarketCap: 14649.6 Millions | |
| Recent Price: 87.45 Smart Investing & Trading Score: 100 | |
| Day Percent Change: 2.71318% Day Change: 2.57 | |
| Week Change: 4.10714% Year-to-date Change: -7.4% | |
| ARE Links: Profile News Message Board | |
| Charts:- Daily , Weekly | |
| Add ARE to Watchlist: View: Get Complete ARE Trend Analysis ➞ | |
| For tabular summary view of above stock list: Summary View ➞ 0 - 25 , 25 - 50 , 50 - 75 , 75 - 100 , 100 - 125 , 125 - 150 , 150 - 175 , 175 - 200 , 200 - 225 , 225 - 250 , 250 - 275 , 275 - 300 , 300 - 325 , 325 - 350 , 350 - 375 , 375 - 400 , 400 - 425 , 425 - 450 , 450 - 475 , 475 - 500 , 500 - 525 , 525 - 550 , 550 - 575 , 575 - 600 , 600 - 625 , 625 - 650 , 650 - 675 , 675 - 700 , 700 - 725 , 725 - 750 , 750 - 775 , 775 - 800 , 800 - 825 , 825 - 850 , 850 - 875 , 875 - 900 , 900 - 925 , 925 - 950 , 950 - 975 , 975 - 1000 , 1000 - 1025 , 1025 - 1050 , 1050 - 1075 , 1075 - 1100 , 1100 - 1125 , 1125 - 1150 , 1150 - 1175 , 1175 - 1200 , 1200 - 1225 , 1225 - 1250 , 1250 - 1275 , 1275 - 1300 , 1300 - 1325 , 1325 - 1350 , 1350 - 1375 , 1375 - 1400 , 1400 - 1425 , 1425 - 1450 , 1450 - 1475 , 1475 - 1500 , 1500 - 1525 , 1525 - 1550 | ||
| Click To Change The Sort Order: By Market Cap or Company Size Performance: Year-to-date, Week and Day | |
| Select Chart Type: | ||
|
Best Stocks Today 12Stocks.com |
© 2025 12Stocks.com Terms & Conditions Privacy Contact Us
All Information Provided Only For Education And Not To Be Used For Investing or Trading. See Terms & Conditions


One More Thing ... Get Best Stocks Delivered Daily!
Never Ever Miss A Move With Our Top Ten Stocks Lists
Find Best Stocks In Any Market - Bull or Bear Market
Take A Peek At Our Top Ten Stocks Lists: Daily, Weekly, Year-to-Date & Top Trends
Find Best Stocks In Any Market - Bull or Bear Market
Take A Peek At Our Top Ten Stocks Lists: Daily, Weekly, Year-to-Date & Top Trends
Financial Stocks With Best Up Trends [0-bearish to 100-bullish]: Better Home[100], AMREP Corp[100], PIMCO California[100], Torchmark [100], PIMCO California[100], Triumph Bancorp[100], StepStone [100], Radian [100], National Bank[100], PIMCO Municipal[100], MARA [100]
Best Financial Stocks Year-to-Date:
Insight Select[12384.6%], Oxford Lane[292.479%], Better Home[250.328%], Metalpha Technology[213.274%], Robinhood Markets[206.567%], Cipher Mining[145.528%], Mr. Cooper[133.957%], Banco Santander[130.037%], IHS Holding[117.61%], Deutsche Bank[114.776%], LoanDepot [110.733%] Best Financial Stocks This Week:
Colony Starwood[15929900%], Blackhawk Network[91300%], Macquarie Global[81662.9%], Credit Suisse[63241.6%], Pennsylvania Real[23823%], First Republic[22570.9%], Select ome[14000%], CorEnergy Infrastructure[6797.78%], FedNat Holding[5525%], BlackRock Municipal[5340%], BlackRock MuniYield[3379.04%] Best Financial Stocks Daily:
Better Home[13.3451%], AMREP Corp[11.992%], PIMCO California[11.9545%], Torchmark [11.8363%], Forge Global[11.5409%], PIMCO California[11.4754%], BlackRock Muni[10.8108%], Blackrock MuniYield[10.72%], Triumph Bancorp[10.2661%], StepStone [8.74771%], BlackRock MuniYield[8.15348%]