
 Login Sign Up


| |||||
 |  | ||||

| 12Stocks.com Market Intelligence |
Best Financial Stocks
| In a hurry? Financial Stocks Lists: Performance Trends Table, Stock Charts
Sort Financial stocks: Daily, Weekly, Year-to-Date, Market Cap & Trends. Filter Financial stocks list by size:All Financial Large Mid-Range Small & MicroCap |
| 12Stocks.com Financial Stocks Performances & Trends Daily | |||||||||
|
|  The overall Smart Investing & Trading Score is 33 (0-bearish to 100-bullish) which puts Financial sector in short term bearish to neutral trend. The Smart Investing & Trading Score from previous trading session is 26 and hence an improvement of trend.
| ||||||||
Here are the Smart Investing & Trading Scores of the most requested Financial stocks at 12Stocks.com (click stock name for detailed review):
|


| 12Stocks.com: Investing in Financial sector with Stocks | |
|
The following table helps investors and traders sort through current performance and trends (as measured by Smart Investing & Trading Score) of various
stocks in the Financial sector. Quick View: Move mouse or cursor over stock symbol (ticker) to view short-term Technical chart and over stock name to view long term chart. Click on  to add stock symbol to your watchlist and to add stock symbol to your watchlist and  to view watchlist. Click on any ticker or stock name for detailed market intelligence report for that stock. to view watchlist. Click on any ticker or stock name for detailed market intelligence report for that stock. |
12Stocks.com Performance of Stocks in Financial Sector
| Ticker | Stock Name | Watchlist | Category | Recent Price | Trend Score | Change % | YTD Change% |
| ITIC | Investors Title |   | Insurance | 215.58 | 64 | 2.52% | -8.77% |
| AON | Aon | | Insurance | 360.40 | 64 | 1.96% | 0.53% |
| MA | Mastercard | | Credit Services | 569.81 | 64 | 1.77% | 8.55% |
| ALL | Allstate | | Insurance | 203.03 | 64 | 1.63% | 5.84% |
| HMN | Horace Mann | | Insurance | 41.90 | 64 | 1.53% | 7.70% |
| THG | Hanover Insurance | | Insurance | 171.39 | 64 | 1.52% | 11.42% |
| ESNT | Essent | | Mortgage | 56.93 | 64 | 0.73% | 5.18% |
| ORC | Orchid Island | | Mortgage | 7.17 | 63 | 1.99% | -3.63% |
| FBNC | First Bancorp | | Regional Banks | 49.26 | 63 | 1.86% | 12.65% |
| CBL | CBL & Associates Properties | | REIT - Retail | 26.78 | 63 | 0.83% | -4.97% |
| ONL | Orion Office | | REIT - Office | 2.56 | 63 | -1.16% | -30.35% |
| JBGS | JBG SMITH | | Property Mgmt | 20.56 | 63 | -1.67% | 33.77% |
| VCTR | Victory Capital | | Asset Mgmt | 68.93 | 63 | 3.19% | 6.02% |
| REG | Regency Centers | | REIT - Retail | 72.18 | 63 | 2.41% | -1.42% |
| JEF | Jefferies | | Brokerage | 56.57 | 63 | 1.18% | -27.44% |
| XHR | Xenia Hotels | | REIT | 12.79 | 61 | 2.48% | -12.90% |
| ALTI | AlTi Global | | Asset Mgmt | 4.10 | 61 | 5.13% | -7.03% |
| PAX | Patria s | | Asset Mgmt | 13.80 | 61 | 3.45% | 20.19% |
| LAMR | Lamar Advertising | | REIT - | 123.71 | 61 | 2.32% | 3.06% |
| CADE | Cadence Ban | | Regional Banks | 34.72 | 61 | 2.30% | 1.74% |
| AROW | Arrow | | Regional Banks | 26.57 | 61 | 1.57% | -6.48% |
| SBCF | Seacoast Banking | | Regional Banks | 28.05 | 61 | 1.48% | 2.62% |
| ISTR | Investar Holding | | Regional - Southwest Banks | 21.57 | 61 | 1.43% | -1.17% |
| AIV | Apartment | | REIT | 8.47 | 61 | 0.95% | -0.17% |
| PPBI | Pacific Premier | | Regional Banks | 21.73 | 60 | 2.60% | -11.68% |
| For chart view version of above stock list: Chart View ➞ 0 - 25 , 25 - 50 , 50 - 75 , 75 - 100 , 100 - 125 , 125 - 150 , 150 - 175 , 175 - 200 , 200 - 225 , 225 - 250 , 250 - 275 , 275 - 300 , 300 - 325 , 325 - 350 , 350 - 375 , 375 - 400 , 400 - 425 , 425 - 450 , 450 - 475 , 475 - 500 , 500 - 525 , 525 - 550 , 550 - 575 | ||
 | Click To Change The Sort Order: By Market Cap or Company Size Performance: Year-to-date, Week and Day |  |
|
Get the most comprehensive stock market coverage daily at 12Stocks.com ➞ Best Stocks Today ➞ Best Stocks Weekly ➞ Best Stocks Year-to-Date ➞ Best Stocks Trends ➞  Best Stocks Today 12Stocks.com Best Nasdaq Stocks ➞ Best S&P 500 Stocks ➞ Best Tech Stocks ➞ Best Biotech Stocks ➞ |
| Detailed Overview of Financial Stocks |
| Financial Technical Overview, Leaders & Laggards, Top Financial ETF Funds & Detailed Financial Stocks List, Charts, Trends & More |
| Financial Sector: Technical Analysis, Trends & YTD Performance | |
| Financial sector is composed of stocks
from banks, brokers, insurance, REITs
and services subsectors. Financial sector, as represented by XLF, an exchange-traded fund [ETF] that holds basket of Financial stocks (e.g, Bank of America, Goldman Sachs) is up by 7.8% and is currently outperforming the overall market by 0.27% year-to-date. Below is a quick view of Technical charts and trends: |
|
 XLF Weekly Chart |
|
| Long Term Trend: Good | |
| Medium Term Trend: Not Good | |
 XLF Daily Chart |
|
| Short Term Trend: Not Good | |
| Overall Trend Score: 33 | |
| YTD Performance: 7.8% | |
| **Trend Scores & Views Are Only For Educational Purposes And Not For Investing | |
| 12Stocks.com: Top Performing Financial Sector Stocks | ||||||||||||||||||||||||||||||||||||||||||||||||
 The top performing Financial sector stocks year to date are
Now, more recently, over last week, the top performing Financial sector stocks on the move are


|
||||||||||||||||||||||||||||||||||||||||||||||||
| 12Stocks.com: Investing in Financial Sector using Exchange Traded Funds | |
|
The following table shows list of key exchange traded funds (ETF) that
help investors track Financial Index. For detailed view, check out our ETF Funds section of our website. Quick View: Move mouse or cursor over ETF symbol (ticker) to view short-term Technical chart and over ETF name to view long term chart. Click on ticker or stock name for detailed view. Click on to add stock symbol to your watchlist and to view watchlist. |
12Stocks.com List of ETFs that track Financial Index
| Ticker | ETF Name | Watchlist | Recent Price | Smart Investing & Trading Score | Change % | Week % | Year-to-date % |
| XLF | Financial | | 51.91 | 33 | 0.99 | 0.99 | 7.8% |
| IAI | Broker-Dealers & Secs | | 174.97 | 63 | 2.34 | 2.34 | 21.82% |
| KBE | Bank | | 55.98 | 43 | 1.3 | 1.3 | 1.64% |
| FAS | Financial Bull 3X | | 161.82 | 33 | 2.91 | 2.91 | 7.48% |
| FAZ | Financial Bear 3X | | 4.54 | 62 | -2.78 | -2.78 | -27.4% |
| UYG | Financials | | 92.87 | 26 | 1.72 | 1.72 | 9% |
| KIE | Insurance | | 56.42 | 25 | 1.27 | 1.27 | 0.32% |
| 12Stocks.com: Charts, Trends, Fundamental Data and Performances of Financial Stocks | |
|
We now take in-depth look at all Financial stocks including charts, multi-period performances and overall trends (as measured by Smart Investing & Trading Score). One can sort Financial stocks (click link to choose) by Daily, Weekly and by Year-to-Date performances. Also, one can sort by size of the company or by market capitalization. |
| Select Your Default Chart Type: | |||||
| |||||
| Click on stock symbol or name for detailed view. Click on to add stock symbol to your watchlist and to view watchlist. Quick View: Move mouse or cursor over "Daily" to quickly view daily Technical stock chart and over "Weekly" to view weekly Technical stock chart. | |||||

 | ITIC Investors Title Company |
| Sector: Financials | |
| SubSector: Surety & Title Insurance | |
| MarketCap: 219.518 Millions | |
| Recent Price: 215.58 Smart Investing & Trading Score: 64 | |
| Day Percent Change: 2.52% Day Change: 5.3 | |
| Week Change: 2.52% Year-to-date Change: -8.8% | |
| ITIC Links: Profile News Message Board | |
| Charts:- Daily , Weekly | |
| Add ITIC to Watchlist: View: Get Complete ITIC Trend Analysis ➞ | |
 | AON Aon plc |
| Sector: Financials | |
| SubSector: Insurance Brokers | |
| MarketCap: 36870.1 Millions | |
| Recent Price: 360.40 Smart Investing & Trading Score: 64 | |
| Day Percent Change: 1.96% Day Change: 6.94 | |
| Week Change: 1.96% Year-to-date Change: 0.5% | |
| AON Links: Profile News Message Board | |
| Charts:- Daily , Weekly | |
| Add AON to Watchlist: View: Get Complete AON Trend Analysis ➞ | |
 | MA Mastercard Incorporated |
| Sector: Financials | |
| SubSector: Credit Services | |
| MarketCap: 234809 Millions | |
| Recent Price: 569.81 Smart Investing & Trading Score: 64 | |
| Day Percent Change: 1.77% Day Change: 9.92 | |
| Week Change: 1.77% Year-to-date Change: 8.6% | |
| MA Links: Profile News Message Board | |
| Charts:- Daily , Weekly | |
| Add MA to Watchlist: View: Get Complete MA Trend Analysis ➞ | |
 | ALL The Allstate Corporation |
| Sector: Financials | |
| SubSector: Property & Casualty Insurance | |
| MarketCap: 25916.6 Millions | |
| Recent Price: 203.03 Smart Investing & Trading Score: 64 | |
| Day Percent Change: 1.63% Day Change: 3.26 | |
| Week Change: 1.63% Year-to-date Change: 5.8% | |
| ALL Links: Profile News Message Board | |
| Charts:- Daily , Weekly | |
| Add ALL to Watchlist: View: Get Complete ALL Trend Analysis ➞ | |
 | HMN Horace Mann Educators Corporation |
| Sector: Financials | |
| SubSector: Property & Casualty Insurance | |
| MarketCap: 1545.52 Millions | |
| Recent Price: 41.90 Smart Investing & Trading Score: 64 | |
| Day Percent Change: 1.53% Day Change: 0.63 | |
| Week Change: 1.53% Year-to-date Change: 7.7% | |
| HMN Links: Profile News Message Board | |
| Charts:- Daily , Weekly | |
| Add HMN to Watchlist: View: Get Complete HMN Trend Analysis ➞ | |
 | THG The Hanover Insurance Group, Inc. |
| Sector: Financials | |
| SubSector: Property & Casualty Insurance | |
| MarketCap: 3677.92 Millions | |
| Recent Price: 171.39 Smart Investing & Trading Score: 64 | |
| Day Percent Change: 1.52% Day Change: 2.56 | |
| Week Change: 1.52% Year-to-date Change: 11.4% | |
| THG Links: Profile News Message Board | |
| Charts:- Daily , Weekly | |
| Add THG to Watchlist: View: Get Complete THG Trend Analysis ➞ | |
 | ESNT Essent Group Ltd. |
| Sector: Financials | |
| SubSector: Mortgage Investment | |
| MarketCap: 2806.19 Millions | |
| Recent Price: 56.93 Smart Investing & Trading Score: 64 | |
| Day Percent Change: 0.73% Day Change: 0.41 | |
| Week Change: 0.73% Year-to-date Change: 5.2% | |
| ESNT Links: Profile News Message Board | |
| Charts:- Daily , Weekly | |
| Add ESNT to Watchlist: View: Get Complete ESNT Trend Analysis ➞ | |
 | ORC Orchid Island Capital, Inc. |
| Sector: Financials | |
| SubSector: Mortgage Investment | |
| MarketCap: 212.339 Millions | |
| Recent Price: 7.17 Smart Investing & Trading Score: 63 | |
| Day Percent Change: 1.99% Day Change: 0.14 | |
| Week Change: 1.99% Year-to-date Change: -3.6% | |
| ORC Links: Profile News Message Board | |
| Charts:- Daily , Weekly | |
| Add ORC to Watchlist: View: Get Complete ORC Trend Analysis ➞ | |
 | FBNC First Bancorp |
| Sector: Financials | |
| SubSector: Regional - Mid-Atlantic Banks | |
| MarketCap: 664.959 Millions | |
| Recent Price: 49.26 Smart Investing & Trading Score: 63 | |
| Day Percent Change: 1.86% Day Change: 0.9 | |
| Week Change: 1.86% Year-to-date Change: 12.7% | |
| FBNC Links: Profile News Message Board | |
| Charts:- Daily , Weekly | |
| Add FBNC to Watchlist: View: Get Complete FBNC Trend Analysis ➞ | |
 | CBL CBL & Associates Properties, Inc. |
| Sector: Financials | |
| SubSector: REIT - Retail | |
| MarketCap: 690 Millions | |
| Recent Price: 26.78 Smart Investing & Trading Score: 63 | |
| Day Percent Change: 0.83% Day Change: 0.22 | |
| Week Change: 0.83% Year-to-date Change: -5.0% | |
| CBL Links: Profile News Message Board | |
| Charts:- Daily , Weekly | |
| Add CBL to Watchlist: View: Get Complete CBL Trend Analysis ➞ | |
 | ONL Orion Office REIT Inc. |
| Sector: Financials | |
| SubSector: REIT - Office | |
| MarketCap: 375 Millions | |
| Recent Price: 2.56 Smart Investing & Trading Score: 63 | |
| Day Percent Change: -1.16% Day Change: -0.03 | |
| Week Change: -1.16% Year-to-date Change: -30.4% | |
| ONL Links: Profile News Message Board | |
| Charts:- Daily , Weekly | |
| Add ONL to Watchlist: View: Get Complete ONL Trend Analysis ➞ | |
 | JBGS JBG SMITH Properties |
| Sector: Financials | |
| SubSector: Property Management | |
| MarketCap: 4335.32 Millions | |
| Recent Price: 20.56 Smart Investing & Trading Score: 63 | |
| Day Percent Change: -1.67% Day Change: -0.35 | |
| Week Change: -1.67% Year-to-date Change: 33.8% | |
| JBGS Links: Profile News Message Board | |
| Charts:- Daily , Weekly | |
| Add JBGS to Watchlist: View: Get Complete JBGS Trend Analysis ➞ | |
 | VCTR Victory Capital Holdings, Inc. |
| Sector: Financials | |
| SubSector: Asset Management | |
| MarketCap: 1148.33 Millions | |
| Recent Price: 68.93 Smart Investing & Trading Score: 63 | |
| Day Percent Change: 3.19% Day Change: 2.13 | |
| Week Change: 3.19% Year-to-date Change: 6.0% | |
| VCTR Links: Profile News Message Board | |
| Charts:- Daily , Weekly | |
| Add VCTR to Watchlist: View: Get Complete VCTR Trend Analysis ➞ | |
 | REG Regency Centers Corporation |
| Sector: Financials | |
| SubSector: REIT - Retail | |
| MarketCap: 6345.84 Millions | |
| Recent Price: 72.18 Smart Investing & Trading Score: 63 | |
| Day Percent Change: 2.41% Day Change: 1.7 | |
| Week Change: 2.41% Year-to-date Change: -1.4% | |
| REG Links: Profile News Message Board | |
| Charts:- Daily , Weekly | |
| Add REG to Watchlist: View: Get Complete REG Trend Analysis ➞ | |
 | JEF Jefferies Financial Group Inc. |
| Sector: Financials | |
| SubSector: Investment Brokerage - Regional | |
| MarketCap: 3987.15 Millions | |
| Recent Price: 56.57 Smart Investing & Trading Score: 63 | |
| Day Percent Change: 1.18% Day Change: 0.66 | |
| Week Change: 1.18% Year-to-date Change: -27.4% | |
| JEF Links: Profile News Message Board | |
| Charts:- Daily , Weekly | |
| Add JEF to Watchlist: View: Get Complete JEF Trend Analysis ➞ | |
 | XHR Xenia Hotels & Resorts, Inc. |
| Sector: Financials | |
| SubSector: REIT - Hotel/Motel | |
| MarketCap: 1058.24 Millions | |
| Recent Price: 12.79 Smart Investing & Trading Score: 61 | |
| Day Percent Change: 2.48% Day Change: 0.31 | |
| Week Change: 2.48% Year-to-date Change: -12.9% | |
| XHR Links: Profile News Message Board | |
| Charts:- Daily , Weekly | |
| Add XHR to Watchlist: View: Get Complete XHR Trend Analysis ➞ | |
 | ALTI AlTi Global, Inc. |
| Sector: Financials | |
| SubSector: Asset Management | |
| MarketCap: 917 Millions | |
| Recent Price: 4.10 Smart Investing & Trading Score: 61 | |
| Day Percent Change: 5.13% Day Change: 0.2 | |
| Week Change: 5.13% Year-to-date Change: -7.0% | |
| ALTI Links: Profile News Message Board | |
| Charts:- Daily , Weekly | |
| Add ALTI to Watchlist: View: Get Complete ALTI Trend Analysis ➞ | |
 | PAX Patria Investments Limited |
| Sector: Financials | |
| SubSector: Asset Management | |
| MarketCap: 2130 Millions | |
| Recent Price: 13.80 Smart Investing & Trading Score: 61 | |
| Day Percent Change: 3.45% Day Change: 0.46 | |
| Week Change: 3.45% Year-to-date Change: 20.2% | |
| PAX Links: Profile News Message Board | |
| Charts:- Daily , Weekly | |
| Add PAX to Watchlist: View: Get Complete PAX Trend Analysis ➞ | |
 | LAMR Lamar Advertising Company (REIT) |
| Sector: Financials | |
| SubSector: REIT - Diversified | |
| MarketCap: 4838.33 Millions | |
| Recent Price: 123.71 Smart Investing & Trading Score: 61 | |
| Day Percent Change: 2.32% Day Change: 2.8 | |
| Week Change: 2.32% Year-to-date Change: 3.1% | |
| LAMR Links: Profile News Message Board | |
| Charts:- Daily , Weekly | |
| Add LAMR to Watchlist: View: Get Complete LAMR Trend Analysis ➞ | |
 | CADE Cadence Bancorporation |
| Sector: Financials | |
| SubSector: Regional - Southeast Banks | |
| MarketCap: 756.335 Millions | |
| Recent Price: 34.72 Smart Investing & Trading Score: 61 | |
| Day Percent Change: 2.3% Day Change: 0.78 | |
| Week Change: 2.3% Year-to-date Change: 1.7% | |
| CADE Links: Profile News Message Board | |
| Charts:- Daily , Weekly | |
| Add CADE to Watchlist: View: Get Complete CADE Trend Analysis ➞ | |
 | AROW Arrow Financial Corporation |
| Sector: Financials | |
| SubSector: Regional - Northeast Banks | |
| MarketCap: 413.999 Millions | |
| Recent Price: 26.57 Smart Investing & Trading Score: 61 | |
| Day Percent Change: 1.57% Day Change: 0.41 | |
| Week Change: 1.57% Year-to-date Change: -6.5% | |
| AROW Links: Profile News Message Board | |
| Charts:- Daily , Weekly | |
| Add AROW to Watchlist: View: Get Complete AROW Trend Analysis ➞ | |
 | SBCF Seacoast Banking Corporation of Florida |
| Sector: Financials | |
| SubSector: Regional - Mid-Atlantic Banks | |
| MarketCap: 881.559 Millions | |
| Recent Price: 28.05 Smart Investing & Trading Score: 61 | |
| Day Percent Change: 1.48% Day Change: 0.41 | |
| Week Change: 1.48% Year-to-date Change: 2.6% | |
| SBCF Links: Profile News Message Board | |
| Charts:- Daily , Weekly | |
| Add SBCF to Watchlist: View: Get Complete SBCF Trend Analysis ➞ | |
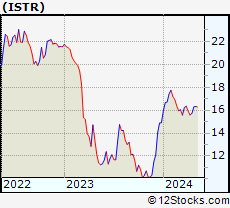 | ISTR Investar Holding Corporation |
| Sector: Financials | |
| SubSector: Regional - Southwest Banks | |
| MarketCap: 136.565 Millions | |
| Recent Price: 21.57 Smart Investing & Trading Score: 61 | |
| Day Percent Change: 1.43% Day Change: 0.31 | |
| Week Change: 1.43% Year-to-date Change: -1.2% | |
| ISTR Links: Profile News Message Board | |
| Charts:- Daily , Weekly | |
| Add ISTR to Watchlist: View: Get Complete ISTR Trend Analysis ➞ | |
 | AIV Apartment Investment and Management Company |
| Sector: Financials | |
| SubSector: REIT - Residential | |
| MarketCap: 4485.11 Millions | |
| Recent Price: 8.47 Smart Investing & Trading Score: 61 | |
| Day Percent Change: 0.95% Day Change: 0.08 | |
| Week Change: 0.95% Year-to-date Change: -0.2% | |
| AIV Links: Profile News Message Board | |
| Charts:- Daily , Weekly | |
| Add AIV to Watchlist: View: Get Complete AIV Trend Analysis ➞ | |
 | PPBI Pacific Premier Bancorp, Inc. |
| Sector: Financials | |
| SubSector: Regional - Pacific Banks | |
| MarketCap: 978.029 Millions | |
| Recent Price: 21.73 Smart Investing & Trading Score: 60 | |
| Day Percent Change: 2.6% Day Change: 0.55 | |
| Week Change: 2.6% Year-to-date Change: -11.7% | |
| PPBI Links: Profile News Message Board | |
| Charts:- Daily , Weekly | |
| Add PPBI to Watchlist: View: Get Complete PPBI Trend Analysis ➞ | |
| For tabular summary view of above stock list: Summary View ➞ 0 - 25 , 25 - 50 , 50 - 75 , 75 - 100 , 100 - 125 , 125 - 150 , 150 - 175 , 175 - 200 , 200 - 225 , 225 - 250 , 250 - 275 , 275 - 300 , 300 - 325 , 325 - 350 , 350 - 375 , 375 - 400 , 400 - 425 , 425 - 450 , 450 - 475 , 475 - 500 , 500 - 525 , 525 - 550 , 550 - 575 | ||
| Click To Change The Sort Order: By Market Cap or Company Size Performance: Year-to-date, Week and Day | |
| Select Chart Type: | ||
|
Best Stocks Today 12Stocks.com |
© 2025 12Stocks.com Terms & Conditions Privacy Contact Us
All Information Provided Only For Education And Not To Be Used For Investing or Trading. See Terms & Conditions


One More Thing ... Get Best Stocks Delivered Daily!
Never Ever Miss A Move With Our Top Ten Stocks Lists
Find Best Stocks In Any Market - Bull or Bear Market
Take A Peek At Our Top Ten Stocks Lists: Daily, Weekly, Year-to-Date & Top Trends
Find Best Stocks In Any Market - Bull or Bear Market
Take A Peek At Our Top Ten Stocks Lists: Daily, Weekly, Year-to-Date & Top Trends
Financial Stocks With Best Up Trends [0-bearish to 100-bullish]: Uniti [100], LendingTree [100], Mercury General[100], Perella Weinberg[100], Broadstone Net[100], LendingClub [100], TPG RE[100], CareTrust REIT[100], Stewart Information[100], Healthcare Realty[100], VICI Properties[100]
Best Financial Stocks Year-to-Date:
ESSA Bancorp[3207.77%], Easterly Government[108.45%], Mr. Cooper[86.58%], Heritage Insurance[75.29%], Root [65.29%], Industrial Logistics[64.89%], Rocket [58.42%], Diversified Healthcare[49.61%], ProAssurance [49.59%], Uniti [47.09%], SoFi Technologies[41.62%] Best Financial Stocks This Week:
Uniti [64.77%], Industrial Logistics[11.36%], LendingTree [7.32%], eXp World[7.27%], EverQuote [6.89%], Camping World[6.84%], First Foundation[6.69%], Diamond Hill[5.46%], Mercury General[5.36%], Cipher Mining[5.27%], AlTi Global[5.13%] Best Financial Stocks Daily:
Uniti [64.77%], Industrial Logistics[11.36%], LendingTree [7.32%], eXp World[7.27%], EverQuote [6.89%], Camping World[6.84%], First Foundation[6.69%], Diamond Hill[5.46%], Mercury General[5.36%], Cipher Mining[5.27%], AlTi Global[5.13%]