
 Login Sign Up


| |||||
 |  | ||||

| 12Stocks.com Market Intelligence |
Best Financial Stocks
| In a hurry? Financial Stocks Lists: Performance Trends Table, Stock Charts
Sort Financial stocks: Daily, Weekly, Year-to-Date, Market Cap & Trends. Filter Financial stocks list by size:All Financial Large Mid-Range Small & MicroCap |
| 12Stocks.com Financial Stocks Performances & Trends Daily | |||||||||
|
|  The overall Smart Investing & Trading Score is 90 (0-bearish to 100-bullish) which puts Financial sector in short term bullish trend. The Smart Investing & Trading Score from previous trading session is 60 and an improvement of trend continues.
| ||||||||
Here are the Smart Investing & Trading Scores of the most requested Financial stocks at 12Stocks.com (click stock name for detailed review):
|


| 12Stocks.com: Investing in Financial sector with Stocks | |
|
The following table helps investors and traders sort through current performance and trends (as measured by Smart Investing & Trading Score) of various
stocks in the Financial sector. Quick View: Move mouse or cursor over stock symbol (ticker) to view short-term Technical chart and over stock name to view long term chart. Click on  to add stock symbol to your watchlist and to add stock symbol to your watchlist and  to view watchlist. Click on any ticker or stock name for detailed market intelligence report for that stock. to view watchlist. Click on any ticker or stock name for detailed market intelligence report for that stock. |
12Stocks.com Performance of Stocks in Financial Sector
| Ticker | Stock Name | Watchlist | Category | Recent Price | Smart Investing & Trading Score | Change % | YTD Change% |
| ARGO | Argo |   | Insurance | 29.99 | 50 | 0.00% | 0.00% |
| AMK | AssetMark | | Asset Mgmt | 35.24 | 60 | -0.06% | 0.00% |
| JPS | Nuveen Preferred | | Closed-End Fund - Debt | 6.21 | 60 | 0.00% | 0.00% |
| CLNY | Colony Capital | | REIT - | 27.52 | 60 | 1.18% | 0.00% |
| BRMK | Broadmark Realty | | Mortgage | 4.82 | 30 | 0.00% | 0.00% |
| BIF | Boulder Growth | | Closed-End Fund - Equity | 13.28 | 20 | -1.48% | 0.00% |
| BRP | BRP | | Real Estatet | 32.66 | 80 | 0.46% | 0.00% |
| SCU | Sculptor Capital | | Asset Mgmt | 12.72 | 60 | -0.24% | 0.00% |
| OXLCM | Oxford Lane | | Asset Mgmt | 24.98 | 20 | 0.00% | 0.00% |
| GAINM | Gladstone | | Asset Mgmt | 14.09 | 20 | 0.64% | 0.00% |
| NID | Nuveen Intermediate | | Asset Mgmt | 13.00 | 30 | 0.00% | 0.00% |
| VTA | Invesco Dynamic | | Closed-End Fund - Debt | 11.45 | 20 | 0.00% | 0.00% |
| GOODM | Gladstone Commercial | | REIT - | 25.01 | 20 | 0.00% | 0.00% |
| PPR | Voya Prime | | Closed-End Fund - Debt | 4.60 | 20 | 0.22% | 0.00% |
| PROS | ProSight Global | | Insurance | 12.85 | 20 | 0.00% | 0.00% |
| OBNK | Origin Bancorp | | Regional Banks | 32.27 | 70 | 0.12% | 0.00% |
| MFL | BlackRock Muni | | Closed-End Fund - Debt | 13.12 | 90 | 10.81% | 0.00% |
| BSIG | BrightSphere | | Asset Mgmt | 26.34 | 20 | -0.11% | 0.00% |
| CBTX | CBTX | | Regional Banks | 29.15 | 0 | 0.10% | 0.00% |
| MCA | BlackRock MuniYield | | Closed-End Fund - Debt | 13.53 | 70 | 8.15% | 0.00% |
| ECCB | Eagle Point | | Asset Mgmt | 24.99 | 10 | 0.00% | 0.00% |
| FSD | First Trust | | Closed-End Fund - Debt | 12.22 | 10 | -1.85% | 0.00% |
| PKO | PIMCO ome | | Closed-End Fund - Debt | 23.77 | 20 | 0.00% | 0.00% |
| PUYI | Puyi | | Asset Mgmt | 9.00 | 50 | 0.00% | 0.00% |
| NEV | Nuveen Enhanced | | Asset Mgmt | 12.51 | 30 | 0.00% | 0.00% |
| For chart view version of above stock list: Chart View ➞ 0 - 25 , 25 - 50 , 50 - 75 , 75 - 100 , 100 - 125 , 125 - 150 , 150 - 175 , 175 - 200 , 200 - 225 , 225 - 250 , 250 - 275 , 275 - 300 , 300 - 325 , 325 - 350 , 350 - 375 , 375 - 400 , 400 - 425 , 425 - 450 , 450 - 475 , 475 - 500 , 500 - 525 , 525 - 550 , 550 - 575 , 575 - 600 , 600 - 625 , 625 - 650 , 650 - 675 , 675 - 700 , 700 - 725 , 725 - 750 , 750 - 775 , 775 - 800 , 800 - 825 , 825 - 850 , 850 - 875 , 875 - 900 , 900 - 925 , 925 - 950 , 950 - 975 , 975 - 1000 , 1000 - 1025 , 1025 - 1050 , 1050 - 1075 , 1075 - 1100 , 1100 - 1125 , 1125 - 1150 , 1150 - 1175 , 1175 - 1200 , 1200 - 1225 , 1225 - 1250 , 1250 - 1275 , 1275 - 1300 , 1300 - 1325 , 1325 - 1350 , 1350 - 1375 , 1375 - 1400 , 1400 - 1425 , 1425 - 1450 , 1450 - 1475 , 1475 - 1500 , 1500 - 1525 , 1525 - 1550 | ||
 | Click To Change The Sort Order: By Market Cap or Company Size Performance: Year-to-date, Week and Day |  |
|
Get the most comprehensive stock market coverage daily at 12Stocks.com ➞ Best Stocks Today ➞ Best Stocks Weekly ➞ Best Stocks Year-to-Date ➞ Best Stocks Trends ➞  Best Stocks Today 12Stocks.com Best Nasdaq Stocks ➞ Best S&P 500 Stocks ➞ Best Tech Stocks ➞ Best Biotech Stocks ➞ |
| Detailed Overview of Financial Stocks |
| Financial Technical Overview, Leaders & Laggards, Top Financial ETF Funds & Detailed Financial Stocks List, Charts, Trends & More |
| Financial Sector: Technical Analysis, Trends & YTD Performance | |
| Financial sector is composed of stocks
from banks, brokers, insurance, REITs
and services subsectors. Financial sector, as represented by XLF, an exchange-traded fund [ETF] that holds basket of Financial stocks (e.g, Bank of America, Goldman Sachs) is up by 13.0735% and is currently underperforming the overall market by -0.7866% year-to-date. Below is a quick view of Technical charts and trends: |
|
 XLF Weekly Chart |
|
| Long Term Trend: Good | |
| Medium Term Trend: Good | |
 XLF Daily Chart |
|
| Short Term Trend: Very Good | |
| Overall Trend Score: 90 | |
| YTD Performance: 13.0735% | |
| **Trend Scores & Views Are Only For Educational Purposes And Not For Investing | |
| 12Stocks.com: Top Performing Financial Sector Stocks | |||||||||||||||||||||||||||||||||||||||||||||||
 The top performing Financial sector stocks year to date are
Now, more recently, over last week, the top performing Financial sector stocks on the move are


|
|||||||||||||||||||||||||||||||||||||||||||||||
| 12Stocks.com: Investing in Financial Sector using Exchange Traded Funds | |
|
The following table shows list of key exchange traded funds (ETF) that
help investors track Financial Index. For detailed view, check out our ETF Funds section of our website. Quick View: Move mouse or cursor over ETF symbol (ticker) to view short-term Technical chart and over ETF name to view long term chart. Click on ticker or stock name for detailed view. Click on to add stock symbol to your watchlist and to view watchlist. |
12Stocks.com List of ETFs that track Financial Index
| Ticker | ETF Name | Watchlist | Recent Price | Smart Investing & Trading Score | Change % | Week % | Year-to-date % |
| CHIX | China Financials | | 10.57 | 20 | 0 | 0 | 0% |
| 12Stocks.com: Charts, Trends, Fundamental Data and Performances of Financial Stocks | |
|
We now take in-depth look at all Financial stocks including charts, multi-period performances and overall trends (as measured by Smart Investing & Trading Score). One can sort Financial stocks (click link to choose) by Daily, Weekly and by Year-to-Date performances. Also, one can sort by size of the company or by market capitalization. |
| Select Your Default Chart Type: | |||||
| |||||
| Click on stock symbol or name for detailed view. Click on to add stock symbol to your watchlist and to view watchlist. Quick View: Move mouse or cursor over "Daily" to quickly view daily Technical stock chart and over "Weekly" to view weekly Technical stock chart. | |||||

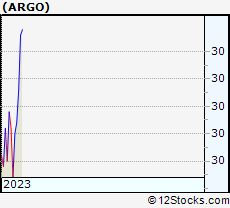 | ARGO Argo Group International Holdings, Ltd. |
| Sector: Financials | |
| SubSector: Property & Casualty Insurance | |
| MarketCap: 1299.72 Millions | |
| Recent Price: 29.99 Smart Investing & Trading Score: 50 | |
| Day Percent Change: 0% Day Change: -9999 | |
| Week Change: 0.33456% Year-to-date Change: 0.0% | |
| ARGO Links: Profile News Message Board | |
| Charts:- Daily , Weekly | |
| Add ARGO to Watchlist: View: Get Complete ARGO Trend Analysis ➞ | |
 | AMK AssetMark Financial Holdings, Inc. |
| Sector: Financials | |
| SubSector: Asset Management | |
| MarketCap: 1296.33 Millions | |
| Recent Price: 35.24 Smart Investing & Trading Score: 60 | |
| Day Percent Change: -0.0567215% Day Change: -9999 | |
| Week Change: 0.39886% Year-to-date Change: 0.0% | |
| AMK Links: Profile News Message Board | |
| Charts:- Daily , Weekly | |
| Add AMK to Watchlist: View: Get Complete AMK Trend Analysis ➞ | |
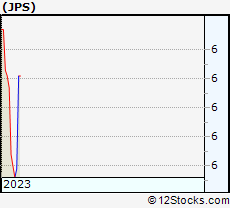 | JPS Nuveen Preferred Securities Income Fund |
| Sector: Financials | |
| SubSector: Closed-End Fund - Debt | |
| MarketCap: 1236.97 Millions | |
| Recent Price: 6.21 Smart Investing & Trading Score: 60 | |
| Day Percent Change: 0% Day Change: -9999 | |
| Week Change: 5.43294% Year-to-date Change: 0.0% | |
| JPS Links: Profile News Message Board | |
| Charts:- Daily , Weekly | |
| Add JPS to Watchlist: View: Get Complete JPS Trend Analysis ➞ | |
 | CLNY Colony Capital, Inc. |
| Sector: Financials | |
| SubSector: REIT - Diversified | |
| MarketCap: 1078.53 Millions | |
| Recent Price: 27.52 Smart Investing & Trading Score: 60 | |
| Day Percent Change: 1.17647% Day Change: -9999 | |
| Week Change: -1.9943% Year-to-date Change: 0.0% | |
| CLNY Links: Profile News Message Board | |
| Charts:- Daily , Weekly | |
| Add CLNY to Watchlist: View: Get Complete CLNY Trend Analysis ➞ | |
 | BRMK Broadmark Realty Capital Inc. |
| Sector: Financials | |
| SubSector: Mortgage Investment | |
| MarketCap: 1051.09 Millions | |
| Recent Price: 4.82 Smart Investing & Trading Score: 30 | |
| Day Percent Change: 0% Day Change: -9999 | |
| Week Change: 0% Year-to-date Change: 0.0% | |
| BRMK Links: Profile News Message Board | |
| Charts:- Daily , Weekly | |
| Add BRMK to Watchlist: View: Get Complete BRMK Trend Analysis ➞ | |
 | BIF Boulder Growth & Income Fund, Inc. |
| Sector: Financials | |
| SubSector: Closed-End Fund - Equity | |
| MarketCap: 837.847 Millions | |
| Recent Price: 13.28 Smart Investing & Trading Score: 20 | |
| Day Percent Change: -1.48368% Day Change: -9999 | |
| Week Change: 2.31125% Year-to-date Change: 0.0% | |
| BIF Links: Profile News Message Board | |
| Charts:- Daily , Weekly | |
| Add BIF to Watchlist: View: Get Complete BIF Trend Analysis ➞ | |
 | BRP BRP Group, Inc. |
| Sector: Financials | |
| SubSector: Real Estate Development | |
| MarketCap: 741.219 Millions | |
| Recent Price: 32.66 Smart Investing & Trading Score: 80 | |
| Day Percent Change: 0.461396% Day Change: -9999 | |
| Week Change: 8.79414% Year-to-date Change: 0.0% | |
| BRP Links: Profile News Message Board | |
| Charts:- Daily , Weekly | |
| Add BRP to Watchlist: View: Get Complete BRP Trend Analysis ➞ | |
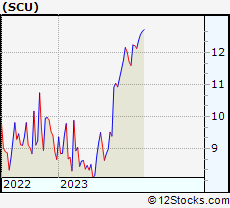 | SCU Sculptor Capital Management, Inc. |
| Sector: Financials | |
| SubSector: Asset Management | |
| MarketCap: 689.803 Millions | |
| Recent Price: 12.72 Smart Investing & Trading Score: 60 | |
| Day Percent Change: -0.235294% Day Change: -9999 | |
| Week Change: 0.55336% Year-to-date Change: 0.0% | |
| SCU Links: Profile News Message Board | |
| Charts:- Daily , Weekly | |
| Add SCU to Watchlist: View: Get Complete SCU Trend Analysis ➞ | |
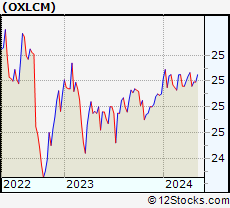 | OXLCM Oxford Lane Capital Corp. |
| Sector: Financials | |
| SubSector: Asset Management | |
| MarketCap: 672.603 Millions | |
| Recent Price: 24.98 Smart Investing & Trading Score: 20 | |
| Day Percent Change: 0% Day Change: -9999 | |
| Week Change: 0% Year-to-date Change: 0.0% | |
| OXLCM Links: Profile News Message Board | |
| Charts:- Daily , Weekly | |
| Add OXLCM to Watchlist: View: Get Complete OXLCM Trend Analysis ➞ | |
 | GAINM Gladstone Investment Corporation |
| Sector: Financials | |
| SubSector: Asset Management | |
| MarketCap: 593.603 Millions | |
| Recent Price: 14.09 Smart Investing & Trading Score: 20 | |
| Day Percent Change: 0.642857% Day Change: -9999 | |
| Week Change: -43.7749% Year-to-date Change: 0.0% | |
| GAINM Links: Profile News Message Board | |
| Charts:- Daily , Weekly | |
| Add GAINM to Watchlist: View: Get Complete GAINM Trend Analysis ➞ | |
 | NID Nuveen Intermediate Duration Municipal Term Fund |
| Sector: Financials | |
| SubSector: Asset Management | |
| MarketCap: 560.203 Millions | |
| Recent Price: 13.00 Smart Investing & Trading Score: 30 | |
| Day Percent Change: 0% Day Change: -9999 | |
| Week Change: 0% Year-to-date Change: 0.0% | |
| NID Links: Profile News Message Board | |
| Charts:- Daily , Weekly | |
| Add NID to Watchlist: View: Get Complete NID Trend Analysis ➞ | |
 | VTA Invesco Dynamic Credit Opportunities Fund |
| Sector: Financials | |
| SubSector: Closed-End Fund - Debt | |
| MarketCap: 534.207 Millions | |
| Recent Price: 11.45 Smart Investing & Trading Score: 20 | |
| Day Percent Change: 0% Day Change: -9999 | |
| Week Change: 0% Year-to-date Change: 0.0% | |
| VTA Links: Profile News Message Board | |
| Charts:- Daily , Weekly | |
| Add VTA to Watchlist: View: Get Complete VTA Trend Analysis ➞ | |
 | GOODM Gladstone Commercial Corporation |
| Sector: Financials | |
| SubSector: REIT - Diversified | |
| MarketCap: 520.353 Millions | |
| Recent Price: 25.01 Smart Investing & Trading Score: 20 | |
| Day Percent Change: 0% Day Change: -9999 | |
| Week Change: 0% Year-to-date Change: 0.0% | |
| GOODM Links: Profile News Message Board | |
| Charts:- Daily , Weekly | |
| Add GOODM to Watchlist: View: Get Complete GOODM Trend Analysis ➞ | |
 | PPR Voya Prime Rate Trust |
| Sector: Financials | |
| SubSector: Closed-End Fund - Debt | |
| MarketCap: 508.307 Millions | |
| Recent Price: 4.60 Smart Investing & Trading Score: 20 | |
| Day Percent Change: 0.217865% Day Change: -9999 | |
| Week Change: 0.217865% Year-to-date Change: 0.0% | |
| PPR Links: Profile News Message Board | |
| Charts:- Daily , Weekly | |
| Add PPR to Watchlist: View: Get Complete PPR Trend Analysis ➞ | |
 | PROS ProSight Global, Inc. |
| Sector: Financials | |
| SubSector: Property & Casualty Insurance | |
| MarketCap: 496.312 Millions | |
| Recent Price: 12.85 Smart Investing & Trading Score: 20 | |
| Day Percent Change: 0% Day Change: -9999 | |
| Week Change: 0% Year-to-date Change: 0.0% | |
| PROS Links: Profile News Message Board | |
| Charts:- Daily , Weekly | |
| Add PROS to Watchlist: View: Get Complete PROS Trend Analysis ➞ | |
 | OBNK Origin Bancorp, Inc. |
| Sector: Financials | |
| SubSector: Regional - Southeast Banks | |
| MarketCap: 494.235 Millions | |
| Recent Price: 32.27 Smart Investing & Trading Score: 70 | |
| Day Percent Change: 0.124108% Day Change: -9999 | |
| Week Change: 4.90897% Year-to-date Change: 0.0% | |
| OBNK Links: Profile News Message Board | |
| Charts:- Daily , Weekly | |
| Add OBNK to Watchlist: View: Get Complete OBNK Trend Analysis ➞ | |
 | MFL BlackRock MuniHoldings Investment Quality Fund |
| Sector: Financials | |
| SubSector: Closed-End Fund - Debt | |
| MarketCap: 430.707 Millions | |
| Recent Price: 13.12 Smart Investing & Trading Score: 90 | |
| Day Percent Change: 10.8108% Day Change: -9999 | |
| Week Change: 6.93269% Year-to-date Change: 0.0% | |
| MFL Links: Profile News Message Board | |
| Charts:- Daily , Weekly | |
| Add MFL to Watchlist: View: Get Complete MFL Trend Analysis ➞ | |
 | BSIG BrightSphere Investment Group Inc. |
| Sector: Financials | |
| SubSector: Asset Management | |
| MarketCap: 430.103 Millions | |
| Recent Price: 26.34 Smart Investing & Trading Score: 20 | |
| Day Percent Change: -0.113766% Day Change: -9999 | |
| Week Change: -2.48056% Year-to-date Change: 0.0% | |
| BSIG Links: Profile News Message Board | |
| Charts:- Daily , Weekly | |
| Add BSIG to Watchlist: View: Get Complete BSIG Trend Analysis ➞ | |
 | CBTX CBTX, Inc. |
| Sector: Financials | |
| SubSector: Regional - Southeast Banks | |
| MarketCap: 421.235 Millions | |
| Recent Price: 29.15 Smart Investing & Trading Score: 0 | |
| Day Percent Change: 0.103022% Day Change: -9999 | |
| Week Change: -1.01868% Year-to-date Change: 0.0% | |
| CBTX Links: Profile News Message Board | |
| Charts:- Daily , Weekly | |
| Add CBTX to Watchlist: View: Get Complete CBTX Trend Analysis ➞ | |
 | MCA BlackRock MuniYield California Quality Fund, Inc. |
| Sector: Financials | |
| SubSector: Closed-End Fund - Debt | |
| MarketCap: 418.007 Millions | |
| Recent Price: 13.53 Smart Investing & Trading Score: 70 | |
| Day Percent Change: 8.15348% Day Change: -9999 | |
| Week Change: 3379.04% Year-to-date Change: 0.0% | |
| MCA Links: Profile News Message Board | |
| Charts:- Daily , Weekly | |
| Add MCA to Watchlist: View: Get Complete MCA Trend Analysis ➞ | |
 | ECCB Eagle Point Credit Company Inc. |
| Sector: Financials | |
| SubSector: Asset Management | |
| MarketCap: 394.603 Millions | |
| Recent Price: 24.99 Smart Investing & Trading Score: 10 | |
| Day Percent Change: 0% Day Change: -9999 | |
| Week Change: -0.04% Year-to-date Change: 0.0% | |
| ECCB Links: Profile News Message Board | |
| Charts:- Daily , Weekly | |
| Add ECCB to Watchlist: View: Get Complete ECCB Trend Analysis ➞ | |
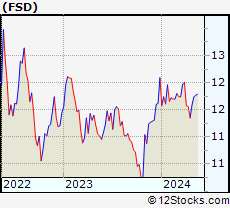 | FSD First Trust High Income Long/Short Fund |
| Sector: Financials | |
| SubSector: Closed-End Fund - Debt | |
| MarketCap: 362.607 Millions | |
| Recent Price: 12.22 Smart Investing & Trading Score: 10 | |
| Day Percent Change: -1.84739% Day Change: -9999 | |
| Week Change: -0.407498% Year-to-date Change: 0.0% | |
| FSD Links: Profile News Message Board | |
| Charts:- Daily , Weekly | |
| Add FSD to Watchlist: View: Get Complete FSD Trend Analysis ➞ | |
 | PKO PIMCO Income Opportunity Fund |
| Sector: Financials | |
| SubSector: Closed-End Fund - Debt | |
| MarketCap: 320.807 Millions | |
| Recent Price: 23.77 Smart Investing & Trading Score: 20 | |
| Day Percent Change: 0% Day Change: -9999 | |
| Week Change: -1.08198% Year-to-date Change: 0.0% | |
| PKO Links: Profile News Message Board | |
| Charts:- Daily , Weekly | |
| Add PKO to Watchlist: View: Get Complete PKO Trend Analysis ➞ | |
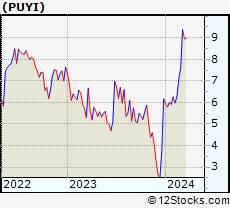 | PUYI Puyi Inc. |
| Sector: Financials | |
| SubSector: Asset Management | |
| MarketCap: 320.803 Millions | |
| Recent Price: 9.00 Smart Investing & Trading Score: 50 | |
| Day Percent Change: 0% Day Change: -9999 | |
| Week Change: 0.559783% Year-to-date Change: 0.0% | |
| PUYI Links: Profile News Message Board | |
| Charts:- Daily , Weekly | |
| Add PUYI to Watchlist: View: Get Complete PUYI Trend Analysis ➞ | |
 | NEV Nuveen Enhanced Municipal Value Fund |
| Sector: Financials | |
| SubSector: Asset Management | |
| MarketCap: 299.103 Millions | |
| Recent Price: 12.51 Smart Investing & Trading Score: 30 | |
| Day Percent Change: 0% Day Change: -9999 | |
| Week Change: 2.79376% Year-to-date Change: 0.0% | |
| NEV Links: Profile News Message Board | |
| Charts:- Daily , Weekly | |
| Add NEV to Watchlist: View: Get Complete NEV Trend Analysis ➞ | |
| For tabular summary view of above stock list: Summary View ➞ 0 - 25 , 25 - 50 , 50 - 75 , 75 - 100 , 100 - 125 , 125 - 150 , 150 - 175 , 175 - 200 , 200 - 225 , 225 - 250 , 250 - 275 , 275 - 300 , 300 - 325 , 325 - 350 , 350 - 375 , 375 - 400 , 400 - 425 , 425 - 450 , 450 - 475 , 475 - 500 , 500 - 525 , 525 - 550 , 550 - 575 , 575 - 600 , 600 - 625 , 625 - 650 , 650 - 675 , 675 - 700 , 700 - 725 , 725 - 750 , 750 - 775 , 775 - 800 , 800 - 825 , 825 - 850 , 850 - 875 , 875 - 900 , 900 - 925 , 925 - 950 , 950 - 975 , 975 - 1000 , 1000 - 1025 , 1025 - 1050 , 1050 - 1075 , 1075 - 1100 , 1100 - 1125 , 1125 - 1150 , 1150 - 1175 , 1175 - 1200 , 1200 - 1225 , 1225 - 1250 , 1250 - 1275 , 1275 - 1300 , 1300 - 1325 , 1325 - 1350 , 1350 - 1375 , 1375 - 1400 , 1400 - 1425 , 1425 - 1450 , 1450 - 1475 , 1475 - 1500 , 1500 - 1525 , 1525 - 1550 | ||
| Click To Change The Sort Order: By Market Cap or Company Size Performance: Year-to-date, Week and Day | |
| Select Chart Type: | ||
|
Best Stocks Today 12Stocks.com |
© 2025 12Stocks.com Terms & Conditions Privacy Contact Us
All Information Provided Only For Education And Not To Be Used For Investing or Trading. See Terms & Conditions


One More Thing ... Get Best Stocks Delivered Daily!
Never Ever Miss A Move With Our Top Ten Stocks Lists
Find Best Stocks In Any Market - Bull or Bear Market
Take A Peek At Our Top Ten Stocks Lists: Daily, Weekly, Year-to-Date & Top Trends
Find Best Stocks In Any Market - Bull or Bear Market
Take A Peek At Our Top Ten Stocks Lists: Daily, Weekly, Year-to-Date & Top Trends
Financial Stocks With Best Up Trends [0-bearish to 100-bullish]: Better Home[100], AMREP Corp[100], PIMCO California[100], Torchmark [100], PIMCO California[100], Triumph Bancorp[100], StepStone [100], Radian [100], National Bank[100], PIMCO Municipal[100], MARA [100]
Best Financial Stocks Year-to-Date:
Insight Select[12384.6%], Oxford Lane[292.479%], Better Home[250.328%], Metalpha Technology[213.274%], Robinhood Markets[206.567%], Cipher Mining[145.528%], Mr. Cooper[133.957%], Banco Santander[130.037%], IHS Holding[117.61%], Deutsche Bank[114.776%], LoanDepot [110.733%] Best Financial Stocks This Week:
Colony Starwood[15929900%], Blackhawk Network[91300%], Macquarie Global[81662.9%], Credit Suisse[63241.6%], Pennsylvania Real[23823%], First Republic[22570.9%], Select ome[14000%], CorEnergy Infrastructure[6797.78%], FedNat Holding[5525%], BlackRock Municipal[5340%], BlackRock MuniYield[3379.04%] Best Financial Stocks Daily:
Better Home[13.3451%], AMREP Corp[11.992%], PIMCO California[11.9545%], Torchmark [11.8363%], Forge Global[11.5409%], PIMCO California[11.4754%], BlackRock Muni[10.8108%], Blackrock MuniYield[10.72%], Triumph Bancorp[10.2661%], StepStone [8.74771%], BlackRock MuniYield[8.15348%]