
 Login Sign Up


| |||||
 |  | ||||

| 12Stocks.com Market Intelligence |
Best Financial Stocks
| In a hurry? Financial Stocks Lists: Performance Trends Table, Stock Charts
Sort Financial stocks: Daily, Weekly, Year-to-Date, Market Cap & Trends. Filter Financial stocks list by size:All Financial Large Mid-Range Small & MicroCap |
| 12Stocks.com Financial Stocks Performances & Trends Daily | |||||||||
|
|  The overall Smart Investing & Trading Score is 90 (0-bearish to 100-bullish) which puts Financial sector in short term bullish trend. The Smart Investing & Trading Score from previous trading session is 60 and an improvement of trend continues.
| ||||||||
Here are the Smart Investing & Trading Scores of the most requested Financial stocks at 12Stocks.com (click stock name for detailed review):
|


| 12Stocks.com: Investing in Financial sector with Stocks | |
|
The following table helps investors and traders sort through current performance and trends (as measured by Smart Investing & Trading Score) of various
stocks in the Financial sector. Quick View: Move mouse or cursor over stock symbol (ticker) to view short-term Technical chart and over stock name to view long term chart. Click on  to add stock symbol to your watchlist and to add stock symbol to your watchlist and  to view watchlist. Click on any ticker or stock name for detailed market intelligence report for that stock. to view watchlist. Click on any ticker or stock name for detailed market intelligence report for that stock. |
12Stocks.com Performance of Stocks in Financial Sector
| Ticker | Stock Name | Watchlist | Category | Recent Price | Smart Investing & Trading Score | Change % | YTD Change% |
| SONA | Southern National |   | Regional Banks | 21.22 | 80 | -1.62% | 0.00% |
| PFBI | Premier | | Regional Banks | 10.30 | 30 | 1.08% | 0.00% |
| ABDC | Alcentra Capital | | Asset Mgmt | 2.64 | 20 | -4.00% | 0.00% |
| ESXB | Community Bankers | | Investments | 18.22 | 100 | 1.28% | 0.00% |
| HBMD | Howard Bancorp | | Regional Banks | 44.34 | 100 | 0.02% | 0.00% |
| ORM | Owens Realty | | REIT - Office | 44.34 | 100 | 0.02% | 0.00% |
| CUBN | Commerce Union | | Regional Banks | 5.04 | 20 | 1.41% | 0.00% |
| PMBC | Pacific Mercantile | | Regional Banks | 4.69 | 30 | 0.21% | 0.00% |
| LAQ | Aberdeen Latin | | Asset Mgmt | 4.69 | 40 | 0.21% | 0.00% |
| VMM | Delaware s | | Asset Mgmt | 10.21 | 20 | -6.93% | 0.00% |
| MSL | MidSouth Bancorp | | Regional Banks | 44.30 | 70 | 0.16% | 0.00% |
| TCFC | Community | | Regional Banks | 46.14 | 70 | -0.17% | 0.00% |
| PBIP | Prudential Bancorp | | S&L | 57.10 | 70 | -2.34% | 0.00% |
| SBCP | Sunshine Bancorp | | Regional Banks | 0.17 | 10 | 0.00% | 0.00% |
| GRIF | Griffin Industrial | | Property Mgmt | 19.00 | 50 | 0.58% | 0.00% |
| ENFC | Entegra | | Regional Banks | 8.85 | 40 | 1.14% | 0.00% |
| TRCB | Two River | | Regional Banks | 14.23 | 40 | 0.49% | 0.00% |
| KCAP | KCAP | | Investments | 21.47 | 60 | -0.14% | 0.00% |
| FCCY | 1st Constitution | | Regional Banks | 20.66 | 0 | 0.54% | 0.00% |
| EVBS | Eastern Virginia | | Regional Banks | 3.52 | 10 | -0.56% | 0.00% |
| CMFN | CM Finance | | Asset Mgmt | 20.42 | 60 | 0.79% | 0.00% |
| DNBF | DNB | | Regional Banks | 20.05 | 90 | 5.80% | 0.00% |
| MLVF | Malvern Bancorp | | S&L | 93.11 | 80 | 1.00% | 0.00% |
| BOCH | Bank of Commerce | | Regional Banks | 93.11 | 80 | 1.00% | 0.00% |
| NKG | Nuveen Georgia | | Asset Mgmt | 5.75 | 70 | 0.35% | 0.00% |
| For chart view version of above stock list: Chart View ➞ 0 - 25 , 25 - 50 , 50 - 75 , 75 - 100 , 100 - 125 , 125 - 150 , 150 - 175 , 175 - 200 , 200 - 225 , 225 - 250 , 250 - 275 , 275 - 300 , 300 - 325 , 325 - 350 , 350 - 375 , 375 - 400 , 400 - 425 , 425 - 450 , 450 - 475 , 475 - 500 , 500 - 525 , 525 - 550 , 550 - 575 , 575 - 600 , 600 - 625 , 625 - 650 , 650 - 675 , 675 - 700 , 700 - 725 , 725 - 750 , 750 - 775 , 775 - 800 , 800 - 825 , 825 - 850 , 850 - 875 , 875 - 900 , 900 - 925 , 925 - 950 , 950 - 975 , 975 - 1000 , 1000 - 1025 , 1025 - 1050 , 1050 - 1075 , 1075 - 1100 , 1100 - 1125 , 1125 - 1150 , 1150 - 1175 , 1175 - 1200 , 1200 - 1225 , 1225 - 1250 , 1250 - 1275 , 1275 - 1300 , 1300 - 1325 , 1325 - 1350 , 1350 - 1375 , 1375 - 1400 , 1400 - 1425 , 1425 - 1450 , 1450 - 1475 , 1475 - 1500 , 1500 - 1525 , 1525 - 1550 | ||
 | Click To Change The Sort Order: By Market Cap or Company Size Performance: Year-to-date, Week and Day |  |
|
Get the most comprehensive stock market coverage daily at 12Stocks.com ➞ Best Stocks Today ➞ Best Stocks Weekly ➞ Best Stocks Year-to-Date ➞ Best Stocks Trends ➞  Best Stocks Today 12Stocks.com Best Nasdaq Stocks ➞ Best S&P 500 Stocks ➞ Best Tech Stocks ➞ Best Biotech Stocks ➞ |
| Detailed Overview of Financial Stocks |
| Financial Technical Overview, Leaders & Laggards, Top Financial ETF Funds & Detailed Financial Stocks List, Charts, Trends & More |
| Financial Sector: Technical Analysis, Trends & YTD Performance | |
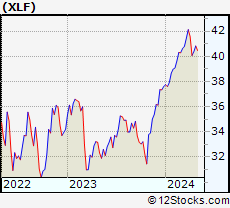
| Financial sector is composed of stocks
from banks, brokers, insurance, REITs
and services subsectors. Financial sector, as represented by XLF, an exchange-traded fund [ETF] that holds basket of Financial stocks (e.g, Bank of America, Goldman Sachs) is up by 13.0735% and is currently underperforming the overall market by -0.7866% year-to-date. Below is a quick view of Technical charts and trends: |
|
 XLF Weekly Chart |
|
| Long Term Trend: Good | |
| Medium Term Trend: Good | |
 XLF Daily Chart |
|
| Short Term Trend: Very Good | |
| Overall Trend Score: 90 | |
| YTD Performance: 13.0735% | |
| **Trend Scores & Views Are Only For Educational Purposes And Not For Investing | |
| 12Stocks.com: Top Performing Financial Sector Stocks | |||||||||||||||||||||||||||||||||||||||||||||||
 The top performing Financial sector stocks year to date are
Now, more recently, over last week, the top performing Financial sector stocks on the move are


|
|||||||||||||||||||||||||||||||||||||||||||||||
| 12Stocks.com: Investing in Financial Sector using Exchange Traded Funds | |
|
The following table shows list of key exchange traded funds (ETF) that
help investors track Financial Index. For detailed view, check out our ETF Funds section of our website. Quick View: Move mouse or cursor over ETF symbol (ticker) to view short-term Technical chart and over ETF name to view long term chart. Click on ticker or stock name for detailed view. Click on to add stock symbol to your watchlist and to view watchlist. |
12Stocks.com List of ETFs that track Financial Index
| Ticker | ETF Name | Watchlist | Recent Price | Smart Investing & Trading Score | Change % | Week % | Year-to-date % |
| CHIX | China Financials | | 10.57 | 20 | 0 | 0 | 0% |
| 12Stocks.com: Charts, Trends, Fundamental Data and Performances of Financial Stocks | |
|
We now take in-depth look at all Financial stocks including charts, multi-period performances and overall trends (as measured by Smart Investing & Trading Score). One can sort Financial stocks (click link to choose) by Daily, Weekly and by Year-to-Date performances. Also, one can sort by size of the company or by market capitalization. |
| Select Your Default Chart Type: | |||||
| |||||
| Click on stock symbol or name for detailed view. Click on to add stock symbol to your watchlist and to view watchlist. Quick View: Move mouse or cursor over "Daily" to quickly view daily Technical stock chart and over "Weekly" to view weekly Technical stock chart. | |||||

 | SONA Southern National Bancorp of Virginia, Inc. |
| Sector: Financials | |
| SubSector: Regional - Mid-Atlantic Banks | |
| MarketCap: 230.459 Millions | |
| Recent Price: 21.22 Smart Investing & Trading Score: 80 | |
| Day Percent Change: -1.62262% Day Change: -9999 | |
| Week Change: 40.6229% Year-to-date Change: 0.0% | |
| SONA Links: Profile News Message Board | |
| Charts:- Daily , Weekly | |
| Add SONA to Watchlist: View: Get Complete SONA Trend Analysis ➞ | |
 | PFBI Premier Financial Bancorp, Inc. |
| Sector: Financials | |
| SubSector: Regional - Southeast Banks | |
| MarketCap: 154.035 Millions | |
| Recent Price: 10.30 Smart Investing & Trading Score: 30 | |
| Day Percent Change: 1.07949% Day Change: -9999 | |
| Week Change: -42.1023% Year-to-date Change: 0.0% | |
| PFBI Links: Profile News Message Board | |
| Charts:- Daily , Weekly | |
| Add PFBI to Watchlist: View: Get Complete PFBI Trend Analysis ➞ | |
 | ABDC Alcentra Capital Corporation |
| Sector: Financials | |
| SubSector: Asset Management | |
| MarketCap: 179.56 Millions | |
| Recent Price: 2.64 Smart Investing & Trading Score: 20 | |
| Day Percent Change: -4% Day Change: -9999 | |
| Week Change: -57.76% Year-to-date Change: 0.0% | |
| ABDC Links: Profile News Message Board | |
| Charts:- Daily , Weekly | |
| Add ABDC to Watchlist: View: Get Complete ABDC Trend Analysis ➞ | |
 | ESXB Community Bankers Trust Corporation |
| Sector: Financials | |
| SubSector: Diversified Investments | |
| MarketCap: 115.67 Millions | |
| Recent Price: 18.22 Smart Investing & Trading Score: 100 | |
| Day Percent Change: 1.27849% Day Change: -9999 | |
| Week Change: 54.8003% Year-to-date Change: 0.0% | |
| ESXB Links: Profile News Message Board | |
| Charts:- Daily , Weekly | |
| Add ESXB to Watchlist: View: Get Complete ESXB Trend Analysis ➞ | |
 | HBMD Howard Bancorp, Inc. |
| Sector: Financials | |
| SubSector: Regional - Mid-Atlantic Banks | |
| MarketCap: 209.959 Millions | |
| Recent Price: 44.34 Smart Investing & Trading Score: 100 | |
| Day Percent Change: 0.0225581% Day Change: -9999 | |
| Week Change: 90.3004% Year-to-date Change: 0.0% | |
| HBMD Links: Profile News Message Board | |
| Charts:- Daily , Weekly | |
| Add HBMD to Watchlist: View: Get Complete HBMD Trend Analysis ➞ | |
 | ORM Owens Realty Mortgage, Inc. |
| Sector: Financials | |
| SubSector: REIT - Office | |
| MarketCap: 170.97 Millions | |
| Recent Price: 44.34 Smart Investing & Trading Score: 100 | |
| Day Percent Change: 0.0225581% Day Change: -9999 | |
| Week Change: 162.057% Year-to-date Change: 0.0% | |
| ORM Links: Profile News Message Board | |
| Charts:- Daily , Weekly | |
| Add ORM to Watchlist: View: Get Complete ORM Trend Analysis ➞ | |
 | CUBN Commerce Union Bancshares, Inc. |
| Sector: Financials | |
| SubSector: Regional - Southeast Banks | |
| MarketCap: 169.21 Millions | |
| Recent Price: 5.04 Smart Investing & Trading Score: 20 | |
| Day Percent Change: 1.40845% Day Change: -9999 | |
| Week Change: 0.8% Year-to-date Change: 0.0% | |
| CUBN Links: Profile News Message Board | |
| Charts:- Daily , Weekly | |
| Add CUBN to Watchlist: View: Get Complete CUBN Trend Analysis ➞ | |
 | PMBC Pacific Mercantile Bancorp |
| Sector: Financials | |
| SubSector: Regional - Pacific Banks | |
| MarketCap: 103.329 Millions | |
| Recent Price: 4.69 Smart Investing & Trading Score: 30 | |
| Day Percent Change: 0.213675% Day Change: -9999 | |
| Week Change: -50.1064% Year-to-date Change: 0.0% | |
| PMBC Links: Profile News Message Board | |
| Charts:- Daily , Weekly | |
| Add PMBC to Watchlist: View: Get Complete PMBC Trend Analysis ➞ | |
 | LAQ Aberdeen Latin America Equity Fund, Inc. |
| Sector: Financials | |
| SubSector: Asset Management | |
| MarketCap: 167.89 Millions | |
| Recent Price: 4.69 Smart Investing & Trading Score: 40 | |
| Day Percent Change: 0.213675% Day Change: -9999 | |
| Week Change: -45.5285% Year-to-date Change: 0.0% | |
| LAQ Links: Profile News Message Board | |
| Charts:- Daily , Weekly | |
| Add LAQ to Watchlist: View: Get Complete LAQ Trend Analysis ➞ | |
 | VMM Delaware Investments Minnesota Municipal Income Fund II, Inc. |
| Sector: Financials | |
| SubSector: Asset Management | |
| MarketCap: 133.403 Millions | |
| Recent Price: 10.21 Smart Investing & Trading Score: 20 | |
| Day Percent Change: -6.92799% Day Change: -9999 | |
| Week Change: -24.0022% Year-to-date Change: 0.0% | |
| VMM Links: Profile News Message Board | |
| Charts:- Daily , Weekly | |
| Add VMM to Watchlist: View: Get Complete VMM Trend Analysis ➞ | |
 | MSL MidSouth Bancorp, Inc. |
| Sector: Financials | |
| SubSector: Regional - Southeast Banks | |
| MarketCap: 161.38 Millions | |
| Recent Price: 44.30 Smart Investing & Trading Score: 70 | |
| Day Percent Change: 0.158264% Day Change: -9999 | |
| Week Change: 118.334% Year-to-date Change: 0.0% | |
| MSL Links: Profile News Message Board | |
| Charts:- Daily , Weekly | |
| Add MSL to Watchlist: View: Get Complete MSL Trend Analysis ➞ | |
 | TCFC The Community Financial Corporation |
| Sector: Financials | |
| SubSector: Regional - Mid-Atlantic Banks | |
| MarketCap: 135.559 Millions | |
| Recent Price: 46.14 Smart Investing & Trading Score: 70 | |
| Day Percent Change: -0.173085% Day Change: -9999 | |
| Week Change: 70.3212% Year-to-date Change: 0.0% | |
| TCFC Links: Profile News Message Board | |
| Charts:- Daily , Weekly | |
| Add TCFC to Watchlist: View: Get Complete TCFC Trend Analysis ➞ | |
 | PBIP Prudential Bancorp, Inc. |
| Sector: Financials | |
| SubSector: Savings & Loans | |
| MarketCap: 133.03 Millions | |
| Recent Price: 57.10 Smart Investing & Trading Score: 70 | |
| Day Percent Change: -2.34308% Day Change: -9999 | |
| Week Change: 277.396% Year-to-date Change: 0.0% | |
| PBIP Links: Profile News Message Board | |
| Charts:- Daily , Weekly | |
| Add PBIP to Watchlist: View: Get Complete PBIP Trend Analysis ➞ | |
 | SBCP Sunshine Bancorp, Inc. |
| Sector: Financials | |
| SubSector: Regional - Mid-Atlantic Banks | |
| MarketCap: 154.09 Millions | |
| Recent Price: 0.17 Smart Investing & Trading Score: 10 | |
| Day Percent Change: 0% Day Change: -9999 | |
| Week Change: -93.3594% Year-to-date Change: 0.0% | |
| SBCP Links: Profile News Message Board | |
| Charts:- Daily , Weekly | |
| Add SBCP to Watchlist: View: Get Complete SBCP Trend Analysis ➞ | |
 | GRIF Griffin Industrial Realty, Inc. |
| Sector: Financials | |
| SubSector: Property Management | |
| MarketCap: 202.042 Millions | |
| Recent Price: 19.00 Smart Investing & Trading Score: 50 | |
| Day Percent Change: 0.582319% Day Change: -9999 | |
| Week Change: 705.085% Year-to-date Change: 0.0% | |
| GRIF Links: Profile News Message Board | |
| Charts:- Daily , Weekly | |
| Add GRIF to Watchlist: View: Get Complete GRIF Trend Analysis ➞ | |
 | ENFC Entegra Financial Corp. |
| Sector: Financials | |
| SubSector: Regional - Southeast Banks | |
| MarketCap: 148.81 Millions | |
| Recent Price: 8.85 Smart Investing & Trading Score: 40 | |
| Day Percent Change: 1.14286% Day Change: -9999 | |
| Week Change: -71.4792% Year-to-date Change: 0.0% | |
| ENFC Links: Profile News Message Board | |
| Charts:- Daily , Weekly | |
| Add ENFC to Watchlist: View: Get Complete ENFC Trend Analysis ➞ | |
 | TRCB Two River Bancorp |
| Sector: Financials | |
| SubSector: Regional - Northeast Banks | |
| MarketCap: 148.09 Millions | |
| Recent Price: 14.23 Smart Investing & Trading Score: 40 | |
| Day Percent Change: 0.49435% Day Change: -9999 | |
| Week Change: -19.6045% Year-to-date Change: 0.0% | |
| TRCB Links: Profile News Message Board | |
| Charts:- Daily , Weekly | |
| Add TRCB to Watchlist: View: Get Complete TRCB Trend Analysis ➞ | |
 | KCAP KCAP Financial, Inc. |
| Sector: Financials | |
| SubSector: Diversified Investments | |
| MarketCap: 146.11 Millions | |
| Recent Price: 21.47 Smart Investing & Trading Score: 60 | |
| Day Percent Change: -0.139535% Day Change: -9999 | |
| Week Change: 5.60748% Year-to-date Change: 0.0% | |
| KCAP Links: Profile News Message Board | |
| Charts:- Daily , Weekly | |
| Add KCAP to Watchlist: View: Get Complete KCAP Trend Analysis ➞ | |
 | FCCY 1st Constitution Bancorp |
| Sector: Financials | |
| SubSector: Regional - Northeast Banks | |
| MarketCap: 144.399 Millions | |
| Recent Price: 20.66 Smart Investing & Trading Score: 0 | |
| Day Percent Change: 0.53528% Day Change: -9999 | |
| Week Change: -25.6567% Year-to-date Change: 0.0% | |
| FCCY Links: Profile News Message Board | |
| Charts:- Daily , Weekly | |
| Add FCCY to Watchlist: View: Get Complete FCCY Trend Analysis ➞ | |
 | EVBS Eastern Virginia Bankshares, Inc. |
| Sector: Financials | |
| SubSector: Regional - Southeast Banks | |
| MarketCap: 141.64 Millions | |
| Recent Price: 3.52 Smart Investing & Trading Score: 10 | |
| Day Percent Change: -0.564972% Day Change: -9999 | |
| Week Change: -64.7295% Year-to-date Change: 0.0% | |
| EVBS Links: Profile News Message Board | |
| Charts:- Daily , Weekly | |
| Add EVBS to Watchlist: View: Get Complete EVBS Trend Analysis ➞ | |
 | CMFN CM Finance Inc. |
| Sector: Financials | |
| SubSector: Asset Management | |
| MarketCap: 140.99 Millions | |
| Recent Price: 20.42 Smart Investing & Trading Score: 60 | |
| Day Percent Change: 0.789733% Day Change: -9999 | |
| Week Change: 0.442696% Year-to-date Change: 0.0% | |
| CMFN Links: Profile News Message Board | |
| Charts:- Daily , Weekly | |
| Add CMFN to Watchlist: View: Get Complete CMFN Trend Analysis ➞ | |
 | DNBF DNB Financial Corporation |
| Sector: Financials | |
| SubSector: Regional - Mid-Atlantic Banks | |
| MarketCap: 140.17 Millions | |
| Recent Price: 20.05 Smart Investing & Trading Score: 90 | |
| Day Percent Change: 5.80475% Day Change: -9999 | |
| Week Change: 44.7653% Year-to-date Change: 0.0% | |
| DNBF Links: Profile News Message Board | |
| Charts:- Daily , Weekly | |
| Add DNBF to Watchlist: View: Get Complete DNBF Trend Analysis ➞ | |
 | MLVF Malvern Bancorp, Inc. |
| Sector: Financials | |
| SubSector: Savings & Loans | |
| MarketCap: 132.03 Millions | |
| Recent Price: 93.11 Smart Investing & Trading Score: 80 | |
| Day Percent Change: 0.997939% Day Change: -9999 | |
| Week Change: 448.674% Year-to-date Change: 0.0% | |
| MLVF Links: Profile News Message Board | |
| Charts:- Daily , Weekly | |
| Add MLVF to Watchlist: View: Get Complete MLVF Trend Analysis ➞ | |
 | BOCH Bank of Commerce Holdings |
| Sector: Financials | |
| SubSector: Regional - Mid-Atlantic Banks | |
| MarketCap: 122.959 Millions | |
| Recent Price: 93.11 Smart Investing & Trading Score: 80 | |
| Day Percent Change: 0.997939% Day Change: -9999 | |
| Week Change: 513.777% Year-to-date Change: 0.0% | |
| BOCH Links: Profile News Message Board | |
| Charts:- Daily , Weekly | |
| Add BOCH to Watchlist: View: Get Complete BOCH Trend Analysis ➞ | |
 | NKG Nuveen Georgia Quality Municipal Income Fund |
| Sector: Financials | |
| SubSector: Asset Management | |
| MarketCap: 111.503 Millions | |
| Recent Price: 5.75 Smart Investing & Trading Score: 70 | |
| Day Percent Change: 0.34904% Day Change: -9999 | |
| Week Change: 1355.7% Year-to-date Change: 0.0% | |
| NKG Links: Profile News Message Board | |
| Charts:- Daily , Weekly | |
| Add NKG to Watchlist: View: Get Complete NKG Trend Analysis ➞ | |
| For tabular summary view of above stock list: Summary View ➞ 0 - 25 , 25 - 50 , 50 - 75 , 75 - 100 , 100 - 125 , 125 - 150 , 150 - 175 , 175 - 200 , 200 - 225 , 225 - 250 , 250 - 275 , 275 - 300 , 300 - 325 , 325 - 350 , 350 - 375 , 375 - 400 , 400 - 425 , 425 - 450 , 450 - 475 , 475 - 500 , 500 - 525 , 525 - 550 , 550 - 575 , 575 - 600 , 600 - 625 , 625 - 650 , 650 - 675 , 675 - 700 , 700 - 725 , 725 - 750 , 750 - 775 , 775 - 800 , 800 - 825 , 825 - 850 , 850 - 875 , 875 - 900 , 900 - 925 , 925 - 950 , 950 - 975 , 975 - 1000 , 1000 - 1025 , 1025 - 1050 , 1050 - 1075 , 1075 - 1100 , 1100 - 1125 , 1125 - 1150 , 1150 - 1175 , 1175 - 1200 , 1200 - 1225 , 1225 - 1250 , 1250 - 1275 , 1275 - 1300 , 1300 - 1325 , 1325 - 1350 , 1350 - 1375 , 1375 - 1400 , 1400 - 1425 , 1425 - 1450 , 1450 - 1475 , 1475 - 1500 , 1500 - 1525 , 1525 - 1550 | ||
| Click To Change The Sort Order: By Market Cap or Company Size Performance: Year-to-date, Week and Day | |
| Select Chart Type: | ||
|
Best Stocks Today 12Stocks.com |
© 2025 12Stocks.com Terms & Conditions Privacy Contact Us
All Information Provided Only For Education And Not To Be Used For Investing or Trading. See Terms & Conditions


One More Thing ... Get Best Stocks Delivered Daily!
Never Ever Miss A Move With Our Top Ten Stocks Lists
Find Best Stocks In Any Market - Bull or Bear Market
Take A Peek At Our Top Ten Stocks Lists: Daily, Weekly, Year-to-Date & Top Trends
Find Best Stocks In Any Market - Bull or Bear Market
Take A Peek At Our Top Ten Stocks Lists: Daily, Weekly, Year-to-Date & Top Trends
Financial Stocks With Best Up Trends [0-bearish to 100-bullish]: Better Home[100], AMREP Corp[100], PIMCO California[100], Torchmark [100], PIMCO California[100], Triumph Bancorp[100], StepStone [100], Radian [100], National Bank[100], PIMCO Municipal[100], MARA [100]
Best Financial Stocks Year-to-Date:
Insight Select[12384.6%], Oxford Lane[292.479%], Better Home[250.328%], Metalpha Technology[213.274%], Robinhood Markets[206.567%], Cipher Mining[145.528%], Mr. Cooper[133.957%], Banco Santander[130.037%], IHS Holding[117.61%], Deutsche Bank[114.776%], LoanDepot [110.733%] Best Financial Stocks This Week:
Colony Starwood[15929900%], Blackhawk Network[91300%], Macquarie Global[81662.9%], Credit Suisse[63241.6%], Pennsylvania Real[23823%], First Republic[22570.9%], Select ome[14000%], CorEnergy Infrastructure[6797.78%], FedNat Holding[5525%], BlackRock Municipal[5340%], BlackRock MuniYield[3379.04%] Best Financial Stocks Daily:
Better Home[13.3451%], AMREP Corp[11.992%], PIMCO California[11.9545%], Torchmark [11.8363%], Forge Global[11.5409%], PIMCO California[11.4754%], BlackRock Muni[10.8108%], Blackrock MuniYield[10.72%], Triumph Bancorp[10.2661%], StepStone [8.74771%], BlackRock MuniYield[8.15348%]