
 Login Sign Up


| |||||
 |  | ||||

| 12Stocks.com Market Intelligence |
Best Financial Stocks
| In a hurry? Financial Stocks Lists: Performance Trends Table, Stock Charts
Sort Financial stocks: Daily, Weekly, Year-to-Date, Market Cap & Trends. Filter Financial stocks list by size:All Financial Large Mid-Range Small & MicroCap |
| 12Stocks.com Financial Stocks Performances & Trends Daily | |||||||||
|
|  The overall Smart Investing & Trading Score is 90 (0-bearish to 100-bullish) which puts Financial sector in short term bullish trend. The Smart Investing & Trading Score from previous trading session is 60 and an improvement of trend continues.
| ||||||||
Here are the Smart Investing & Trading Scores of the most requested Financial stocks at 12Stocks.com (click stock name for detailed review):
|


| 12Stocks.com: Investing in Financial sector with Stocks | |
|
The following table helps investors and traders sort through current performance and trends (as measured by Smart Investing & Trading Score) of various
stocks in the Financial sector. Quick View: Move mouse or cursor over stock symbol (ticker) to view short-term Technical chart and over stock name to view long term chart. Click on  to add stock symbol to your watchlist and to add stock symbol to your watchlist and  to view watchlist. Click on any ticker or stock name for detailed market intelligence report for that stock. to view watchlist. Click on any ticker or stock name for detailed market intelligence report for that stock. |
12Stocks.com Performance of Stocks in Financial Sector
| Ticker | Stock Name | Watchlist | Category | Recent Price | Trend Score | Change % | YTD Change% |
| AJX | Great Ajax |   | Mortgage | 3.00 | 40 | -0.66% | 0.00% |
| NMT | Nuveen Massachusetts | | Closed-End Fund - Debt | 11.55 | 40 | -0.77% | 4.90% |
| SPG | Simon Property | | REIT - Retail | 180.09 | 40 | -0.81% | 6.45% |
| NLY | Annaly Capital | | REIT - Mortgage | 21.70 | 40 | -0.91% | 26.78% |
| PPT | Putnam Premier | | Closed-End Fund - Debt | 3.71 | 40 | -1.07% | 9.00% |
| AGNC | AGNC | | REIT - Mortgage | 10.10 | 40 | -1.08% | 18.90% |
| ABR | Arbor Realty | | REIT - Mortgage | 11.65 | 40 | -1.10% | -9.90% |
| ORC | Orchid Island | | REIT - Mortgage | 7.08 | 40 | -1.12% | 0.68% |
| SHG | Shinhan | | Banks - Regional | 49.27 | 40 | -1.48% | 54.10% |
| IBN | ICICI Bank | | Banks - Regional | 32.06 | 40 | -1.66% | 8.40% |
| LX | LexinFintech | | Credit Services | 5.74 | 40 | -2.05% | 1.05% |
| MA | Mastercard | | Credit Services | 586.05 | 40 | -2.10% | 12.68% |
| WMIH | WMIH | | Insurance | 18.06 | 40 | -2.48% | 0.00% |
| MSBIP | Midland States | | Banks - Regional | 24.10 | 38 | -0.25% | -1.59% |
| BHFAM | Brighthouse | | Insurance - Life | 12.02 | 38 | -0.30% | -13.47% |
| HBANL | Huntington Bancshares | | Banks - Regional | 25.99 | 38 | -0.62% | 5.16% |
| OZKAP | Bank OZK | | Banks - Regional | 17.49 | 38 | -0.83% | 14.29% |
| AACT | Ares Acquisition | | Shell Companies | 11.40 | 36 | 0.09% | 3.83% |
| ALCYU | Alchemy s | | SPAC | 10.96 | 36 | 0.00% | -100.00% |
| IRRX | Integrated Rail | | SPAC | 17.00 | 36 | 0.00% | -100.00% |
| SVIIU | Spring Valley | | SPAC | 12.89 | 36 | 0.00% | -100.00% |
| MBINM | Merchants Bancorp | | Banks - Regional | 24.90 | 36 | -0.67% | 1.93% |
| JXN | Jackson | | Insurance - Life | 99.58 | 36 | -0.88% | 11.76% |
| SMMF | Summit | | Regional Banks | 7.05 | 30 | 7.80% | 0.00% |
| BMTC | Bryn Mawr | | Regional Banks | 20.01 | 30 | 5.09% | 0.00% |
| For chart view version of above stock list: Chart View ➞ 0 - 25 , 25 - 50 , 50 - 75 , 75 - 100 , 100 - 125 , 125 - 150 , 150 - 175 , 175 - 200 , 200 - 225 , 225 - 250 , 250 - 275 , 275 - 300 , 300 - 325 , 325 - 350 , 350 - 375 , 375 - 400 , 400 - 425 , 425 - 450 , 450 - 475 , 475 - 500 , 500 - 525 , 525 - 550 , 550 - 575 , 575 - 600 , 600 - 625 , 625 - 650 , 650 - 675 , 675 - 700 , 700 - 725 , 725 - 750 , 750 - 775 , 775 - 800 , 800 - 825 , 825 - 850 , 850 - 875 , 875 - 900 , 900 - 925 , 925 - 950 , 950 - 975 , 975 - 1000 , 1000 - 1025 , 1025 - 1050 , 1050 - 1075 , 1075 - 1100 , 1100 - 1125 , 1125 - 1150 , 1150 - 1175 , 1175 - 1200 , 1200 - 1225 , 1225 - 1250 , 1250 - 1275 , 1275 - 1300 , 1300 - 1325 , 1325 - 1350 , 1350 - 1375 , 1375 - 1400 , 1400 - 1425 , 1425 - 1450 , 1450 - 1475 , 1475 - 1500 , 1500 - 1525 , 1525 - 1550 | ||
 | Click To Change The Sort Order: By Market Cap or Company Size Performance: Year-to-date, Week and Day |  |
|
Get the most comprehensive stock market coverage daily at 12Stocks.com ➞ Best Stocks Today ➞ Best Stocks Weekly ➞ Best Stocks Year-to-Date ➞ Best Stocks Trends ➞  Best Stocks Today 12Stocks.com Best Nasdaq Stocks ➞ Best S&P 500 Stocks ➞ Best Tech Stocks ➞ Best Biotech Stocks ➞ |
| Detailed Overview of Financial Stocks |
| Financial Technical Overview, Leaders & Laggards, Top Financial ETF Funds & Detailed Financial Stocks List, Charts, Trends & More |
| Financial Sector: Technical Analysis, Trends & YTD Performance | |
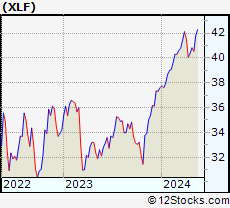
| Financial sector is composed of stocks
from banks, brokers, insurance, REITs
and services subsectors. Financial sector, as represented by XLF, an exchange-traded fund [ETF] that holds basket of Financial stocks (e.g, Bank of America, Goldman Sachs) is up by 13.0735% and is currently underperforming the overall market by -0.7866% year-to-date. Below is a quick view of Technical charts and trends: |
|
 XLF Weekly Chart |
|
| Long Term Trend: Good | |
| Medium Term Trend: Good | |
 XLF Daily Chart |
|
| Short Term Trend: Very Good | |
| Overall Trend Score: 90 | |
| YTD Performance: 13.0735% | |
| **Trend Scores & Views Are Only For Educational Purposes And Not For Investing | |
| 12Stocks.com: Top Performing Financial Sector Stocks | |||||||||||||||||||||||||||||||||||||||||||||||
 The top performing Financial sector stocks year to date are
Now, more recently, over last week, the top performing Financial sector stocks on the move are


|
|||||||||||||||||||||||||||||||||||||||||||||||
| 12Stocks.com: Investing in Financial Sector using Exchange Traded Funds | |
|
The following table shows list of key exchange traded funds (ETF) that
help investors track Financial Index. For detailed view, check out our ETF Funds section of our website. Quick View: Move mouse or cursor over ETF symbol (ticker) to view short-term Technical chart and over ETF name to view long term chart. Click on ticker or stock name for detailed view. Click on to add stock symbol to your watchlist and to view watchlist. |
12Stocks.com List of ETFs that track Financial Index
| Ticker | ETF Name | Watchlist | Recent Price | Smart Investing & Trading Score | Change % | Week % | Year-to-date % |
| CHIX | China Financials | | 10.57 | 20 | 0 | 0 | 0% |
| 12Stocks.com: Charts, Trends, Fundamental Data and Performances of Financial Stocks | |
|
We now take in-depth look at all Financial stocks including charts, multi-period performances and overall trends (as measured by Smart Investing & Trading Score). One can sort Financial stocks (click link to choose) by Daily, Weekly and by Year-to-Date performances. Also, one can sort by size of the company or by market capitalization. |
| Select Your Default Chart Type: | |||||
| |||||
| Click on stock symbol or name for detailed view. Click on to add stock symbol to your watchlist and to view watchlist. Quick View: Move mouse or cursor over "Daily" to quickly view daily Technical stock chart and over "Weekly" to view weekly Technical stock chart. | |||||

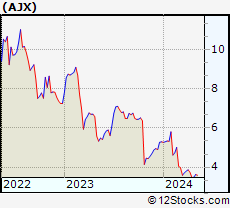 | AJX Great Ajax Corp. |
| Sector: Financials | |
| SubSector: Mortgage Investment | |
| MarketCap: 154.539 Millions | |
| Recent Price: 3.00 Smart Investing & Trading Score: 40 | |
| Day Percent Change: -0.662252% Day Change: -9999 | |
| Week Change: 0.334448% Year-to-date Change: 0.0% | |
| AJX Links: Profile News Message Board | |
| Charts:- Daily , Weekly | |
| Add AJX to Watchlist: View: Get Complete AJX Trend Analysis ➞ | |
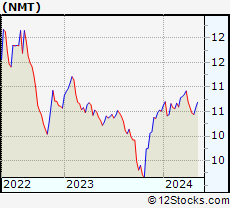 | NMT Nuveen Massachusetts Quality Municipal Income Fund |
| Sector: Financials | |
| SubSector: Closed-End Fund - Debt | |
| MarketCap: 107.51 Millions | |
| Recent Price: 11.55 Smart Investing & Trading Score: 40 | |
| Day Percent Change: -0.773196% Day Change: -0.11 | |
| Week Change: 0% Year-to-date Change: 4.9% | |
| NMT Links: Profile News Message Board | |
| Charts:- Daily , Weekly | |
| Add NMT to Watchlist: View: Get Complete NMT Trend Analysis ➞ | |
 | SPG Simon Property Group, Inc |
| Sector: Financials | |
| SubSector: REIT - Retail | |
| MarketCap: 68746 Millions | |
| Recent Price: 180.09 Smart Investing & Trading Score: 40 | |
| Day Percent Change: -0.80965% Day Change: -1.77 | |
| Week Change: 0.47983% Year-to-date Change: 6.4% | |
| SPG Links: Profile News Message Board | |
| Charts:- Daily , Weekly | |
| Add SPG to Watchlist: View: Get Complete SPG Trend Analysis ➞ | |
 | NLY Annaly Capital Management Inc |
| Sector: Financials | |
| SubSector: REIT - Mortgage | |
| MarketCap: 14183.5 Millions | |
| Recent Price: 21.70 Smart Investing & Trading Score: 40 | |
| Day Percent Change: -0.913242% Day Change: -0.12 | |
| Week Change: -1.80995% Year-to-date Change: 26.8% | |
| NLY Links: Profile News Message Board | |
| Charts:- Daily , Weekly | |
| Add NLY to Watchlist: View: Get Complete NLY Trend Analysis ➞ | |
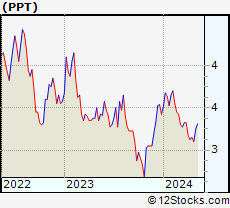 | PPT Putnam Premier Income Trust |
| Sector: Financials | |
| SubSector: Closed-End Fund - Debt | |
| MarketCap: 353.6 Millions | |
| Recent Price: 3.71 Smart Investing & Trading Score: 40 | |
| Day Percent Change: -1.06667% Day Change: 0 | |
| Week Change: 0.27027% Year-to-date Change: 9.0% | |
| PPT Links: Profile News Message Board | |
| Charts:- Daily , Weekly | |
| Add PPT to Watchlist: View: Get Complete PPT Trend Analysis ➞ | |
 | AGNC AGNC Investment Corp |
| Sector: Financials | |
| SubSector: REIT - Mortgage | |
| MarketCap: 10802.8 Millions | |
| Recent Price: 10.10 Smart Investing & Trading Score: 40 | |
| Day Percent Change: -1.07738% Day Change: -0.08 | |
| Week Change: -1.46341% Year-to-date Change: 18.9% | |
| AGNC Links: Profile News Message Board | |
| Charts:- Daily , Weekly | |
| Add AGNC to Watchlist: View: Get Complete AGNC Trend Analysis ➞ | |
 | ABR Arbor Realty Trust Inc |
| Sector: Financials | |
| SubSector: REIT - Mortgage | |
| MarketCap: 2340.31 Millions | |
| Recent Price: 11.65 Smart Investing & Trading Score: 40 | |
| Day Percent Change: -1.10357% Day Change: -0.25 | |
| Week Change: -0.76661% Year-to-date Change: -9.9% | |
| ABR Links: Profile News Message Board | |
| Charts:- Daily , Weekly | |
| Add ABR to Watchlist: View: Get Complete ABR Trend Analysis ➞ | |
 | ORC Orchid Island Capital Inc |
| Sector: Financials | |
| SubSector: REIT - Mortgage | |
| MarketCap: 1159.37 Millions | |
| Recent Price: 7.08 Smart Investing & Trading Score: 40 | |
| Day Percent Change: -1.11732% Day Change: -0.05 | |
| Week Change: -0.840336% Year-to-date Change: 0.7% | |
| ORC Links: Profile News Message Board | |
| Charts:- Daily , Weekly | |
| Add ORC to Watchlist: View: Get Complete ORC Trend Analysis ➞ | |
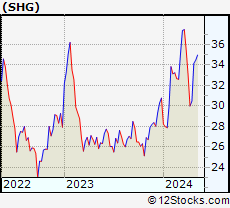 | SHG Shinhan Financial Group Co. Ltd. ADR |
| Sector: Financials | |
| SubSector: Banks - Regional | |
| MarketCap: 22185.6 Millions | |
| Recent Price: 49.27 Smart Investing & Trading Score: 40 | |
| Day Percent Change: -1.4797% Day Change: -0.07 | |
| Week Change: 0.818498% Year-to-date Change: 54.1% | |
| SHG Links: Profile News Message Board | |
| Charts:- Daily , Weekly | |
| Add SHG to Watchlist: View: Get Complete SHG Trend Analysis ➞ | |
 | IBN ICICI Bank Ltd. ADR |
| Sector: Financials | |
| SubSector: Banks - Regional | |
| MarketCap: 113060 Millions | |
| Recent Price: 32.06 Smart Investing & Trading Score: 40 | |
| Day Percent Change: -1.65644% Day Change: 0.14 | |
| Week Change: 1.29542% Year-to-date Change: 8.4% | |
| IBN Links: Profile News Message Board | |
| Charts:- Daily , Weekly | |
| Add IBN to Watchlist: View: Get Complete IBN Trend Analysis ➞ | |
 | LX LexinFintech Holdings Ltd ADR |
| Sector: Financials | |
| SubSector: Credit Services | |
| MarketCap: 807.47 Millions | |
| Recent Price: 5.74 Smart Investing & Trading Score: 40 | |
| Day Percent Change: -2.04778% Day Change: 0.17 | |
| Week Change: -0.692042% Year-to-date Change: 1.0% | |
| LX Links: Profile News Message Board | |
| Charts:- Daily , Weekly | |
| Add LX to Watchlist: View: Get Complete LX Trend Analysis ➞ | |
 | MA Mastercard Incorporated |
| Sector: Financials | |
| SubSector: Credit Services | |
| MarketCap: 528142 Millions | |
| Recent Price: 586.05 Smart Investing & Trading Score: 40 | |
| Day Percent Change: -2.10146% Day Change: -11.23 | |
| Week Change: 1.15123% Year-to-date Change: 12.7% | |
| MA Links: Profile News Message Board | |
| Charts:- Daily , Weekly | |
| Add MA to Watchlist: View: Get Complete MA Trend Analysis ➞ | |
 | WMIH WMIH Corp. |
| Sector: Financials | |
| SubSector: Property & Casualty Insurance | |
| MarketCap: 275.56 Millions | |
| Recent Price: 18.06 Smart Investing & Trading Score: 40 | |
| Day Percent Change: -2.4838% Day Change: -9999 | |
| Week Change: 191.761% Year-to-date Change: 0.0% | |
| WMIH Links: Profile News Message Board | |
| Charts:- Daily , Weekly | |
| Add WMIH to Watchlist: View: Get Complete WMIH Trend Analysis ➞ | |
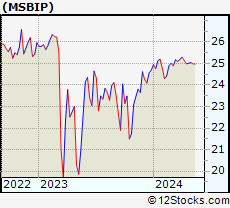 | MSBIP Midland States Bancorp, Inc. |
| Sector: Financials | |
| SubSector: Banks - Regional | |
| MarketCap: 439 Millions | |
| Recent Price: 24.10 Smart Investing & Trading Score: 38 | |
| Day Percent Change: -0.25% Day Change: -0.06 | |
| Week Change: -2.07% Year-to-date Change: -1.6% | |
| MSBIP Links: Profile News Message Board | |
| Charts:- Daily , Weekly | |
| Add MSBIP to Watchlist: View: Get Complete MSBIP Trend Analysis ➞ | |
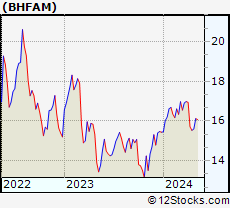 | BHFAM Brighthouse Financial, Inc. |
| Sector: Financials | |
| SubSector: Insurance - Life | |
| MarketCap: 3170 Millions | |
| Recent Price: 12.02 Smart Investing & Trading Score: 38 | |
| Day Percent Change: -0.3% Day Change: -0.04 | |
| Week Change: 4.03% Year-to-date Change: -13.5% | |
| BHFAM Links: Profile News Message Board | |
| Charts:- Daily , Weekly | |
| Add BHFAM to Watchlist: View: Get Complete BHFAM Trend Analysis ➞ | |
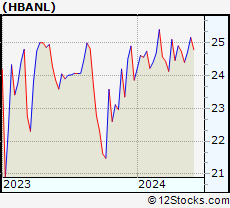 | HBANL Huntington Bancshares Incorporated |
| Sector: Financials | |
| SubSector: Banks - Regional | |
| MarketCap: 15560 Millions | |
| Recent Price: 25.99 Smart Investing & Trading Score: 38 | |
| Day Percent Change: -0.62% Day Change: -0.16 | |
| Week Change: 0.98% Year-to-date Change: 5.2% | |
| HBANL Links: Profile News Message Board | |
| Charts:- Daily , Weekly | |
| Add HBANL to Watchlist: View: Get Complete HBANL Trend Analysis ➞ | |
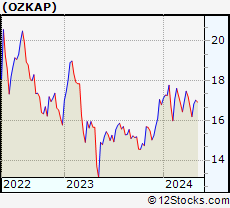 | OZKAP Bank OZK |
| Sector: Financials | |
| SubSector: Banks - Regional | |
| MarketCap: 5170 Millions | |
| Recent Price: 17.49 Smart Investing & Trading Score: 38 | |
| Day Percent Change: -0.83% Day Change: -0.14 | |
| Week Change: -0.57% Year-to-date Change: 14.3% | |
| OZKAP Links: Profile News Message Board | |
| Charts:- Daily , Weekly | |
| Add OZKAP to Watchlist: View: Get Complete OZKAP Trend Analysis ➞ | |
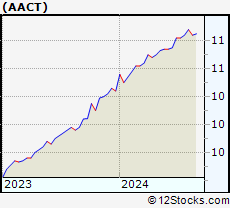 | AACT Ares Acquisition Corporation II |
| Sector: Financials | |
| SubSector: Shell Companies | |
| MarketCap: 706.44 Millions | |
| Recent Price: 11.40 Smart Investing & Trading Score: 36 | |
| Day Percent Change: 0.09% Day Change: 0.01 | |
| Week Change: 0.09% Year-to-date Change: 3.8% | |
| AACT Links: Profile News Message Board | |
| Charts:- Daily , Weekly | |
| Add AACT to Watchlist: View: Get Complete AACT Trend Analysis ➞ | |
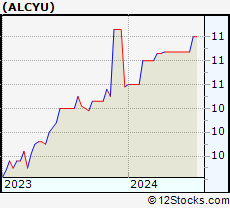 | ALCYU Alchemy Investments Acquisition Corp 1 |
| Sector: Financials | |
| SubSector: SPAC | |
| MarketCap: 147 Millions | |
| Recent Price: 10.96 Smart Investing & Trading Score: 36 | |
| Day Percent Change: 0% Day Change: -9999 | |
| Week Change: -100% Year-to-date Change: -100.0% | |
| ALCYU Links: Profile News Message Board | |
| Charts:- Daily , Weekly | |
| Add ALCYU to Watchlist: View: Get Complete ALCYU Trend Analysis ➞ | |
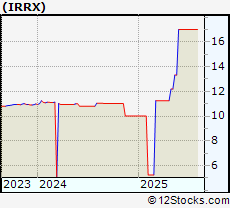 | IRRX Integrated Rail and Resources Acquisition Corp. |
| Sector: Financials | |
| SubSector: SPAC | |
| MarketCap: 251 Millions | |
| Recent Price: 17.00 Smart Investing & Trading Score: 36 | |
| Day Percent Change: 0% Day Change: -9999 | |
| Week Change: -100% Year-to-date Change: -100.0% | |
| IRRX Links: Profile News Message Board | |
| Charts:- Daily , Weekly | |
| Add IRRX to Watchlist: View: Get Complete IRRX Trend Analysis ➞ | |
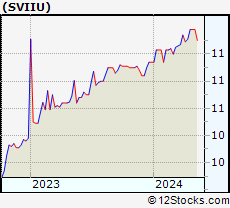 | SVIIU Spring Valley Acquisition Corp. II |
| Sector: Financials | |
| SubSector: SPAC | |
| MarketCap: 324 Millions | |
| Recent Price: 12.89 Smart Investing & Trading Score: 36 | |
| Day Percent Change: 0% Day Change: -9999 | |
| Week Change: -100% Year-to-date Change: -100.0% | |
| SVIIU Links: Profile News Message Board | |
| Charts:- Daily , Weekly | |
| Add SVIIU to Watchlist: View: Get Complete SVIIU Trend Analysis ➞ | |
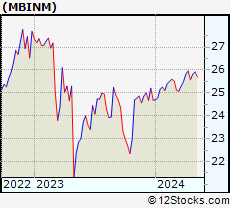 | MBINM Merchants Bancorp |
| Sector: Financials | |
| SubSector: Banks - Regional | |
| MarketCap: 1110 Millions | |
| Recent Price: 24.90 Smart Investing & Trading Score: 36 | |
| Day Percent Change: -0.67% Day Change: -0.17 | |
| Week Change: -0.96% Year-to-date Change: 1.9% | |
| MBINM Links: Profile News Message Board | |
| Charts:- Daily , Weekly | |
| Add MBINM to Watchlist: View: Get Complete MBINM Trend Analysis ➞ | |
 | JXN Jackson Financial Inc |
| Sector: Financials | |
| SubSector: Insurance - Life | |
| MarketCap: 6646.14 Millions | |
| Recent Price: 99.58 Smart Investing & Trading Score: 36 | |
| Day Percent Change: -0.88% Day Change: -0.85 | |
| Week Change: -1.05% Year-to-date Change: 11.8% | |
| JXN Links: Profile News Message Board | |
| Charts:- Daily , Weekly | |
| Add JXN to Watchlist: View: Get Complete JXN Trend Analysis ➞ | |
 | SMMF Summit Financial Group, Inc. |
| Sector: Financials | |
| SubSector: Regional - Mid-Atlantic Banks | |
| MarketCap: 228.959 Millions | |
| Recent Price: 7.05 Smart Investing & Trading Score: 30 | |
| Day Percent Change: 7.79817% Day Change: -9999 | |
| Week Change: -73.2549% Year-to-date Change: 0.0% | |
| SMMF Links: Profile News Message Board | |
| Charts:- Daily , Weekly | |
| Add SMMF to Watchlist: View: Get Complete SMMF Trend Analysis ➞ | |
 | BMTC Bryn Mawr Bank Corporation |
| Sector: Financials | |
| SubSector: Regional - Mid-Atlantic Banks | |
| MarketCap: 572.459 Millions | |
| Recent Price: 20.01 Smart Investing & Trading Score: 30 | |
| Day Percent Change: 5.09454% Day Change: -9999 | |
| Week Change: -56.3957% Year-to-date Change: 0.0% | |
| BMTC Links: Profile News Message Board | |
| Charts:- Daily , Weekly | |
| Add BMTC to Watchlist: View: Get Complete BMTC Trend Analysis ➞ | |
| For tabular summary view of above stock list: Summary View ➞ 0 - 25 , 25 - 50 , 50 - 75 , 75 - 100 , 100 - 125 , 125 - 150 , 150 - 175 , 175 - 200 , 200 - 225 , 225 - 250 , 250 - 275 , 275 - 300 , 300 - 325 , 325 - 350 , 350 - 375 , 375 - 400 , 400 - 425 , 425 - 450 , 450 - 475 , 475 - 500 , 500 - 525 , 525 - 550 , 550 - 575 , 575 - 600 , 600 - 625 , 625 - 650 , 650 - 675 , 675 - 700 , 700 - 725 , 725 - 750 , 750 - 775 , 775 - 800 , 800 - 825 , 825 - 850 , 850 - 875 , 875 - 900 , 900 - 925 , 925 - 950 , 950 - 975 , 975 - 1000 , 1000 - 1025 , 1025 - 1050 , 1050 - 1075 , 1075 - 1100 , 1100 - 1125 , 1125 - 1150 , 1150 - 1175 , 1175 - 1200 , 1200 - 1225 , 1225 - 1250 , 1250 - 1275 , 1275 - 1300 , 1300 - 1325 , 1325 - 1350 , 1350 - 1375 , 1375 - 1400 , 1400 - 1425 , 1425 - 1450 , 1450 - 1475 , 1475 - 1500 , 1500 - 1525 , 1525 - 1550 | ||
| Click To Change The Sort Order: By Market Cap or Company Size Performance: Year-to-date, Week and Day | |
| Select Chart Type: | ||
|
Best Stocks Today 12Stocks.com |
© 2025 12Stocks.com Terms & Conditions Privacy Contact Us
All Information Provided Only For Education And Not To Be Used For Investing or Trading. See Terms & Conditions


One More Thing ... Get Best Stocks Delivered Daily!
Never Ever Miss A Move With Our Top Ten Stocks Lists
Find Best Stocks In Any Market - Bull or Bear Market
Take A Peek At Our Top Ten Stocks Lists: Daily, Weekly, Year-to-Date & Top Trends
Find Best Stocks In Any Market - Bull or Bear Market
Take A Peek At Our Top Ten Stocks Lists: Daily, Weekly, Year-to-Date & Top Trends
Financial Stocks With Best Up Trends [0-bearish to 100-bullish]: Better Home[100], AMREP Corp[100], PIMCO California[100], Torchmark [100], PIMCO California[100], Triumph Bancorp[100], StepStone [100], Radian [100], National Bank[100], PIMCO Municipal[100], MARA [100]
Best Financial Stocks Year-to-Date:
Insight Select[12384.6%], Oxford Lane[292.479%], Better Home[250.328%], Metalpha Technology[213.274%], Robinhood Markets[206.567%], Cipher Mining[145.528%], Mr. Cooper[133.957%], Banco Santander[130.037%], IHS Holding[117.61%], Deutsche Bank[114.776%], LoanDepot [110.733%] Best Financial Stocks This Week:
Colony Starwood[15929900%], Blackhawk Network[91300%], Macquarie Global[81662.9%], Credit Suisse[63241.6%], Pennsylvania Real[23823%], First Republic[22570.9%], Select ome[14000%], CorEnergy Infrastructure[6797.78%], FedNat Holding[5525%], BlackRock Municipal[5340%], BlackRock MuniYield[3379.04%] Best Financial Stocks Daily:
Better Home[13.3451%], AMREP Corp[11.992%], PIMCO California[11.9545%], Torchmark [11.8363%], Forge Global[11.5409%], PIMCO California[11.4754%], BlackRock Muni[10.8108%], Blackrock MuniYield[10.72%], Triumph Bancorp[10.2661%], StepStone [8.74771%], BlackRock MuniYield[8.15348%]