
 Login Sign Up


| |||||
 |  | ||||

| 12Stocks.com Market Intelligence |
Best Europe Stocks
|
On this page, you will find the most comprehensive analysis of European stocks and ETFs - from latest trends to performances to charts ➞. First, here are the year-to-date (YTD) performances of the most requested Europe stocks at 12Stocks.com (click stock for review):
| Deutsche Bank 122% | ||
| British American 60% | ||
| HSBC 47% | ||
| UBS 41% | ||
| Novartis AG 32% | ||
| Astrazeneca 23% | ||
| GSK 23% | ||
| ASML Holding 17% | ||
| Koninklijke Philips 17% | ||
| BP 17% | ||
| Fresenius Medical 16% | ||
| Sap SE 7% | ||
| ABB 0% | ||
| Credit Suisse 0% | ||
| LionShares U.S. 0% | ||
| Unilever 0% | ||
| Transocean -16% | ||
| Diageo -18% | ||
| In a hurry? Europe Stocks Lists: Performance Trends Table, Stock Charts
Sort Europe stocks: Daily, Weekly, Year-to-Date, Market Cap & Trends. Filter Europe stocks list by sector: Show all, Tech, Finance, Energy, Staples, Retail, Industrial, Materials, Utilities and HealthCare Filter Europe stocks list by size:All Europe Large Medium Small and MicroCap |
| 12Stocks.com Europe Stocks Performances & Trends Daily | |||||||||
|
|  The overall Smart Investing & Trading Score is 80 (0-bearish to 100-bullish) which puts Europe index in short term neutral to bullish trend. The Smart Investing & Trading Score from previous trading session is 90 and hence a deterioration of trend.
| ||||||||
Here are the Smart Investing & Trading Scores of the most requested Europe stocks at 12Stocks.com (click stock name for detailed review):
|


| 12Stocks.com: Top Performing Europe Index Stocks | ||||||||||||||||||||||||||||||||||||||||||||||||
 The top performing Europe Index stocks year to date are
Now, more recently, over last week, the top performing Europe Index stocks on the move are


|
||||||||||||||||||||||||||||||||||||||||||||||||
| 12Stocks.com: Investing in Europe Index with Stocks | |
|
The following table helps investors and traders sort through current performance and trends (as measured by Smart Investing & Trading Score) of various
stocks in the Europe Index. Quick View: Move mouse or cursor over stock symbol (ticker) to view short-term technical chart and over stock name to view long term chart. Click on  to add stock symbol to your watchlist and to add stock symbol to your watchlist and  to view watchlist. Click on any ticker or stock name for detailed market intelligence report for that stock. to view watchlist. Click on any ticker or stock name for detailed market intelligence report for that stock. |
12Stocks.com Performance of Stocks in Europe Index
| Ticker | Stock Name | Watchlist | Category | Recent Price | Smart Investing & Trading Score | Change % | YTD Change% |
| ERIC | Telefonaktiebolaget L |   | Technology | 7.92 | 30 | -1.61 | -0.26% |
| BP | BP | | Energy | 33.89 | 30 | -1.68 | 16.68% |
| CB | Chubb | | Financials | 278.11 | 70 | -1.69 | 2.72% |
| QGEN | Qiagen NV | | Health Care | 45.28 | 0 | -1.69 | 5.17% |
| ALC | Alcon | | Health Care | 78.29 | 10 | -1.74 | -5.85% |
| DEO | Diageo | | Consumer Staples | 101.72 | 30 | -1.90 | -18.13% |
| AZN | Astrazeneca | | Health Care | 79.55 | 40 | -1.91 | 23.28% |
| IHG | Intercontinental Hotels | | Services & Goods | 121.02 | 20 | -1.94 | -1.21% |
| SNN | Smith & Nephew ADR | | Health Care | 37.78 | 50 | -1.95 | 57.40% |
| LIVN | LivaNova | | Health Care | 56.22 | 50 | -1.95 | 20.51% |
| IPHA | Innate Pharma | | Health Care | 2.00 | 30 | -1.96 | 6.95% |
| NXPI | NXP Semiconductors | | Technology | 218.82 | 30 | -1.97 | 7.13% |
| GTX | Garrett Motion | | Services & Goods | 13.09 | 40 | -2.02 | 48.70% |
| LXFT | Luxoft Holding | | Technology | 36.56 | 0 | -2.06 | 0.00% |
| VALN | Valneva SE | | Health Care | 8.65 | 30 | -2.15 | 83.26% |
| ROIV | Roivant Sciences | | Health Care | 14.08 | 90 | -2.29 | 16.56% |
| DBVT | DBV | | Health Care | 8.97 | 0 | -2.33 | 175.88% |
| TGE | Generation Essentials | | Financials | 2.82 | 30 | -2.42 | -71.77% |
| PSFE | Paysafe | | Technology | 14.05 | 30 | -2.43 | -18.83% |
| SGHC | Super | | Services & Goods | 12.64 | 80 | -2.47 | 103.60% |
| SOPH | SOPHiA Genetics | | Health Care | 3.12 | 10 | -2.50 | -2.19% |
| NBTX | Nanobiotix ADR | | Health Care | 9.70 | 60 | -2.53 | 234.44% |
| CUK | Carnival | | Services & Goods | 28.75 | 70 | -2.58 | 27.66% |
| PRQR | ProQR | | Health Care | 2.19 | 30 | -2.67 | -20.07% |
| QURE | uniQure N.V | | Health Care | 16.48 | 40 | -2.69 | -8.67% |
| For chart view version of above stock list: Chart View ➞ 0 - 25 , 25 - 50 , 50 - 75 , 75 - 100 , 100 - 125 , 125 - 150 , 150 - 175 , 175 - 200 | ||
 | Click To Change The Sort Order: By Market Cap or Company Size Performance: Year-to-date, Week and Day |  |
|
Get the most comprehensive stock market coverage daily at 12Stocks.com ➞ Best Stocks Today ➞ Best Stocks Weekly ➞ Best Stocks Year-to-Date ➞ Best Stocks Trends ➞  Best Stocks Today 12Stocks.com Best Nasdaq Stocks ➞ Best S&P 500 Stocks ➞ Best Tech Stocks ➞ Best Biotech Stocks ➞ |
| Detailed Overview of Europe Stocks |
| Europe Technical Overview, Leaders & Laggards, Top Europe ETF Funds & Detailed Europe Stocks List, Charts, Trends & More |
| Europe: Technical Analysis, Trends & YTD Performance | |
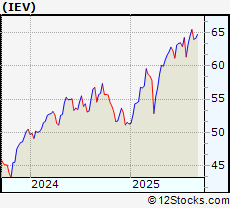
 IEV Weekly Chart |
|
| Long Term Trend: Very Good | |
| Medium Term Trend: Deteriorating | |
 IEV Daily Chart |
|
| Short Term Trend: Very Good | |
| Overall Trend Score: 80 | |
| YTD Performance: 27.1373% | |
| **Trend Scores & Views Are Only For Educational Purposes And Not For Investing | |
| 12Stocks.com: Investing in Europe Index using Exchange Traded Funds | |
|
The following table shows list of key exchange traded funds (ETF) that
help investors play Europe stock market. For detailed view, check out our ETF Funds section of our website. Quick View: Move mouse or cursor over ETF symbol (ticker) to view short-term technical chart and over ETF name to view long term chart. Click on ticker or stock name for detailed view. Click on to add stock symbol to your watchlist and to view watchlist. |
12Stocks.com List of ETFs that track Europe Index
| Ticker | ETF Name | Watchlist | Recent Price | Smart Investing & Trading Score | Change % | Week % | Year-to-date % |
| FEU | Europe 50 | | 50.11 | 90 | 1.54002 | 4.63562 | 26.3171% |
| EUSC | Europe Hedged SmallCap | | 48.87 | 90 | 2.52507 | 4.7807 | 28.0278% |
| QESP | Spain StrategicFactors | | 38.26 | 36 | 0 | 9999 | NA |
| 12Stocks.com: Charts, Trends, Fundamental Data and Performances of Europe Stocks | |
|
We now take in-depth look at all Europe stocks including charts, multi-period performances and overall trends (as measured by Smart Investing & Trading Score). One can sort Europe stocks (click link to choose) by Daily, Weekly and by Year-to-Date performances. Also, one can sort by size of the company or by market capitalization. |
| Select Your Default Chart Type: | |||||
| |||||
| Click on stock symbol or name for detailed view. Click on to add stock symbol to your watchlist and to view watchlist. Quick View: Move mouse or cursor over "Daily" to quickly view daily technical stock chart and over "Weekly" to view weekly technical stock chart. | |||||

 | ERIC Telefonaktiebolaget L M Ericsson ADR |
| Sector: Technology | |
| SubSector: Communication Equipment | |
| MarketCap: 24603 Millions | |
| Recent Price: 7.92 Smart Investing & Trading Score: 30 | |
| Day Percent Change: -1.61491% Day Change: -0.03 | |
| Week Change: -0.251889% Year-to-date Change: -0.3% | |
| ERIC Links: Profile News Message Board | |
| Charts:- Daily , Weekly | |
| Add ERIC to Watchlist: View: Get Complete ERIC Trend Analysis ➞ | |
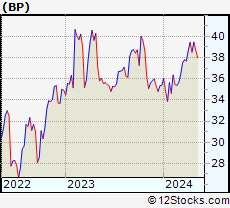 | BP BP plc ADR |
| Sector: Energy | |
| SubSector: Oil & Gas Integrated | |
| MarketCap: 87465.1 Millions | |
| Recent Price: 33.89 Smart Investing & Trading Score: 30 | |
| Day Percent Change: -1.68262% Day Change: 0.17 | |
| Week Change: -1.19534% Year-to-date Change: 16.7% | |
| BP Links: Profile News Message Board | |
| Charts:- Daily , Weekly | |
| Add BP to Watchlist: View: Get Complete BP Trend Analysis ➞ | |
 | CB Chubb Limited |
| Sector: Financials | |
| SubSector: Insurance - Property & Casualty | |
| MarketCap: 110589 Millions | |
| Recent Price: 278.11 Smart Investing & Trading Score: 70 | |
| Day Percent Change: -1.6897% Day Change: -3.79 | |
| Week Change: -0.632414% Year-to-date Change: 2.7% | |
| CB Links: Profile News Message Board | |
| Charts:- Daily , Weekly | |
| Add CB to Watchlist: View: Get Complete CB Trend Analysis ➞ | |
 | QGEN Qiagen NV |
| Sector: Health Care | |
| SubSector: Diagnostics & Research | |
| MarketCap: 10297.2 Millions | |
| Recent Price: 45.28 Smart Investing & Trading Score: 0 | |
| Day Percent Change: -1.69344% Day Change: -0.57 | |
| Week Change: -3.7415% Year-to-date Change: 5.2% | |
| QGEN Links: Profile News Message Board | |
| Charts:- Daily , Weekly | |
| Add QGEN to Watchlist: View: Get Complete QGEN Trend Analysis ➞ | |
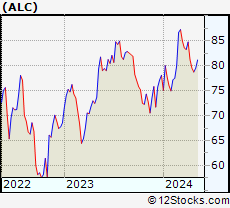 | ALC Alcon Inc |
| Sector: Health Care | |
| SubSector: Medical Instruments & Supplies | |
| MarketCap: 39652.1 Millions | |
| Recent Price: 78.29 Smart Investing & Trading Score: 10 | |
| Day Percent Change: -1.74448% Day Change: -1.86 | |
| Week Change: -0.785705% Year-to-date Change: -5.8% | |
| ALC Links: Profile News Message Board | |
| Charts:- Daily , Weekly | |
| Add ALC to Watchlist: View: Get Complete ALC Trend Analysis ➞ | |
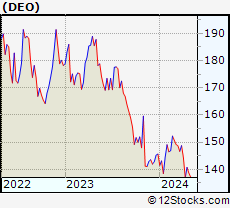 | DEO Diageo plc ADR |
| Sector: Consumer Staples | |
| SubSector: Beverages - Wineries & Distilleries | |
| MarketCap: 61253.8 Millions | |
| Recent Price: 101.72 Smart Investing & Trading Score: 30 | |
| Day Percent Change: -1.89989% Day Change: -0.85 | |
| Week Change: -7.30818% Year-to-date Change: -18.1% | |
| DEO Links: Profile News Message Board | |
| Charts:- Daily , Weekly | |
| Add DEO to Watchlist: View: Get Complete DEO Trend Analysis ➞ | |
 | AZN Astrazeneca plc ADR |
| Sector: Health Care | |
| SubSector: Drug Manufacturers - General | |
| MarketCap: 253309 Millions | |
| Recent Price: 79.55 Smart Investing & Trading Score: 40 | |
| Day Percent Change: -1.90999% Day Change: -1.45 | |
| Week Change: -2.72561% Year-to-date Change: 23.3% | |
| AZN Links: Profile News Message Board | |
| Charts:- Daily , Weekly | |
| Add AZN to Watchlist: View: Get Complete AZN Trend Analysis ➞ | |
 | IHG Intercontinental Hotels Group ADR |
| Sector: Services & Goods | |
| SubSector: Lodging | |
| MarketCap: 18841.6 Millions | |
| Recent Price: 121.02 Smart Investing & Trading Score: 20 | |
| Day Percent Change: -1.94458% Day Change: -1 | |
| Week Change: -0.876403% Year-to-date Change: -1.2% | |
| IHG Links: Profile News Message Board | |
| Charts:- Daily , Weekly | |
| Add IHG to Watchlist: View: Get Complete IHG Trend Analysis ➞ | |
 | SNN Smith & Nephew plc ADR |
| Sector: Health Care | |
| SubSector: Medical Devices | |
| MarketCap: 16598.5 Millions | |
| Recent Price: 37.78 Smart Investing & Trading Score: 50 | |
| Day Percent Change: -1.94654% Day Change: -0.44 | |
| Week Change: 0.371945% Year-to-date Change: 57.4% | |
| SNN Links: Profile News Message Board | |
| Charts:- Daily , Weekly | |
| Add SNN to Watchlist: View: Get Complete SNN Trend Analysis ➞ | |
 | LIVN LivaNova PLC |
| Sector: Health Care | |
| SubSector: Medical Devices | |
| MarketCap: 3165.22 Millions | |
| Recent Price: 56.22 Smart Investing & Trading Score: 50 | |
| Day Percent Change: -1.95326% Day Change: -0.53 | |
| Week Change: -3.319% Year-to-date Change: 20.5% | |
| LIVN Links: Profile News Message Board | |
| Charts:- Daily , Weekly | |
| Add LIVN to Watchlist: View: Get Complete LIVN Trend Analysis ➞ | |
 | IPHA Innate Pharma ADR |
| Sector: Health Care | |
| SubSector: Biotechnology | |
| MarketCap: 188.92 Millions | |
| Recent Price: 2.00 Smart Investing & Trading Score: 30 | |
| Day Percent Change: -1.96078% Day Change: 0 | |
| Week Change: -4.58015% Year-to-date Change: 7.0% | |
| IPHA Links: Profile News Message Board | |
| Charts:- Daily , Weekly | |
| Add IPHA to Watchlist: View: Get Complete IPHA Trend Analysis ➞ | |
 | NXPI NXP Semiconductors NV |
| Sector: Technology | |
| SubSector: Semiconductors | |
| MarketCap: 57164.5 Millions | |
| Recent Price: 218.82 Smart Investing & Trading Score: 30 | |
| Day Percent Change: -1.96676% Day Change: -4.09 | |
| Week Change: -2.91495% Year-to-date Change: 7.1% | |
| NXPI Links: Profile News Message Board | |
| Charts:- Daily , Weekly | |
| Add NXPI to Watchlist: View: Get Complete NXPI Trend Analysis ➞ | |
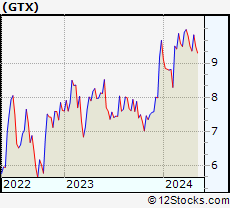 | GTX Garrett Motion Inc |
| Sector: Services & Goods | |
| SubSector: Auto Parts | |
| MarketCap: 2636.61 Millions | |
| Recent Price: 13.09 Smart Investing & Trading Score: 40 | |
| Day Percent Change: -2.02096% Day Change: -0.06 | |
| Week Change: -0.682853% Year-to-date Change: 48.7% | |
| GTX Links: Profile News Message Board | |
| Charts:- Daily , Weekly | |
| Add GTX to Watchlist: View: Get Complete GTX Trend Analysis ➞ | |
 | LXFT Luxoft Holding, Inc. |
| Sector: Technology | |
| SubSector: Application Software | |
| MarketCap: 1958.23 Millions | |
| Recent Price: 36.56 Smart Investing & Trading Score: 0 | |
| Day Percent Change: -2.06268% Day Change: -9999 | |
| Week Change: -23.5946% Year-to-date Change: 0.0% | |
| LXFT Links: Profile News Message Board | |
| Charts:- Daily , Weekly | |
| Add LXFT to Watchlist: View: Get Complete LXFT Trend Analysis ➞ | |
 | VALN Valneva SE ADR |
| Sector: Health Care | |
| SubSector: Biotechnology | |
| MarketCap: 735.51 Millions | |
| Recent Price: 8.65 Smart Investing & Trading Score: 30 | |
| Day Percent Change: -2.14932% Day Change: -0.31 | |
| Week Change: -22.6988% Year-to-date Change: 83.3% | |
| VALN Links: Profile News Message Board | |
| Charts:- Daily , Weekly | |
| Add VALN to Watchlist: View: Get Complete VALN Trend Analysis ➞ | |
 | ROIV Roivant Sciences Ltd |
| Sector: Health Care | |
| SubSector: Biotechnology | |
| MarketCap: 8822.83 Millions | |
| Recent Price: 14.08 Smart Investing & Trading Score: 90 | |
| Day Percent Change: -2.29008% Day Change: 0.09 | |
| Week Change: 12.0127% Year-to-date Change: 16.6% | |
| ROIV Links: Profile News Message Board | |
| Charts:- Daily , Weekly | |
| Add ROIV to Watchlist: View: Get Complete ROIV Trend Analysis ➞ | |
 | DBVT DBV Technologies ADR |
| Sector: Health Care | |
| SubSector: Biotechnology | |
| MarketCap: 245.22 Millions | |
| Recent Price: 8.97 Smart Investing & Trading Score: 0 | |
| Day Percent Change: -2.33115% Day Change: -0.26 | |
| Week Change: -10.34% Year-to-date Change: 175.9% | |
| DBVT Links: Profile News Message Board | |
| Charts:- Daily , Weekly | |
| Add DBVT to Watchlist: View: Get Complete DBVT Trend Analysis ➞ | |
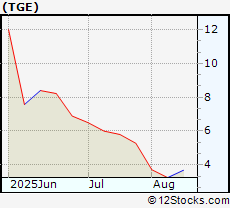 | TGE Generation Essentials Group |
| Sector: Financials | |
| SubSector: Asset Management | |
| MarketCap: 142.96 Millions | |
| Recent Price: 2.82 Smart Investing & Trading Score: 30 | |
| Day Percent Change: -2.42215% Day Change: -0.07 | |
| Week Change: -9.90415% Year-to-date Change: -71.8% | |
| TGE Links: Profile News Message Board | |
| Charts:- Daily , Weekly | |
| Add TGE to Watchlist: View: Get Complete TGE Trend Analysis ➞ | |
 | PSFE Paysafe Limited |
| Sector: Technology | |
| SubSector: Software - Infrastructure | |
| MarketCap: 871.01 Millions | |
| Recent Price: 14.05 Smart Investing & Trading Score: 30 | |
| Day Percent Change: -2.43056% Day Change: -0.2 | |
| Week Change: 4.46097% Year-to-date Change: -18.8% | |
| PSFE Links: Profile News Message Board | |
| Charts:- Daily , Weekly | |
| Add PSFE to Watchlist: View: Get Complete PSFE Trend Analysis ➞ | |
 | SGHC Super Group (SGHC) Limited |
| Sector: Services & Goods | |
| SubSector: Gambling | |
| MarketCap: 6343.11 Millions | |
| Recent Price: 12.64 Smart Investing & Trading Score: 80 | |
| Day Percent Change: -2.46914% Day Change: 0.1 | |
| Week Change: 6.04027% Year-to-date Change: 103.6% | |
| SGHC Links: Profile News Message Board | |
| Charts:- Daily , Weekly | |
| Add SGHC to Watchlist: View: Get Complete SGHC Trend Analysis ➞ | |
 | SOPH SOPHiA Genetics SA |
| Sector: Health Care | |
| SubSector: Health Information Services | |
| MarketCap: 218.96 Millions | |
| Recent Price: 3.12 Smart Investing & Trading Score: 10 | |
| Day Percent Change: -2.5% Day Change: -0.14 | |
| Week Change: -8.5044% Year-to-date Change: -2.2% | |
| SOPH Links: Profile News Message Board | |
| Charts:- Daily , Weekly | |
| Add SOPH to Watchlist: View: Get Complete SOPH Trend Analysis ➞ | |
 | NBTX Nanobiotix ADR |
| Sector: Health Care | |
| SubSector: Biotechnology | |
| MarketCap: 416.9 Millions | |
| Recent Price: 9.70 Smart Investing & Trading Score: 60 | |
| Day Percent Change: -2.52563% Day Change: 1.21 | |
| Week Change: 13.7811% Year-to-date Change: 234.4% | |
| NBTX Links: Profile News Message Board | |
| Charts:- Daily , Weekly | |
| Add NBTX to Watchlist: View: Get Complete NBTX Trend Analysis ➞ | |
 | CUK Carnival plc ADR |
| Sector: Services & Goods | |
| SubSector: Travel Services | |
| MarketCap: 4202.3 Millions | |
| Recent Price: 28.75 Smart Investing & Trading Score: 70 | |
| Day Percent Change: -2.5754% Day Change: 0.03 | |
| Week Change: -0.896243% Year-to-date Change: 27.7% | |
| CUK Links: Profile News Message Board | |
| Charts:- Daily , Weekly | |
| Add CUK to Watchlist: View: Get Complete CUK Trend Analysis ➞ | |
 | PRQR ProQR Therapeutics N.V |
| Sector: Health Care | |
| SubSector: Biotechnology | |
| MarketCap: 257.77 Millions | |
| Recent Price: 2.19 Smart Investing & Trading Score: 30 | |
| Day Percent Change: -2.66667% Day Change: 0.07 | |
| Week Change: -9.87654% Year-to-date Change: -20.1% | |
| PRQR Links: Profile News Message Board | |
| Charts:- Daily , Weekly | |
| Add PRQR to Watchlist: View: Get Complete PRQR Trend Analysis ➞ | |
 | QURE uniQure N.V |
| Sector: Health Care | |
| SubSector: Biotechnology | |
| MarketCap: 984.86 Millions | |
| Recent Price: 16.48 Smart Investing & Trading Score: 40 | |
| Day Percent Change: -2.68595% Day Change: 0.07 | |
| Week Change: -7.022% Year-to-date Change: -8.7% | |
| QURE Links: Profile News Message Board | |
| Charts:- Daily , Weekly | |
| Add QURE to Watchlist: View: Get Complete QURE Trend Analysis ➞ | |
| For tabular summary view of above stock list: Summary View ➞ 0 - 25 , 25 - 50 , 50 - 75 , 75 - 100 , 100 - 125 , 125 - 150 , 150 - 175 , 175 - 200 | ||
| Click To Change The Sort Order: By Market Cap or Company Size Performance: Year-to-date, Week and Day | |
| Select Chart Type: | ||
|
Best Stocks Today 12Stocks.com |
© 2025 12Stocks.com Terms & Conditions Privacy Contact Us
All Information Provided Only For Education And Not To Be Used For Investing or Trading. See Terms & Conditions


One More Thing ... Get Best Stocks Delivered Daily!
Never Ever Miss A Move With Our Top Ten Stocks Lists
Find Best Stocks In Any Market - Bull or Bear Market
Take A Peek At Our Top Ten Stocks Lists: Daily, Weekly, Year-to-Date & Top Trends
Find Best Stocks In Any Market - Bull or Bear Market
Take A Peek At Our Top Ten Stocks Lists: Daily, Weekly, Year-to-Date & Top Trends
Europe Stocks With Best Up Trends [0-bearish to 100-bullish]: Jumia [100], Seadrill Partners[100], Weatherford [100], Transocean [100], ASML Holding[100], AngloGold Ashanti[100], ING Groep[100], Ensco [100], Linde [100], Barclays [100], Prudential [100]
Best Europe Stocks Year-to-Date:
Nanobiotix ADR[234.438%], ATAI Life[189.375%], AngloGold Ashanti[179.141%], DBV [175.877%], Inventiva ADR[162.15%], Jumia [154.103%], Tiziana Life[148.237%], IHS Holding[139.308%], Deutsche Bank[122.067%], Verona Pharma[120.809%], Super [103.595%] Best Europe Stocks This Week:
Credit Suisse[63241.6%], Yandex N.V[2935.27%], Quotient [1782.35%], Weatherford [461.518%], ROYAL DTCH[232.805%], Chicago Bridge[205.472%], Advanced Accelerator[82.7231%], Seadrill Partners[56.1198%], ROYAL DTCH[49.5206%], Ensco [45.9434%], Centessa [37.0836%] Best Europe Stocks Daily:
Arqit Quantum[11.4196%], Vertical Aerospace[4.94071%], Polestar Automotive[4.69%], IHS Holding[3.81992%], Oatly [3.13128%], Sportradar [2.8%], Cool [2.46%], MorphoSys AG[2.43112%], Torm [2.35935%], VEON [2.1097%], AC Immune[2.10084%]