
 Login Sign Up


| |||||
 |  | ||||

| 12Stocks.com Market Intelligence |
Best Europe Stocks
|
On this page, you will find the most comprehensive analysis of European stocks and ETFs - from latest trends to performances to charts ➞. First, here are the year-to-date (YTD) performances of the most requested Europe stocks at 12Stocks.com (click stock for review):
| Deutsche Bank 22% | ||
| SAP SE 22% | ||
| ASML Holding 19% | ||
| GlaxoSmithKline 11% | ||
| BP 11% | ||
| AstraZeneca 5% | ||
| HSBC 3% | ||
| Fresenius Medical 3% | ||
| British American 1% | ||
| Diageo -4% | ||
| Novartis AG -4% | ||
| Transocean -6% | ||
| UBS -8% | ||
| Koninklijke Philips -10% | ||
| In a hurry? Europe Stocks Lists: Performance Trends Table, Stock Charts
Sort Europe stocks: Daily, Weekly, Year-to-Date, Market Cap & Trends. Filter Europe stocks list by sector: Show all, Tech, Finance, Energy, Staples, Retail, Industrial, Materials, Utilities and HealthCare Filter Europe stocks list by size:All Europe Large Medium Small and MicroCap |
| 12Stocks.com Europe Stocks Performances & Trends Daily | |||||||||
|
|  The overall Smart Investing & Trading Score is 88 (0-bearish to 100-bullish) which puts Europe index in short term bullish trend. The Smart Investing & Trading Score from previous trading session is 63 and hence an improvement of trend.
| ||||||||
Here are the Smart Investing & Trading Scores of the most requested Europe stocks at 12Stocks.com (click stock name for detailed review):
|


| 12Stocks.com: Top Performing Europe Index Stocks | ||||||||||||||||||||||||||||||||||||||||||||||||
 The top performing Europe Index stocks year to date are
Now, more recently, over last week, the top performing Europe Index stocks on the move are


|
||||||||||||||||||||||||||||||||||||||||||||||||
| 12Stocks.com: Investing in Europe Index with Stocks | |
|
The following table helps investors and traders sort through current performance and trends (as measured by Smart Investing & Trading Score) of various
stocks in the Europe Index. Quick View: Move mouse or cursor over stock symbol (ticker) to view short-term technical chart and over stock name to view long term chart. Click on  to add stock symbol to your watchlist and to add stock symbol to your watchlist and  to view watchlist. Click on any ticker or stock name for detailed market intelligence report for that stock. to view watchlist. Click on any ticker or stock name for detailed market intelligence report for that stock. |
12Stocks.com Performance of Stocks in Europe Index
| Ticker | Stock Name | Watchlist | Category | Recent Price | Smart Investing & Trading Score | Change % | YTD Change% |
| ADAP | Adaptimmune |   | Health Care | 1.14 | 63 | 12.87 | 43.76% |
| SPOT | Spotify | | Services & Goods | 303.31 | 80 | 11.41 | 61.41% |
| JMIA | Jumia | | Services & Goods | 4.63 | 70 | 11.30 | 31.16% |
| AY | Atlantica Yield | | Utilities | 19.91 | 100 | 7.56 | -7.40% |
| AFMD | Affimed N.V | | Health Care | 5.35 | 68 | 7.00 | 756.00% |
| MYTE | MYT Netherlands | | Services & Goods | 4.29 | 100 | 6.98 | 33.23% |
| SMMT | Summit | | Health Care | 3.73 | 44 | 6.88 | 42.91% |
| NAMS | NewAmsterdam Pharma | | Health Care | 21.50 | 85 | 6.28 | 91.28% |
| ADCT | ADC | | Health Care | 4.97 | 83 | 6.20 | 199.40% |
| SAP | SAP SE | | Technology | 188.01 | 75 | 5.52 | 21.62% |
| MLTX | MoonLake Immuno | | Health Care | 43.24 | 35 | 5.41 | -31.12% |
| EVTL | Vertical Aerospace | | Industrials | 0.80 | 68 | 5.10 | 16.77% |
| ATAI | Atai Life | | Health Care | 1.97 | 43 | 4.79 | 39.72% |
| FMS | Fresenius Medical | | Health Care | 21.48 | 100 | 4.53 | 3.12% |
| PHVS | Pharvaris N.V | | Health Care | 21.70 | 42 | 3.98 | -23.39% |
| IPHA | Innate Pharma | | Health Care | 2.37 | 10 | 3.95 | -15.36% |
| CUK | Carnival | | Services & Goods | 13.42 | 49 | 3.71 | -20.40% |
| ASML | ASML Holding | | Technology | 901.57 | 58 | 3.39 | 19.11% |
| PSNYW | Polestar Automotive | | Services & Goods | 0.16 | 32 | 3.33 | -36.08% |
| EXAI | Exscientia | | Health Care | 4.39 | 17 | 3.29 | -32.15% |
| NXPI | NXP Semiconductors | | Technology | 225.61 | 58 | 3.18 | -1.77% |
| ARQQ | Arqit Quantum | | Technology | 0.50 | 53 | 3.18 | 10.18% |
| ROIV | Roivant Sciences | | Health Care | 10.94 | 68 | 3.06 | -1.53% |
| KNOP | KNOT Offshore | | Transports | 5.24 | 74 | 2.95 | -9.03% |
| DBVT | DBV | | Health Care | 0.68 | 32 | 2.87 | -28.63% |
| For chart view version of above stock list: Chart View ➞ 0 - 25 , 25 - 50 , 50 - 75 , 75 - 100 , 100 - 125 , 125 - 150 | ||
 | Click To Change The Sort Order: By Market Cap or Company Size Performance: Year-to-date, Week and Day |  |
|
Get the most comprehensive stock market coverage daily at 12Stocks.com ➞ Best Stocks Today ➞ Best Stocks Weekly ➞ Best Stocks Year-to-Date ➞ Best Stocks Trends ➞  Best Stocks Today 12Stocks.com Best Nasdaq Stocks ➞ Best S&P 500 Stocks ➞ Best Tech Stocks ➞ Best Biotech Stocks ➞ |
| Detailed Overview of Europe Stocks |
| Europe Technical Overview, Leaders & Laggards, Top Europe ETF Funds & Detailed Europe Stocks List, Charts, Trends & More |
| Europe: Technical Analysis, Trends & YTD Performance | |
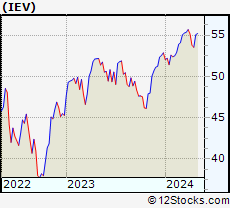
 IEV Weekly Chart |
|
| Long Term Trend: Very Good | |
| Medium Term Trend: Deteriorating | |
 IEV Daily Chart |
|
| Short Term Trend: Very Good | |
| Overall Trend Score: 88 | |
| YTD Performance: 3.92% | |
| **Trend Scores & Views Are Only For Educational Purposes And Not For Investing | |
| 12Stocks.com: Investing in Europe Index using Exchange Traded Funds | |
|
The following table shows list of key exchange traded funds (ETF) that
help investors play Europe stock market. For detailed view, check out our ETF Funds section of our website. Quick View: Move mouse or cursor over ETF symbol (ticker) to view short-term technical chart and over ETF name to view long term chart. Click on ticker or stock name for detailed view. Click on to add stock symbol to your watchlist and to view watchlist. |
12Stocks.com List of ETFs that track Europe Index
| Ticker | ETF Name | Watchlist | Recent Price | Smart Investing & Trading Score | Change % | Week % | Year-to-date % |
| IEV | Europe | | 54.93 | 88 | 1.44 | 2.62 | 3.92% |
| VGK | Europe | | 66.32 | 88 | 1.85 | 2.54 | 2.85% |
| EURL | Europe Bull 3X | | 24.79 | 80 | 4.02 | 8.24 | 4.55% |
| EPV | Short Europe | | 8.07 | 35 | -2.77 | -4.95 | -6.05% |
| IEUS | Europe Small-Cap | | 55.56 | 85 | 1.81 | 2.43 | -1.14% |
| HEDJ | Europe Hedged Equity | | 47.56 | 76 | 0.96 | 2.26 | 10.99% |
| EUSC | Europe Hedged SmallCap | | 38.49 | 88 | 0.76 | 1.74 | 6.91% |
| EUFN | Europe Financials | | 22.67 | 88 | 2.30 | 3.28 | 8.16% |
| EWU | United Kingdom | | 34.27 | 93 | 1.34 | 2.33 | 3.69% |
| EWQ | France | | 40.65 | 78 | 1.07 | 1.85 | 3.75% |
| EWG | Germany | | 30.93 | 70 | 1.81 | 3.07 | 4.18% |
| EWL | Switzerland | | 46.44 | 57 | 0.85 | 1.62 | -3.79% |
| EWN | Netherlands | | 48.49 | 63 | 2.13 | 3.59 | 8.65% |
| EWI | Italy | | 37.61 | 100 | 2.26 | 3.35 | 10.85% |
| FEP | Europe AlphaDEX | | 37.29 | 85 | 1.50 | 2.68 | 2.67% |
| FDD | European Sel Div | | 11.99 | 93 | 1.31 | 2.26 | -0.67% |
| FXE | Euro | | 98.89 | 42 | 0.48 | 0.48 | -3.09% |
| 12Stocks.com: Charts, Trends, Fundamental Data and Performances of Europe Stocks | |
|
We now take in-depth look at all Europe stocks including charts, multi-period performances and overall trends (as measured by Smart Investing & Trading Score). One can sort Europe stocks (click link to choose) by Daily, Weekly and by Year-to-Date performances. Also, one can sort by size of the company or by market capitalization. |
| Select Your Default Chart Type: | |||||
| |||||
| Click on stock symbol or name for detailed view. Click on to add stock symbol to your watchlist and to view watchlist. Quick View: Move mouse or cursor over "Daily" to quickly view daily technical stock chart and over "Weekly" to view weekly technical stock chart. | |||||

 | ADAP Adaptimmune Therapeutics plc |
| Sector: Health Care | |
| SubSector: Biotechnology | |
| MarketCap: 380.985 Millions | |
| Recent Price: 1.14 Smart Investing & Trading Score: 63 | |
| Day Percent Change: 12.87% Day Change: 0.13 | |
| Week Change: 16.72% Year-to-date Change: 43.8% | |
| ADAP Links: Profile News Message Board | |
| Charts:- Daily , Weekly | |
| Add ADAP to Watchlist: View: Get Complete ADAP Trend Analysis ➞ | |
 | SPOT Spotify Technology S.A. |
| Sector: Services & Goods | |
| SubSector: Broadcasting - Radio | |
| MarketCap: 24379.5 Millions | |
| Recent Price: 303.31 Smart Investing & Trading Score: 80 | |
| Day Percent Change: 11.41% Day Change: 31.07 | |
| Week Change: 9.96% Year-to-date Change: 61.4% | |
| SPOT Links: Profile News Message Board | |
| Charts:- Daily , Weekly | |
| Add SPOT to Watchlist: View: Get Complete SPOT Trend Analysis ➞ | |
 | JMIA Jumia Technologies AG |
| Sector: Services & Goods | |
| SubSector: Specialty Retail, Other | |
| MarketCap: 203.644 Millions | |
| Recent Price: 4.63 Smart Investing & Trading Score: 70 | |
| Day Percent Change: 11.30% Day Change: 0.47 | |
| Week Change: 17.51% Year-to-date Change: 31.2% | |
| JMIA Links: Profile News Message Board | |
| Charts:- Daily , Weekly | |
| Add JMIA to Watchlist: View: Get Complete JMIA Trend Analysis ➞ | |
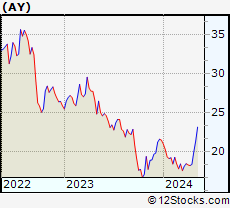 | AY Atlantica Yield plc |
| Sector: Utilities | |
| SubSector: Electric Utilities | |
| MarketCap: 2509.84 Millions | |
| Recent Price: 19.91 Smart Investing & Trading Score: 100 | |
| Day Percent Change: 7.56% Day Change: 1.40 | |
| Week Change: 8.21% Year-to-date Change: -7.4% | |
| AY Links: Profile News Message Board | |
| Charts:- Daily , Weekly | |
| Add AY to Watchlist: View: Get Complete AY Trend Analysis ➞ | |
 | AFMD Affimed N.V. |
| Sector: Health Care | |
| SubSector: Biotechnology | |
| MarketCap: 161.385 Millions | |
| Recent Price: 5.35 Smart Investing & Trading Score: 68 | |
| Day Percent Change: 7.00% Day Change: 0.35 | |
| Week Change: 3.88% Year-to-date Change: 756.0% | |
| AFMD Links: Profile News Message Board | |
| Charts:- Daily , Weekly | |
| Add AFMD to Watchlist: View: Get Complete AFMD Trend Analysis ➞ | |
 | MYTE MYT Netherlands Parent B.V. |
| Sector: Services & Goods | |
| SubSector: Luxury Goods | |
| MarketCap: 330 Millions | |
| Recent Price: 4.29 Smart Investing & Trading Score: 100 | |
| Day Percent Change: 6.98% Day Change: 0.28 | |
| Week Change: 12.01% Year-to-date Change: 33.2% | |
| MYTE Links: Profile News Message Board | |
| Charts:- Daily , Weekly | |
| Add MYTE to Watchlist: View: Get Complete MYTE Trend Analysis ➞ | |
 | SMMT Summit Therapeutics plc |
| Sector: Health Care | |
| SubSector: Biotechnology | |
| MarketCap: 156.985 Millions | |
| Recent Price: 3.73 Smart Investing & Trading Score: 44 | |
| Day Percent Change: 6.88% Day Change: 0.24 | |
| Week Change: 6.57% Year-to-date Change: 42.9% | |
| SMMT Links: Profile News Message Board | |
| Charts:- Daily , Weekly | |
| Add SMMT to Watchlist: View: Get Complete SMMT Trend Analysis ➞ | |
 | NAMS NewAmsterdam Pharma Company N.V. |
| Sector: Health Care | |
| SubSector: Biotechnology | |
| MarketCap: 979 Millions | |
| Recent Price: 21.50 Smart Investing & Trading Score: 85 | |
| Day Percent Change: 6.28% Day Change: 1.27 | |
| Week Change: 7.88% Year-to-date Change: 91.3% | |
| NAMS Links: Profile News Message Board | |
| Charts:- Daily , Weekly | |
| Add NAMS to Watchlist: View: Get Complete NAMS Trend Analysis ➞ | |
 | ADCT ADC Therapeutics SA |
| Sector: Health Care | |
| SubSector: Biotechnology | |
| MarketCap: 26087 Millions | |
| Recent Price: 4.97 Smart Investing & Trading Score: 83 | |
| Day Percent Change: 6.20% Day Change: 0.29 | |
| Week Change: 2.05% Year-to-date Change: 199.4% | |
| ADCT Links: Profile News Message Board | |
| Charts:- Daily , Weekly | |
| Add ADCT to Watchlist: View: Get Complete ADCT Trend Analysis ➞ | |
 | SAP SAP SE |
| Sector: Technology | |
| SubSector: Application Software | |
| MarketCap: 129635 Millions | |
| Recent Price: 188.01 Smart Investing & Trading Score: 75 | |
| Day Percent Change: 5.52% Day Change: 9.83 | |
| Week Change: 6.96% Year-to-date Change: 21.6% | |
| SAP Links: Profile News Message Board | |
| Charts:- Daily , Weekly | |
| Add SAP to Watchlist: View: Get Complete SAP Trend Analysis ➞ | |
 | MLTX MoonLake Immunotherapeutics |
| Sector: Health Care | |
| SubSector: Biotechnology | |
| MarketCap: 2670 Millions | |
| Recent Price: 43.24 Smart Investing & Trading Score: 35 | |
| Day Percent Change: 5.41% Day Change: 2.22 | |
| Week Change: 2.49% Year-to-date Change: -31.1% | |
| MLTX Links: Profile News Message Board | |
| Charts:- Daily , Weekly | |
| Add MLTX to Watchlist: View: Get Complete MLTX Trend Analysis ➞ | |
 | EVTL Vertical Aerospace Ltd. |
| Sector: Industrials | |
| SubSector: Aerospace & Defense | |
| MarketCap: 403 Millions | |
| Recent Price: 0.80 Smart Investing & Trading Score: 68 | |
| Day Percent Change: 5.10% Day Change: 0.04 | |
| Week Change: 11.11% Year-to-date Change: 16.8% | |
| EVTL Links: Profile News Message Board | |
| Charts:- Daily , Weekly | |
| Add EVTL to Watchlist: View: Get Complete EVTL Trend Analysis ➞ | |
 | ATAI Atai Life Sciences N.V. |
| Sector: Health Care | |
| SubSector: Biotechnology | |
| MarketCap: 287 Millions | |
| Recent Price: 1.97 Smart Investing & Trading Score: 43 | |
| Day Percent Change: 4.79% Day Change: 0.09 | |
| Week Change: 6.49% Year-to-date Change: 39.7% | |
| ATAI Links: Profile News Message Board | |
| Charts:- Daily , Weekly | |
| Add ATAI to Watchlist: View: Get Complete ATAI Trend Analysis ➞ | |
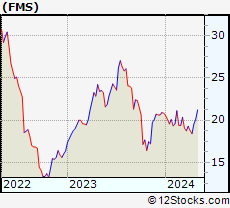 | FMS Fresenius Medical Care AG & Co. KGaA |
| Sector: Health Care | |
| SubSector: Specialized Health Services | |
| MarketCap: 17551.6 Millions | |
| Recent Price: 21.48 Smart Investing & Trading Score: 100 | |
| Day Percent Change: 4.53% Day Change: 0.93 | |
| Week Change: 9.93% Year-to-date Change: 3.1% | |
| FMS Links: Profile News Message Board | |
| Charts:- Daily , Weekly | |
| Add FMS to Watchlist: View: Get Complete FMS Trend Analysis ➞ | |
 | PHVS Pharvaris N.V. |
| Sector: Health Care | |
| SubSector: Biotechnology | |
| MarketCap: 475 Millions | |
| Recent Price: 21.70 Smart Investing & Trading Score: 42 | |
| Day Percent Change: 3.98% Day Change: 0.83 | |
| Week Change: 13.26% Year-to-date Change: -23.4% | |
| PHVS Links: Profile News Message Board | |
| Charts:- Daily , Weekly | |
| Add PHVS to Watchlist: View: Get Complete PHVS Trend Analysis ➞ | |
 | IPHA Innate Pharma S.A. |
| Sector: Health Care | |
| SubSector: Biotechnology | |
| MarketCap: 309.485 Millions | |
| Recent Price: 2.37 Smart Investing & Trading Score: 10 | |
| Day Percent Change: 3.95% Day Change: 0.09 | |
| Week Change: -4.44% Year-to-date Change: -15.4% | |
| IPHA Links: Profile News Message Board | |
| Charts:- Daily , Weekly | |
| Add IPHA to Watchlist: View: Get Complete IPHA Trend Analysis ➞ | |
 | CUK Carnival Corporation & Plc |
| Sector: Services & Goods | |
| SubSector: General Entertainment | |
| MarketCap: 10703.9 Millions | |
| Recent Price: 13.42 Smart Investing & Trading Score: 49 | |
| Day Percent Change: 3.71% Day Change: 0.48 | |
| Week Change: 5.42% Year-to-date Change: -20.4% | |
| CUK Links: Profile News Message Board | |
| Charts:- Daily , Weekly | |
| Add CUK to Watchlist: View: Get Complete CUK Trend Analysis ➞ | |
 | ASML ASML Holding N.V. |
| Sector: Technology | |
| SubSector: Semiconductor Equipment & Materials | |
| MarketCap: 102565 Millions | |
| Recent Price: 901.57 Smart Investing & Trading Score: 58 | |
| Day Percent Change: 3.39% Day Change: 29.52 | |
| Week Change: 4.89% Year-to-date Change: 19.1% | |
| ASML Links: Profile News Message Board | |
| Charts:- Daily , Weekly | |
| Add ASML to Watchlist: View: Get Complete ASML Trend Analysis ➞ | |
 | PSNYW Polestar Automotive Holding UK PLC |
| Sector: Services & Goods | |
| SubSector: Auto Manufacturers | |
| MarketCap: 1450 Millions | |
| Recent Price: 0.16 Smart Investing & Trading Score: 32 | |
| Day Percent Change: 3.33% Day Change: 0.01 | |
| Week Change: 5.44% Year-to-date Change: -36.1% | |
| PSNYW Links: Profile News Message Board | |
| Charts:- Daily , Weekly | |
| Add PSNYW to Watchlist: View: Get Complete PSNYW Trend Analysis ➞ | |
 | EXAI Exscientia plc |
| Sector: Health Care | |
| SubSector: Biotechnology | |
| MarketCap: 796 Millions | |
| Recent Price: 4.39 Smart Investing & Trading Score: 17 | |
| Day Percent Change: 3.29% Day Change: 0.14 | |
| Week Change: 3.54% Year-to-date Change: -32.2% | |
| EXAI Links: Profile News Message Board | |
| Charts:- Daily , Weekly | |
| Add EXAI to Watchlist: View: Get Complete EXAI Trend Analysis ➞ | |
 | NXPI NXP Semiconductors N.V. |
| Sector: Technology | |
| SubSector: Semiconductor - Broad Line | |
| MarketCap: 22497.9 Millions | |
| Recent Price: 225.61 Smart Investing & Trading Score: 58 | |
| Day Percent Change: 3.18% Day Change: 6.95 | |
| Week Change: 4.88% Year-to-date Change: -1.8% | |
| NXPI Links: Profile News Message Board | |
| Charts:- Daily , Weekly | |
| Add NXPI to Watchlist: View: Get Complete NXPI Trend Analysis ➞ | |
 | ARQQ Arqit Quantum Inc. |
| Sector: Technology | |
| SubSector: Software - Infrastructure | |
| MarketCap: 165 Millions | |
| Recent Price: 0.50 Smart Investing & Trading Score: 53 | |
| Day Percent Change: 3.18% Day Change: 0.02 | |
| Week Change: 6.79% Year-to-date Change: 10.2% | |
| ARQQ Links: Profile News Message Board | |
| Charts:- Daily , Weekly | |
| Add ARQQ to Watchlist: View: Get Complete ARQQ Trend Analysis ➞ | |
 | ROIV Roivant Sciences Ltd. |
| Sector: Health Care | |
| SubSector: Biotechnology | |
| MarketCap: 7780 Millions | |
| Recent Price: 10.94 Smart Investing & Trading Score: 68 | |
| Day Percent Change: 3.06% Day Change: 0.33 | |
| Week Change: 4.54% Year-to-date Change: -1.5% | |
| ROIV Links: Profile News Message Board | |
| Charts:- Daily , Weekly | |
| Add ROIV to Watchlist: View: Get Complete ROIV Trend Analysis ➞ | |
 | KNOP KNOT Offshore Partners LP |
| Sector: Transports | |
| SubSector: Shipping | |
| MarketCap: 349.214 Millions | |
| Recent Price: 5.24 Smart Investing & Trading Score: 74 | |
| Day Percent Change: 2.95% Day Change: 0.15 | |
| Week Change: 2.75% Year-to-date Change: -9.0% | |
| KNOP Links: Profile News Message Board | |
| Charts:- Daily , Weekly | |
| Add KNOP to Watchlist: View: Get Complete KNOP Trend Analysis ➞ | |
 | DBVT DBV Technologies S.A. |
| Sector: Health Care | |
| SubSector: Biotechnology | |
| MarketCap: 405.885 Millions | |
| Recent Price: 0.68 Smart Investing & Trading Score: 32 | |
| Day Percent Change: 2.87% Day Change: 0.02 | |
| Week Change: -0.25% Year-to-date Change: -28.6% | |
| DBVT Links: Profile News Message Board | |
| Charts:- Daily , Weekly | |
| Add DBVT to Watchlist: View: Get Complete DBVT Trend Analysis ➞ | |
| For tabular summary view of above stock list: Summary View ➞ 0 - 25 , 25 - 50 , 50 - 75 , 75 - 100 , 100 - 125 , 125 - 150 | ||
| Click To Change The Sort Order: By Market Cap or Company Size Performance: Year-to-date, Week and Day | |
| Select Chart Type: | ||
|
Best Stocks Today 12Stocks.com |
© 2024 12Stocks.com Terms & Conditions Privacy Contact Us
All Information Provided Only For Education And Not To Be Used For Investing or Trading. See Terms & Conditions


One More Thing ... Get Best Stocks Delivered Daily!
Never Ever Miss A Move With Our Top Ten Stocks Lists
Find Best Stocks In Any Market - Bull or Bear Market
Take A Peek At Our Top Ten Stocks Lists: Daily, Weekly, Year-to-Date & Top Trends
Find Best Stocks In Any Market - Bull or Bear Market
Take A Peek At Our Top Ten Stocks Lists: Daily, Weekly, Year-to-Date & Top Trends
Europe Stocks With Best Up Trends [0-bearish to 100-bullish]: Atlantica Yield[100], MYT Netherlands[100], Fresenius Medical[100], LivaNova [100], AstraZeneca [100], WPP [100], HSBC [100], Deutsche Bank[95], Aegon N.V[93], Vodafone [93], Lilium N.V[90]
Best Europe Stocks Year-to-Date:
NuCana [1252.27%], Affimed N.V[756%], Addex [207.72%], ADC [199.4%], NewAmsterdam Pharma[91.28%], MorphoSys AG[82.22%], Renalytix AI[78.9%], Spotify [61.41%], Merus N.V[48.44%], Adaptimmune [43.76%], Summit [42.91%] Best Europe Stocks This Week:
Jumia [17.51%], Molecular Partners[16.87%], Adaptimmune [16.72%], Pharvaris N.V[13.26%], MYT Netherlands[12.01%], Vertical Aerospace[11.11%], Spotify [9.96%], Fresenius Medical[9.93%], CureVac N.V[8.33%], Atlantica Yield[8.21%], NewAmsterdam Pharma[7.88%] Best Europe Stocks Daily:
Adaptimmune [12.87%], Spotify [11.41%], Jumia [11.30%], Atlantica Yield[7.56%], Affimed N.V[7.00%], MYT Netherlands[6.98%], Summit [6.88%], NewAmsterdam Pharma[6.28%], ADC [6.20%], SAP SE[5.52%], MoonLake Immuno[5.41%]