
 Login Sign Up


| |||||
 |  | ||||

| 12Stocks.com Market Intelligence |
Best Europe Stocks
|
On this page, you will find the most comprehensive analysis of European stocks and ETFs - from latest trends to performances to charts ➞. First, here are the year-to-date (YTD) performances of the most requested Europe stocks at 12Stocks.com (click stock for review):
| ASML Holding 17% | ||
| Deutsche Bank 17% | ||
| SAP SE 16% | ||
| BP 7% | ||
| GlaxoSmithKline 6% | ||
| AstraZeneca 2% | ||
| HSBC -0% | ||
| British American -2% | ||
| Diageo -3% | ||
| Fresenius Medical -7% | ||
| Novartis AG -8% | ||
| UBS -9% | ||
| Transocean -13% | ||
| Koninklijke Philips -14% | ||
| In a hurry? Europe Stocks Lists: Performance Trends Table, Stock Charts
Sort Europe stocks: Daily, Weekly, Year-to-Date, Market Cap & Trends. Filter Europe stocks list by sector: Show all, Tech, Finance, Energy, Staples, Retail, Industrial, Materials, Utilities and HealthCare Filter Europe stocks list by size:All Europe Large Medium Small and MicroCap |
| 12Stocks.com Europe Stocks Performances & Trends Daily | |||||||||
|
|  The overall Smart Investing & Trading Score is 51 (0-bearish to 100-bullish) which puts Europe index in short term neutral trend. The Smart Investing & Trading Score from previous trading session is 26 and an improvement of trend continues.
| ||||||||
Here are the Smart Investing & Trading Scores of the most requested Europe stocks at 12Stocks.com (click stock name for detailed review):
|


| 12Stocks.com: Top Performing Europe Index Stocks | ||||||||||||||||||||||||||||||||||||||||||||||||
 The top performing Europe Index stocks year to date are
Now, more recently, over last week, the top performing Europe Index stocks on the move are


|
||||||||||||||||||||||||||||||||||||||||||||||||
| 12Stocks.com: Investing in Europe Index with Stocks | |
|
The following table helps investors and traders sort through current performance and trends (as measured by Smart Investing & Trading Score) of various
stocks in the Europe Index. Quick View: Move mouse or cursor over stock symbol (ticker) to view short-term technical chart and over stock name to view long term chart. Click on  to add stock symbol to your watchlist and to add stock symbol to your watchlist and  to view watchlist. Click on any ticker or stock name for detailed market intelligence report for that stock. to view watchlist. Click on any ticker or stock name for detailed market intelligence report for that stock. |
12Stocks.com Performance of Stocks in Europe Index
| Ticker | Stock Name | Watchlist | Category | Recent Price | Smart Investing & Trading Score | Change % | YTD Change% |
| RELX | RELX |   | Technology | 41.43 | 31 | -0.05 | 4.46% |
| PSO | Pearson | | Services & Goods | 12.30 | 38 | -0.08 | 0.08% |
| LIN | Linde | | Materials | 446.43 | 51 | -0.08 | 8.70% |
| AFRI | Forafric Global | | Consumer Staples | 10.34 | 43 | -0.10 | -2.36% |
| CPRI | Capri | | Consumer Staples | 37.83 | 10 | -0.11 | -24.70% |
| RIO | Rio Tinto | | Materials | 66.68 | 43 | -0.15 | -10.45% |
| NBTX | Nanobiotix S.A | | Health Care | 5.34 | 0 | -0.19 | -28.03% |
| SOPH | SOPHiA GENETICS | | Health Care | 4.78 | 31 | -0.21 | -1.44% |
| ONON | On Holding | | Services & Goods | 33.29 | 68 | -0.24 | 22.03% |
| GRMN | Garmin | | Technology | 140.72 | 49 | -0.25 | 9.48% |
| AZN | AstraZeneca | | Health Care | 68.36 | 71 | -0.25 | 1.50% |
| BNTX | BioNTech SE | | Health Care | 86.17 | 20 | -0.27 | -18.35% |
| CNTA | Centessa | | Health Care | 10.79 | 31 | -0.28 | 33.54% |
| LYB | LyondellBasell Industries | | Materials | 99.40 | 43 | -0.30 | 4.54% |
| MLTX | MoonLake Immuno | | Health Care | 43.39 | 28 | -0.31 | -30.89% |
| IPHA | Innate Pharma | | Health Care | 2.40 | 0 | -0.41 | -14.29% |
| NVS | Novartis AG | | Health Care | 92.57 | 0 | -0.55 | -8.32% |
| GENI | Genius Sports | | Services & Goods | 5.24 | 25 | -0.57 | -15.82% |
| CSTM | Constellium SE | | Materials | 20.61 | 31 | -0.58 | 3.26% |
| TEL | TE Connectivity | | Technology | 140.48 | 0 | -0.71 | -0.01% |
| SAP | SAP SE | | Technology | 178.64 | 36 | -0.72 | 15.56% |
| OCS | Oculis Holding | | Health Care | 11.90 | 10 | -0.75 | 7.20% |
| GSK | GlaxoSmithKline | | Health Care | 39.27 | 13 | -0.83 | 5.96% |
| AUTL | Autolus | | Health Care | 4.80 | 10 | -0.83 | -25.47% |
| PHG | Koninklijke Philips | | Technology | 19.98 | 18 | -0.84 | -14.36% |
| For chart view version of above stock list: Chart View ➞ 0 - 25 , 25 - 50 , 50 - 75 , 75 - 100 , 100 - 125 , 125 - 150 | ||
 | Click To Change The Sort Order: By Market Cap or Company Size Performance: Year-to-date, Week and Day |  |
|
Get the most comprehensive stock market coverage daily at 12Stocks.com ➞ Best Stocks Today ➞ Best Stocks Weekly ➞ Best Stocks Year-to-Date ➞ Best Stocks Trends ➞  Best Stocks Today 12Stocks.com Best Nasdaq Stocks ➞ Best S&P 500 Stocks ➞ Best Tech Stocks ➞ Best Biotech Stocks ➞ |
| Detailed Overview of Europe Stocks |
| Europe Technical Overview, Leaders & Laggards, Top Europe ETF Funds & Detailed Europe Stocks List, Charts, Trends & More |
| Europe: Technical Analysis, Trends & YTD Performance | |
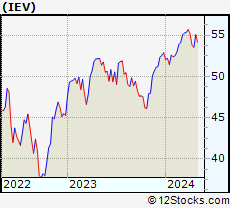
 IEV Weekly Chart |
|
| Long Term Trend: Good | |
| Medium Term Trend: Not Good | |
 IEV Daily Chart |
|
| Short Term Trend: Deteriorating | |
| Overall Trend Score: 51 | |
| YTD Performance: 1% | |
| **Trend Scores & Views Are Only For Educational Purposes And Not For Investing | |
| 12Stocks.com: Investing in Europe Index using Exchange Traded Funds | |
|
The following table shows list of key exchange traded funds (ETF) that
help investors play Europe stock market. For detailed view, check out our ETF Funds section of our website. Quick View: Move mouse or cursor over ETF symbol (ticker) to view short-term technical chart and over ETF name to view long term chart. Click on ticker or stock name for detailed view. Click on to add stock symbol to your watchlist and to view watchlist. |
12Stocks.com List of ETFs that track Europe Index
| Ticker | ETF Name | Watchlist | Recent Price | Smart Investing & Trading Score | Change % | Week % | Year-to-date % |
| IEV | Europe | | 53.39 | 51 | -0.28 | -0.73 | 1% |
| VGK | Europe | | 64.52 | 51 | -0.23 | -0.85 | 0.06% |
| EURL | Europe Bull 3X | | 22.81 | 36 | -1.04 | -3.35 | -3.8% |
| EPV | Short Europe | | 8.52 | 62 | 0.47 | 1.73 | -0.87% |
| IEUS | Europe Small-Cap | | 54.39 | 35 | 0.13 | -1 | -3.22% |
| HEDJ | Europe Hedged Equity | | 46.63 | 61 | 0.21 | -0.55 | 8.82% |
| EUSC | Europe Hedged SmallCap | | 37.74 | 53 | -0.05 | -0.61 | 4.82% |
| EUFN | Europe Financials | | 21.87 | 56 | 0.28 | -0.09 | 4.34% |
| EWU | United Kingdom | | 33.33 | 61 | -0.24 | -1.16 | 0.85% |
| EWQ | France | | 39.81 | 51 | 0.15 | 0.5 | 1.61% |
| EWG | Germany | | 30.04 | 36 | -0.36 | -0.69 | 1.18% |
| EWL | Switzerland | | 45.18 | 10 | -0.40 | -0.86 | -6.4% |
| EWN | Netherlands | | 47.21 | 26 | -0.63 | -2.11 | 5.78% |
| EWI | Italy | | 36.10 | 51 | 0.14 | 0.36 | 6.4% |
| FEP | Europe AlphaDEX | | 36.30 | 33 | -0.11 | -0.95 | -0.06% |
| FDD | European Sel Div | | 11.66 | 61 | 0.17 | -0.17 | -3.4% |
| FXE | Euro | | 98.34 | 25 | -0.24 | 0.11 | -3.63% |
| 12Stocks.com: Charts, Trends, Fundamental Data and Performances of Europe Stocks | |
|
We now take in-depth look at all Europe stocks including charts, multi-period performances and overall trends (as measured by Smart Investing & Trading Score). One can sort Europe stocks (click link to choose) by Daily, Weekly and by Year-to-Date performances. Also, one can sort by size of the company or by market capitalization. |
| Select Your Default Chart Type: | |||||
| |||||
| Click on stock symbol or name for detailed view. Click on to add stock symbol to your watchlist and to view watchlist. Quick View: Move mouse or cursor over "Daily" to quickly view daily technical stock chart and over "Weekly" to view weekly technical stock chart. | |||||

 | RELX RELX PLC |
| Sector: Technology | |
| SubSector: Information & Delivery Services | |
| MarketCap: 36730.7 Millions | |
| Recent Price: 41.43 Smart Investing & Trading Score: 31 | |
| Day Percent Change: -0.05% Day Change: -0.02 | |
| Week Change: -0.81% Year-to-date Change: 4.5% | |
| RELX Links: Profile News Message Board | |
| Charts:- Daily , Weekly | |
| Add RELX to Watchlist: View: Get Complete RELX Trend Analysis ➞ | |
 | PSO Pearson plc |
| Sector: Services & Goods | |
| SubSector: Publishing - Books | |
| MarketCap: 4595.42 Millions | |
| Recent Price: 12.30 Smart Investing & Trading Score: 38 | |
| Day Percent Change: -0.08% Day Change: -0.01 | |
| Week Change: -0.97% Year-to-date Change: 0.1% | |
| PSO Links: Profile News Message Board | |
| Charts:- Daily , Weekly | |
| Add PSO to Watchlist: View: Get Complete PSO Trend Analysis ➞ | |
 | LIN Linde plc |
| Sector: Materials | |
| SubSector: Specialty Chemicals | |
| MarketCap: 88539.2 Millions | |
| Recent Price: 446.43 Smart Investing & Trading Score: 51 | |
| Day Percent Change: -0.08% Day Change: -0.36 | |
| Week Change: -0.22% Year-to-date Change: 8.7% | |
| LIN Links: Profile News Message Board | |
| Charts:- Daily , Weekly | |
| Add LIN to Watchlist: View: Get Complete LIN Trend Analysis ➞ | |
 | AFRI Forafric Global PLC |
| Sector: Consumer Staples | |
| SubSector: Farm Products | |
| MarketCap: 295 Millions | |
| Recent Price: 10.34 Smart Investing & Trading Score: 43 | |
| Day Percent Change: -0.10% Day Change: -0.01 | |
| Week Change: 0.49% Year-to-date Change: -2.4% | |
| AFRI Links: Profile News Message Board | |
| Charts:- Daily , Weekly | |
| Add AFRI to Watchlist: View: Get Complete AFRI Trend Analysis ➞ | |
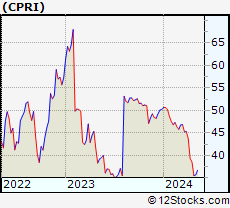 | CPRI Capri Holdings Limited |
| Sector: Consumer Staples | |
| SubSector: Textile - Apparel Clothing | |
| MarketCap: 1935.65 Millions | |
| Recent Price: 37.83 Smart Investing & Trading Score: 10 | |
| Day Percent Change: -0.11% Day Change: -0.04 | |
| Week Change: -3.76% Year-to-date Change: -24.7% | |
| CPRI Links: Profile News Message Board | |
| Charts:- Daily , Weekly | |
| Add CPRI to Watchlist: View: Get Complete CPRI Trend Analysis ➞ | |
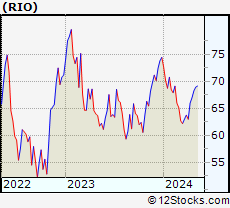 | RIO Rio Tinto Group |
| Sector: Materials | |
| SubSector: Industrial Metals & Minerals | |
| MarketCap: 69399.7 Millions | |
| Recent Price: 66.68 Smart Investing & Trading Score: 43 | |
| Day Percent Change: -0.15% Day Change: -0.10 | |
| Week Change: 1.05% Year-to-date Change: -10.5% | |
| RIO Links: Profile News Message Board | |
| Charts:- Daily , Weekly | |
| Add RIO to Watchlist: View: Get Complete RIO Trend Analysis ➞ | |
 | NBTX Nanobiotix S.A. |
| Sector: Health Care | |
| SubSector: Biotechnology | |
| MarketCap: 177 Millions | |
| Recent Price: 5.34 Smart Investing & Trading Score: 0 | |
| Day Percent Change: -0.19% Day Change: -0.01 | |
| Week Change: -12.32% Year-to-date Change: -28.0% | |
| NBTX Links: Profile News Message Board | |
| Charts:- Daily , Weekly | |
| Add NBTX to Watchlist: View: Get Complete NBTX Trend Analysis ➞ | |
 | SOPH SOPHiA GENETICS SA |
| Sector: Health Care | |
| SubSector: Health Information Services | |
| MarketCap: 278 Millions | |
| Recent Price: 4.78 Smart Investing & Trading Score: 31 | |
| Day Percent Change: -0.21% Day Change: -0.01 | |
| Week Change: -4.4% Year-to-date Change: -1.4% | |
| SOPH Links: Profile News Message Board | |
| Charts:- Daily , Weekly | |
| Add SOPH to Watchlist: View: Get Complete SOPH Trend Analysis ➞ | |
 | ONON On Holding AG |
| Sector: Services & Goods | |
| SubSector: Footwear & Accessories | |
| MarketCap: 10600 Millions | |
| Recent Price: 33.29 Smart Investing & Trading Score: 68 | |
| Day Percent Change: -0.24% Day Change: -0.08 | |
| Week Change: 1.28% Year-to-date Change: 22.0% | |
| ONON Links: Profile News Message Board | |
| Charts:- Daily , Weekly | |
| Add ONON to Watchlist: View: Get Complete ONON Trend Analysis ➞ | |
 | GRMN Garmin Ltd. |
| Sector: Technology | |
| SubSector: Scientific & Technical Instruments | |
| MarketCap: 13909.3 Millions | |
| Recent Price: 140.72 Smart Investing & Trading Score: 49 | |
| Day Percent Change: -0.25% Day Change: -0.35 | |
| Week Change: -1.67% Year-to-date Change: 9.5% | |
| GRMN Links: Profile News Message Board | |
| Charts:- Daily , Weekly | |
| Add GRMN to Watchlist: View: Get Complete GRMN Trend Analysis ➞ | |
 | AZN AstraZeneca PLC |
| Sector: Health Care | |
| SubSector: Drug Manufacturers - Major | |
| MarketCap: 113154 Millions | |
| Recent Price: 68.36 Smart Investing & Trading Score: 71 | |
| Day Percent Change: -0.25% Day Change: -0.17 | |
| Week Change: -0.83% Year-to-date Change: 1.5% | |
| AZN Links: Profile News Message Board | |
| Charts:- Daily , Weekly | |
| Add AZN to Watchlist: View: Get Complete AZN Trend Analysis ➞ | |
 | BNTX BioNTech SE |
| Sector: Health Care | |
| SubSector: Biotechnology | |
| MarketCap: 11933.7 Millions | |
| Recent Price: 86.17 Smart Investing & Trading Score: 20 | |
| Day Percent Change: -0.27% Day Change: -0.23 | |
| Week Change: -0.36% Year-to-date Change: -18.4% | |
| BNTX Links: Profile News Message Board | |
| Charts:- Daily , Weekly | |
| Add BNTX to Watchlist: View: Get Complete BNTX Trend Analysis ➞ | |
 | CNTA Centessa Pharmaceuticals plc |
| Sector: Health Care | |
| SubSector: Biotechnology | |
| MarketCap: 616 Millions | |
| Recent Price: 10.79 Smart Investing & Trading Score: 31 | |
| Day Percent Change: -0.28% Day Change: -0.03 | |
| Week Change: -4.68% Year-to-date Change: 33.5% | |
| CNTA Links: Profile News Message Board | |
| Charts:- Daily , Weekly | |
| Add CNTA to Watchlist: View: Get Complete CNTA Trend Analysis ➞ | |
 | LYB LyondellBasell Industries N.V. |
| Sector: Materials | |
| SubSector: Specialty Chemicals | |
| MarketCap: 16420.7 Millions | |
| Recent Price: 99.40 Smart Investing & Trading Score: 43 | |
| Day Percent Change: -0.30% Day Change: -0.30 | |
| Week Change: -2.1% Year-to-date Change: 4.5% | |
| LYB Links: Profile News Message Board | |
| Charts:- Daily , Weekly | |
| Add LYB to Watchlist: View: Get Complete LYB Trend Analysis ➞ | |
 | MLTX MoonLake Immunotherapeutics |
| Sector: Health Care | |
| SubSector: Biotechnology | |
| MarketCap: 2670 Millions | |
| Recent Price: 43.39 Smart Investing & Trading Score: 28 | |
| Day Percent Change: -0.31% Day Change: -0.13 | |
| Week Change: -1.18% Year-to-date Change: -30.9% | |
| MLTX Links: Profile News Message Board | |
| Charts:- Daily , Weekly | |
| Add MLTX to Watchlist: View: Get Complete MLTX Trend Analysis ➞ | |
 | IPHA Innate Pharma S.A. |
| Sector: Health Care | |
| SubSector: Biotechnology | |
| MarketCap: 309.485 Millions | |
| Recent Price: 2.40 Smart Investing & Trading Score: 0 | |
| Day Percent Change: -0.41% Day Change: -0.01 | |
| Week Change: -3.23% Year-to-date Change: -14.3% | |
| IPHA Links: Profile News Message Board | |
| Charts:- Daily , Weekly | |
| Add IPHA to Watchlist: View: Get Complete IPHA Trend Analysis ➞ | |
 | NVS Novartis AG |
| Sector: Health Care | |
| SubSector: Drug Manufacturers - Major | |
| MarketCap: 203929 Millions | |
| Recent Price: 92.57 Smart Investing & Trading Score: 0 | |
| Day Percent Change: -0.55% Day Change: -0.51 | |
| Week Change: -1.02% Year-to-date Change: -8.3% | |
| NVS Links: Profile News Message Board | |
| Charts:- Daily , Weekly | |
| Add NVS to Watchlist: View: Get Complete NVS Trend Analysis ➞ | |
 | GENI Genius Sports Limited |
| Sector: Services & Goods | |
| SubSector: Internet Content & Information | |
| MarketCap: 1410 Millions | |
| Recent Price: 5.24 Smart Investing & Trading Score: 25 | |
| Day Percent Change: -0.57% Day Change: -0.03 | |
| Week Change: -1.87% Year-to-date Change: -15.8% | |
| GENI Links: Profile News Message Board | |
| Charts:- Daily , Weekly | |
| Add GENI to Watchlist: View: Get Complete GENI Trend Analysis ➞ | |
 | CSTM Constellium SE |
| Sector: Materials | |
| SubSector: Aluminum | |
| MarketCap: 646.608 Millions | |
| Recent Price: 20.61 Smart Investing & Trading Score: 31 | |
| Day Percent Change: -0.58% Day Change: -0.12 | |
| Week Change: -2.55% Year-to-date Change: 3.3% | |
| CSTM Links: Profile News Message Board | |
| Charts:- Daily , Weekly | |
| Add CSTM to Watchlist: View: Get Complete CSTM Trend Analysis ➞ | |
 | TEL TE Connectivity Ltd. |
| Sector: Technology | |
| SubSector: Diversified Electronics | |
| MarketCap: 20044.9 Millions | |
| Recent Price: 140.48 Smart Investing & Trading Score: 0 | |
| Day Percent Change: -0.71% Day Change: -1.00 | |
| Week Change: -1.75% Year-to-date Change: 0.0% | |
| TEL Links: Profile News Message Board | |
| Charts:- Daily , Weekly | |
| Add TEL to Watchlist: View: Get Complete TEL Trend Analysis ➞ | |
 | SAP SAP SE |
| Sector: Technology | |
| SubSector: Application Software | |
| MarketCap: 129635 Millions | |
| Recent Price: 178.64 Smart Investing & Trading Score: 36 | |
| Day Percent Change: -0.72% Day Change: -1.30 | |
| Week Change: -1.18% Year-to-date Change: 15.6% | |
| SAP Links: Profile News Message Board | |
| Charts:- Daily , Weekly | |
| Add SAP to Watchlist: View: Get Complete SAP Trend Analysis ➞ | |
 | OCS Oculis Holding AG |
| Sector: Health Care | |
| SubSector: Biotechnology | |
| MarketCap: 460 Millions | |
| Recent Price: 11.90 Smart Investing & Trading Score: 10 | |
| Day Percent Change: -0.75% Day Change: -0.09 | |
| Week Change: -0.46% Year-to-date Change: 7.2% | |
| OCS Links: Profile News Message Board | |
| Charts:- Daily , Weekly | |
| Add OCS to Watchlist: View: Get Complete OCS Trend Analysis ➞ | |
 | GSK GlaxoSmithKline plc |
| Sector: Health Care | |
| SubSector: Drug Manufacturers - Major | |
| MarketCap: 89428.2 Millions | |
| Recent Price: 39.27 Smart Investing & Trading Score: 13 | |
| Day Percent Change: -0.83% Day Change: -0.33 | |
| Week Change: -3.42% Year-to-date Change: 6.0% | |
| GSK Links: Profile News Message Board | |
| Charts:- Daily , Weekly | |
| Add GSK to Watchlist: View: Get Complete GSK Trend Analysis ➞ | |
 | AUTL Autolus Therapeutics plc |
| Sector: Health Care | |
| SubSector: Biotechnology | |
| MarketCap: 296.285 Millions | |
| Recent Price: 4.80 Smart Investing & Trading Score: 10 | |
| Day Percent Change: -0.83% Day Change: -0.04 | |
| Week Change: -4.38% Year-to-date Change: -25.5% | |
| AUTL Links: Profile News Message Board | |
| Charts:- Daily , Weekly | |
| Add AUTL to Watchlist: View: Get Complete AUTL Trend Analysis ➞ | |
 | PHG Koninklijke Philips N.V. |
| Sector: Technology | |
| SubSector: Electronic Equipment | |
| MarketCap: 32405.2 Millions | |
| Recent Price: 19.98 Smart Investing & Trading Score: 18 | |
| Day Percent Change: -0.84% Day Change: -0.17 | |
| Week Change: -0.4% Year-to-date Change: -14.4% | |
| PHG Links: Profile News Message Board | |
| Charts:- Daily , Weekly | |
| Add PHG to Watchlist: View: Get Complete PHG Trend Analysis ➞ | |
| For tabular summary view of above stock list: Summary View ➞ 0 - 25 , 25 - 50 , 50 - 75 , 75 - 100 , 100 - 125 , 125 - 150 | ||
| Click To Change The Sort Order: By Market Cap or Company Size Performance: Year-to-date, Week and Day | |
| Select Chart Type: | ||
|
Best Stocks Today 12Stocks.com |
© 2024 12Stocks.com Terms & Conditions Privacy Contact Us
All Information Provided Only For Education And Not To Be Used For Investing or Trading. See Terms & Conditions


One More Thing ... Get Best Stocks Delivered Daily!
Never Ever Miss A Move With Our Top Ten Stocks Lists
Find Best Stocks In Any Market - Bull or Bear Market
Take A Peek At Our Top Ten Stocks Lists: Daily, Weekly, Year-to-Date & Top Trends
Find Best Stocks In Any Market - Bull or Bear Market
Take A Peek At Our Top Ten Stocks Lists: Daily, Weekly, Year-to-Date & Top Trends
Europe Stocks With Best Up Trends [0-bearish to 100-bullish]: MYT Netherlands[93], NuCana [93], ADC [83], HSBC [81], WPP [80], Deutsche Bank[76], Bicycle [75], AstraZeneca [71], Fresenius Medical[70], Mynaric AG[69], Addex [68]
Best Europe Stocks Year-to-Date:
NuCana [1269.17%], Affimed N.V[711.2%], Addex [294.25%], ADC [186.75%], Renalytix AI[107.42%], MorphoSys AG[82.32%], NewAmsterdam Pharma[78.91%], Spotify [53.9%], Merus N.V[47.16%], Criteo S.A[35.7%], Bicycle [35.56%] Best Europe Stocks This Week:
NuCana [1708.84%], Mynaric AG[11.76%], Bicycle [9.91%], ADC [8.43%], Fresenius Medical[5.44%], MYT Netherlands[3.21%], Prudential [3.03%], Orange S.A[2.9%], Diageo [2.77%], Allied World[2.32%], NewAmsterdam Pharma[2.08%] Best Europe Stocks Daily:
VIA optronics[22.14%], Bicycle [12.33%], Addex [5.31%], Polestar Automotive[4.58%], Exscientia [3.82%], MYT Netherlands[3.77%], VTEX [3.30%], Atlantica Yield[3.28%], IHS Holding[2.73%], Telefonaktiebolaget LM[2.64%], Liberty Global[2.32%]