
 Login Sign Up


| |||||
 |  | ||||

| 12Stocks.com Market Intelligence |
Best Europe Stocks
|
On this page, you will find the most comprehensive analysis of European stocks and ETFs - from latest trends to performances to charts ➞. First, here are the year-to-date (YTD) performances of the most requested Europe stocks at 12Stocks.com (click stock for review):
| Deutsche Bank 118% | ||
| British American 59% | ||
| HSBC 48% | ||
| UBS 44% | ||
| Novartis AG 31% | ||
| ASML Holding 26% | ||
| GSK 22% | ||
| Astrazeneca 20% | ||
| BP 18% | ||
| Koninklijke Philips 17% | ||
| Fresenius Medical 15% | ||
| Sap SE 4% | ||
| ABB 0% | ||
| Credit Suisse 0% | ||
| LionShares U.S. 0% | ||
| Unilever 0% | ||
| Transocean -16% | ||
| Diageo -19% | ||
| In a hurry? Europe Stocks Lists: Performance Trends Table, Stock Charts
Sort Europe stocks: Daily, Weekly, Year-to-Date, Market Cap & Trends. Filter Europe stocks list by sector: Show all, Tech, Finance, Energy, Staples, Retail, Industrial, Materials, Utilities and HealthCare Filter Europe stocks list by size:All Europe Large Medium Small and MicroCap |
| 12Stocks.com Europe Stocks Performances & Trends Daily | |||||||||
|
|  The overall Smart Investing & Trading Score is 100 (0-bearish to 100-bullish) which puts Europe index in short term bullish trend. The Smart Investing & Trading Score from previous trading session is 80 and an improvement of trend continues.
| ||||||||
Here are the Smart Investing & Trading Scores of the most requested Europe stocks at 12Stocks.com (click stock name for detailed review):
|


| 12Stocks.com: Top Performing Europe Index Stocks | ||||||||||||||||||||||||||||||||||||||||||||||||
 The top performing Europe Index stocks year to date are
Now, more recently, over last week, the top performing Europe Index stocks on the move are


|
||||||||||||||||||||||||||||||||||||||||||||||||
| 12Stocks.com: Investing in Europe Index with Stocks | |
|
The following table helps investors and traders sort through current performance and trends (as measured by Smart Investing & Trading Score) of various
stocks in the Europe Index. Quick View: Move mouse or cursor over stock symbol (ticker) to view short-term technical chart and over stock name to view long term chart. Click on  to add stock symbol to your watchlist and to add stock symbol to your watchlist and  to view watchlist. Click on any ticker or stock name for detailed market intelligence report for that stock. to view watchlist. Click on any ticker or stock name for detailed market intelligence report for that stock. |
12Stocks.com Performance of Stocks in Europe Index
| Ticker | Stock Name | Watchlist | Category | Recent Price | Smart Investing & Trading Score | Change % | Weekly Change% |
| CS | Credit Suisse |   | Financials | 561.08 | 70 | 0.89% | 63,241.60% |
| MNK | Mallkrodt | | Health Care | 45.94 | 80 | -0.20% | 11,382.10% |
| YNDX | Yandex N.V | | Technology | 574.88 | 70 | -0.12% | 2,935.27% |
| QTNT | Quotient | | Health Care | 0.80 | 60 | -17.53% | 1,782.35% |
| WFT | Weatherford | | Energy | 333.71 | 100 | 1.51% | 461.52% |
| RDS.B | ROYAL DTCH | | Energy | 170.03 | 70 | 0.57% | 232.81% |
| CBI | Chicago Bridge | | Industrials | 480.66 | 80 | 0.42% | 205.47% |
| AAAP | Advanced Accelerator | | Health Care | 220.09 | 70 | -0.33% | 82.72% |
| SDLP | Seadrill Partners | | Energy | 47.96 | 100 | 1.61% | 56.12% |
| RDS.A | ROYAL DTCH | | Energy | 76.42 | 80 | 0.45% | 49.52% |
| ESV | Ensco | | Energy | 153.62 | 100 | 0.71% | 45.94% |
| CNTA | Centessa | | Health Care | 22.02 | 60 | 0.96% | 39.46% |
| EVTL | Vertical Aerospace | | Industrials | 5.38 | 70 | 1.32% | 19.29% |
| ARQQ | Arqit Quantum | | Technology | 33.16 | 70 | -1.63% | 19.07% |
| ECX | ECARX | | Services & Goods | 1.82 | 90 | 4.00% | 18.18% |
| WPPGY | WPP | | Services & Goods | 138.71 | 90 | 0.82% | 14.61% |
| KORS | Michael Kors | | Services & Goods | 52.27 | 80 | -0.19% | 12.72% |
| AU | AngloGold Ashanti | | Materials | 67.10 | 100 | 1.19% | 12.26% |
| GNFT | Genfit ADR | | Health Care | 4.33 | 100 | 2.00% | 11.66% |
| CLLS | Cellectis ADR | | Health Care | 2.99 | 50 | 3.46% | 11.57% |
| VIP | VEON | | Technology | 12100.00 | 80 | 2.11% | 10.50% |
| JMIA | Jumia | | Services & Goods | 9.79 | 80 | -1.21% | 10.50% |
| KNOP | KNOT Offshore | | Energy | 8.95 | 90 | 4.07% | 10.49% |
| FCAU | Fiat Chrysler | | Consumer Staples | 191.51 | 70 | -0.70% | 10.39% |
| ASML | ASML Holding | | Technology | 875.34 | 100 | 0.93% | 9.93% |
| For chart view version of above stock list: Chart View ➞ 0 - 25 , 25 - 50 , 50 - 75 , 75 - 100 , 100 - 125 , 125 - 150 , 150 - 175 , 175 - 200 | ||
 | Click To Change The Sort Order: By Market Cap or Company Size Performance: Year-to-date, Week and Day |  |
|
Get the most comprehensive stock market coverage daily at 12Stocks.com ➞ Best Stocks Today ➞ Best Stocks Weekly ➞ Best Stocks Year-to-Date ➞ Best Stocks Trends ➞  Best Stocks Today 12Stocks.com Best Nasdaq Stocks ➞ Best S&P 500 Stocks ➞ Best Tech Stocks ➞ Best Biotech Stocks ➞ |
| Detailed Overview of Europe Stocks |
| Europe Technical Overview, Leaders & Laggards, Top Europe ETF Funds & Detailed Europe Stocks List, Charts, Trends & More |
| Europe: Technical Analysis, Trends & YTD Performance | |
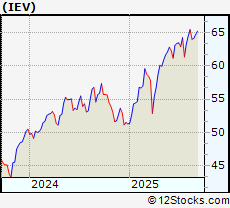
 IEV Weekly Chart |
|
| Long Term Trend: Very Good | |
| Medium Term Trend: Very Good | |
 IEV Daily Chart |
|
| Short Term Trend: Very Good | |
| Overall Trend Score: 100 | |
| YTD Performance: 28.1186% | |
| **Trend Scores & Views Are Only For Educational Purposes And Not For Investing | |
| 12Stocks.com: Investing in Europe Index using Exchange Traded Funds | |
|
The following table shows list of key exchange traded funds (ETF) that
help investors play Europe stock market. For detailed view, check out our ETF Funds section of our website. Quick View: Move mouse or cursor over ETF symbol (ticker) to view short-term technical chart and over ETF name to view long term chart. Click on ticker or stock name for detailed view. Click on to add stock symbol to your watchlist and to view watchlist. |
12Stocks.com List of ETFs that track Europe Index
| Ticker | ETF Name | Watchlist | Recent Price | Smart Investing & Trading Score | Change % | Week % | Year-to-date % |
| FEU | Europe 50 | | 50.11 | 90 | 1.54002 | 4.63562 | 26.3171% |
| EUSC | Europe Hedged SmallCap | | 48.87 | 90 | 2.52507 | 4.7807 | 28.0278% |
| QESP | Spain StrategicFactors | | 38.26 | 36 | 0 | 9999 | NA |
| 12Stocks.com: Charts, Trends, Fundamental Data and Performances of Europe Stocks | |
|
We now take in-depth look at all Europe stocks including charts, multi-period performances and overall trends (as measured by Smart Investing & Trading Score). One can sort Europe stocks (click link to choose) by Daily, Weekly and by Year-to-Date performances. Also, one can sort by size of the company or by market capitalization. |
| Select Your Default Chart Type: | |||||
| |||||
| Click on stock symbol or name for detailed view. Click on to add stock symbol to your watchlist and to view watchlist. Quick View: Move mouse or cursor over "Daily" to quickly view daily technical stock chart and over "Weekly" to view weekly technical stock chart. | |||||

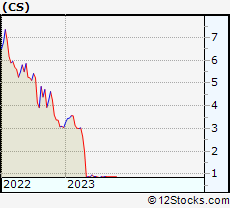 | CS Credit Suisse Group AG |
| Sector: Financials | |
| SubSector: Foreign Money Center Banks | |
| MarketCap: 21692.4 Millions | |
| Recent Price: 561.08 Smart Investing & Trading Score: 70 | |
| Day Percent Change: 0.886451% Day Change: -9999 | |
| Week Change: 63241.6% Year-to-date Change: 0.0% | |
| CS Links: Profile News Message Board | |
| Charts:- Daily , Weekly | |
| Add CS to Watchlist: View: Get Complete CS Trend Analysis ➞ | |
 | MNK Mallinckrodt plc |
| Sector: Health Care | |
| SubSector: Drugs - Generic | |
| MarketCap: 133.085 Millions | |
| Recent Price: 45.94 Smart Investing & Trading Score: 80 | |
| Day Percent Change: -0.195525% Day Change: -9999 | |
| Week Change: 11382.1% Year-to-date Change: 0.0% | |
| MNK Links: Profile News Message Board | |
| Charts:- Daily , Weekly | |
| Add MNK to Watchlist: View: Get Complete MNK Trend Analysis ➞ | |
 | YNDX Yandex N.V. |
| Sector: Technology | |
| SubSector: Internet Information Providers | |
| MarketCap: 11018 Millions | |
| Recent Price: 574.88 Smart Investing & Trading Score: 70 | |
| Day Percent Change: -0.118146% Day Change: -9999 | |
| Week Change: 2935.27% Year-to-date Change: 0.0% | |
| YNDX Links: Profile News Message Board | |
| Charts:- Daily , Weekly | |
| Add YNDX to Watchlist: View: Get Complete YNDX Trend Analysis ➞ | |
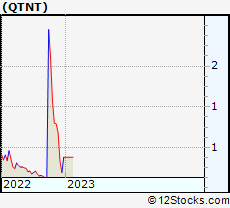 | QTNT Quotient Limited |
| Sector: Health Care | |
| SubSector: Diagnostic Substances | |
| MarketCap: 309.171 Millions | |
| Recent Price: 0.80 Smart Investing & Trading Score: 60 | |
| Day Percent Change: -17.5258% Day Change: -9999 | |
| Week Change: 1782.35% Year-to-date Change: 0.0% | |
| QTNT Links: Profile News Message Board | |
| Charts:- Daily , Weekly | |
| Add QTNT to Watchlist: View: Get Complete QTNT Trend Analysis ➞ | |
 | WFT Weatherford International plc |
| Sector: Energy | |
| SubSector: Oil & Gas Equipment & Services | |
| MarketCap: 6023.9 Millions | |
| Recent Price: 333.71 Smart Investing & Trading Score: 100 | |
| Day Percent Change: 1.50875% Day Change: -9999 | |
| Week Change: 461.518% Year-to-date Change: 0.0% | |
| WFT Links: Profile News Message Board | |
| Charts:- Daily , Weekly | |
| Add WFT to Watchlist: View: Get Complete WFT Trend Analysis ➞ | |
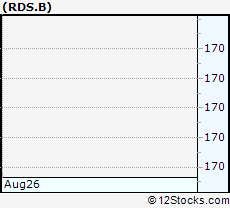 | RDS.B ROYAL DTCH SH-B |
| Sector: Energy | |
| SubSector: Integrated | |
| MarketCap: 273890 Millions | |
| Recent Price: 170.03 Smart Investing & Trading Score: 70 | |
| Day Percent Change: 0.573761% Day Change: -9999 | |
| Week Change: 232.805% Year-to-date Change: 0.0% | |
| RDS.B Links: Profile News Message Board | |
| Charts:- Daily , Weekly | |
| Add RDS.B to Watchlist: View: Get Complete RDS.B Trend Analysis ➞ | |
 | CBI Chicago Bridge & Iron Company N.V. |
| Sector: Industrials | |
| SubSector: General Contractors | |
| MarketCap: 3057.36 Millions | |
| Recent Price: 480.66 Smart Investing & Trading Score: 80 | |
| Day Percent Change: 0.415735% Day Change: -9999 | |
| Week Change: 205.472% Year-to-date Change: 0.0% | |
| CBI Links: Profile News Message Board | |
| Charts:- Daily , Weekly | |
| Add CBI to Watchlist: View: Get Complete CBI Trend Analysis ➞ | |
 | AAAP Advanced Accelerator Applications S.A. |
| Sector: Health Care | |
| SubSector: Diagnostic Substances | |
| MarketCap: 1599.73 Millions | |
| Recent Price: 220.09 Smart Investing & Trading Score: 70 | |
| Day Percent Change: -0.330586% Day Change: -9999 | |
| Week Change: 82.7231% Year-to-date Change: 0.0% | |
| AAAP Links: Profile News Message Board | |
| Charts:- Daily , Weekly | |
| Add AAAP to Watchlist: View: Get Complete AAAP Trend Analysis ➞ | |
 | SDLP Seadrill Partners LLC |
| Sector: Energy | |
| SubSector: Oil & Gas Drilling & Exploration | |
| MarketCap: 303.04 Millions | |
| Recent Price: 47.96 Smart Investing & Trading Score: 100 | |
| Day Percent Change: 1.61017% Day Change: -9999 | |
| Week Change: 56.1198% Year-to-date Change: 0.0% | |
| SDLP Links: Profile News Message Board | |
| Charts:- Daily , Weekly | |
| Add SDLP to Watchlist: View: Get Complete SDLP Trend Analysis ➞ | |
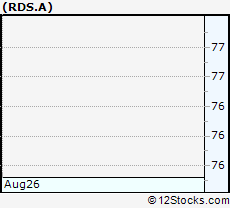 | RDS.A ROYAL DTCH SH-A |
| Sector: Energy | |
| SubSector: Integrated | |
| MarketCap: 281101 Millions | |
| Recent Price: 76.42 Smart Investing & Trading Score: 80 | |
| Day Percent Change: 0.446898% Day Change: -9999 | |
| Week Change: 49.5206% Year-to-date Change: 0.0% | |
| RDS.A Links: Profile News Message Board | |
| Charts:- Daily , Weekly | |
| Add RDS.A to Watchlist: View: Get Complete RDS.A Trend Analysis ➞ | |
 | ESV Ensco plc |
| Sector: Energy | |
| SubSector: Oil & Gas Drilling & Exploration | |
| MarketCap: 2593.33 Millions | |
| Recent Price: 153.62 Smart Investing & Trading Score: 100 | |
| Day Percent Change: 0.708011% Day Change: -9999 | |
| Week Change: 45.9434% Year-to-date Change: 0.0% | |
| ESV Links: Profile News Message Board | |
| Charts:- Daily , Weekly | |
| Add ESV to Watchlist: View: Get Complete ESV Trend Analysis ➞ | |
 | CNTA Centessa Pharmaceuticals plc ADR |
| Sector: Health Care | |
| SubSector: Biotechnology | |
| MarketCap: 2106.4 Millions | |
| Recent Price: 22.02 Smart Investing & Trading Score: 60 | |
| Day Percent Change: 0.962861% Day Change: 0.25 | |
| Week Change: 39.4554% Year-to-date Change: 25.8% | |
| CNTA Links: Profile News Message Board | |
| Charts:- Daily , Weekly | |
| Add CNTA to Watchlist: View: Get Complete CNTA Trend Analysis ➞ | |
 | EVTL Vertical Aerospace Ltd |
| Sector: Industrials | |
| SubSector: Aerospace & Defense | |
| MarketCap: 445.68 Millions | |
| Recent Price: 5.38 Smart Investing & Trading Score: 70 | |
| Day Percent Change: 1.31827% Day Change: 0.05 | |
| Week Change: 19.2905% Year-to-date Change: -50.7% | |
| EVTL Links: Profile News Message Board | |
| Charts:- Daily , Weekly | |
| Add EVTL to Watchlist: View: Get Complete EVTL Trend Analysis ➞ | |
 | ARQQ Arqit Quantum Inc |
| Sector: Technology | |
| SubSector: Software - Infrastructure | |
| MarketCap: 399.78 Millions | |
| Recent Price: 33.16 Smart Investing & Trading Score: 70 | |
| Day Percent Change: -1.63156% Day Change: -0.71 | |
| Week Change: 19.0664% Year-to-date Change: -12.8% | |
| ARQQ Links: Profile News Message Board | |
| Charts:- Daily , Weekly | |
| Add ARQQ to Watchlist: View: Get Complete ARQQ Trend Analysis ➞ | |
 | ECX ECARX Holdings Inc |
| Sector: Services & Goods | |
| SubSector: Auto Parts | |
| MarketCap: 575.54 Millions | |
| Recent Price: 1.82 Smart Investing & Trading Score: 90 | |
| Day Percent Change: 4% Day Change: 0.03 | |
| Week Change: 18.1818% Year-to-date Change: -9.9% | |
| ECX Links: Profile News Message Board | |
| Charts:- Daily , Weekly | |
| Add ECX to Watchlist: View: Get Complete ECX Trend Analysis ➞ | |
 | WPPGY WPP plc |
| Sector: Services & Goods | |
| SubSector: Advertising Agencies | |
| MarketCap: 27094.4 Millions | |
| Recent Price: 138.71 Smart Investing & Trading Score: 90 | |
| Day Percent Change: 0.82134% Day Change: -9999 | |
| Week Change: 14.6079% Year-to-date Change: 0.0% | |
| WPPGY Links: Profile News Message Board | |
| Charts:- Daily , Weekly | |
| Add WPPGY to Watchlist: View: Get Complete WPPGY Trend Analysis ➞ | |
 | KORS Michael Kors Holdings Limited |
| Sector: Services & Goods | |
| SubSector: Textile - Apparel Clothing | |
| MarketCap: 6044.68 Millions | |
| Recent Price: 52.27 Smart Investing & Trading Score: 80 | |
| Day Percent Change: -0.190949% Day Change: -9999 | |
| Week Change: 12.7237% Year-to-date Change: 0.0% | |
| KORS Links: Profile News Message Board | |
| Charts:- Daily , Weekly | |
| Add KORS to Watchlist: View: Get Complete KORS Trend Analysis ➞ | |
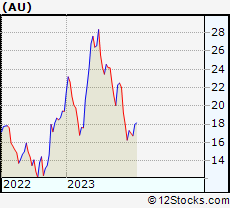 | AU AngloGold Ashanti Plc |
| Sector: Materials | |
| SubSector: Gold | |
| MarketCap: 30095.8 Millions | |
| Recent Price: 67.10 Smart Investing & Trading Score: 100 | |
| Day Percent Change: 1.19137% Day Change: 1.11 | |
| Week Change: 12.2637% Year-to-date Change: 182.5% | |
| AU Links: Profile News Message Board | |
| Charts:- Daily , Weekly | |
| Add AU to Watchlist: View: Get Complete AU Trend Analysis ➞ | |
 | GNFT Genfit ADR |
| Sector: Health Care | |
| SubSector: Biotechnology | |
| MarketCap: 196.21 Millions | |
| Recent Price: 4.33 Smart Investing & Trading Score: 100 | |
| Day Percent Change: 2.00334% Day Change: -0.2 | |
| Week Change: 11.6609% Year-to-date Change: 13.1% | |
| GNFT Links: Profile News Message Board | |
| Charts:- Daily , Weekly | |
| Add GNFT to Watchlist: View: Get Complete GNFT Trend Analysis ➞ | |
 | CLLS Cellectis ADR |
| Sector: Health Care | |
| SubSector: Biotechnology | |
| MarketCap: 193.2 Millions | |
| Recent Price: 2.99 Smart Investing & Trading Score: 50 | |
| Day Percent Change: 3.46021% Day Change: -0.05 | |
| Week Change: 11.5672% Year-to-date Change: 65.2% | |
| CLLS Links: Profile News Message Board | |
| Charts:- Daily , Weekly | |
| Add CLLS to Watchlist: View: Get Complete CLLS Trend Analysis ➞ | |
 | VIP VEON Ltd. |
| Sector: Technology | |
| SubSector: Wireless Communications | |
| MarketCap: 7220.76 Millions | |
| Recent Price: 12100.00 Smart Investing & Trading Score: 80 | |
| Day Percent Change: 2.1097% Day Change: -9999 | |
| Week Change: 10.5023% Year-to-date Change: 0.0% | |
| VIP Links: Profile News Message Board | |
| Charts:- Daily , Weekly | |
| Add VIP to Watchlist: View: Get Complete VIP Trend Analysis ➞ | |
 | JMIA Jumia Technologies Ag ADR |
| Sector: Services & Goods | |
| SubSector: Internet Retail | |
| MarketCap: 1085 Millions | |
| Recent Price: 9.79 Smart Investing & Trading Score: 80 | |
| Day Percent Change: -1.2109% Day Change: -0.08 | |
| Week Change: 10.4966% Year-to-date Change: 151.0% | |
| JMIA Links: Profile News Message Board | |
| Charts:- Daily , Weekly | |
| Add JMIA to Watchlist: View: Get Complete JMIA Trend Analysis ➞ | |
 | KNOP KNOT Offshore Partners LP |
| Sector: Energy | |
| SubSector: Oil & Gas Midstream | |
| MarketCap: 283 Millions | |
| Recent Price: 8.95 Smart Investing & Trading Score: 90 | |
| Day Percent Change: 4.06977% Day Change: 0.25 | |
| Week Change: 10.4938% Year-to-date Change: 53.8% | |
| KNOP Links: Profile News Message Board | |
| Charts:- Daily , Weekly | |
| Add KNOP to Watchlist: View: Get Complete KNOP Trend Analysis ➞ | |
 | FCAU Fiat Chrysler Automobiles N.V. |
| Sector: Consumer Staples | |
| SubSector: Auto Manufacturers - Major | |
| MarketCap: 9953.71 Millions | |
| Recent Price: 191.51 Smart Investing & Trading Score: 70 | |
| Day Percent Change: -0.69999% Day Change: -9999 | |
| Week Change: 10.3931% Year-to-date Change: 0.0% | |
| FCAU Links: Profile News Message Board | |
| Charts:- Daily , Weekly | |
| Add FCAU to Watchlist: View: Get Complete FCAU Trend Analysis ➞ | |
 | ASML ASML Holding NV |
| Sector: Technology | |
| SubSector: Semiconductor Equipment & Materials | |
| MarketCap: 307427 Millions | |
| Recent Price: 875.34 Smart Investing & Trading Score: 100 | |
| Day Percent Change: 0.927015% Day Change: 8.04 | |
| Week Change: 9.93281% Year-to-date Change: 25.9% | |
| ASML Links: Profile News Message Board | |
| Charts:- Daily , Weekly | |
| Add ASML to Watchlist: View: Get Complete ASML Trend Analysis ➞ | |
| For tabular summary view of above stock list: Summary View ➞ 0 - 25 , 25 - 50 , 50 - 75 , 75 - 100 , 100 - 125 , 125 - 150 , 150 - 175 , 175 - 200 | ||
| Click To Change The Sort Order: By Market Cap or Company Size Performance: Year-to-date, Week and Day | |
| Select Chart Type: | ||
|
Best Stocks Today 12Stocks.com |
© 2025 12Stocks.com Terms & Conditions Privacy Contact Us
All Information Provided Only For Education And Not To Be Used For Investing or Trading. See Terms & Conditions


One More Thing ... Get Best Stocks Delivered Daily!
Never Ever Miss A Move With Our Top Ten Stocks Lists
Find Best Stocks In Any Market - Bull or Bear Market
Take A Peek At Our Top Ten Stocks Lists: Daily, Weekly, Year-to-Date & Top Trends
Find Best Stocks In Any Market - Bull or Bear Market
Take A Peek At Our Top Ten Stocks Lists: Daily, Weekly, Year-to-Date & Top Trends
Europe Stocks With Best Up Trends [0-bearish to 100-bullish]: Lloyds Banking[100], Rio Tinto[100], Genfit ADR[100], Seadrill Partners[100], Weatherford [100], ING Groep[100], AngloGold Ashanti[100], HSBC [100], ASML Holding[100], Prudential [100], Ensco [100]
Best Europe Stocks Year-to-Date:
Nanobiotix ADR[221.372%], ATAI Life[190.625%], AngloGold Ashanti[182.467%], DBV [175.877%], Jumia [151.026%], Tiziana Life[149.706%], Inventiva ADR[148.131%], IHS Holding[125.472%], Verona Pharma[120.685%], Deutsche Bank[117.943%], Super [104.4%] Best Europe Stocks This Week:
Credit Suisse[63241.6%], Yandex N.V[2935.27%], Quotient [1782.35%], Weatherford [461.518%], ROYAL DTCH[232.805%], Chicago Bridge[205.472%], Advanced Accelerator[82.7231%], Seadrill Partners[56.1198%], ROYAL DTCH[49.5206%], Ensco [45.9434%], Centessa [39.4554%] Best Europe Stocks Daily:
Capri [5.96577%], Silence [4.87805%], NovoCure [4.69136%], Polestar Automotive[4.69%], ST Microelectronics[4.12968%], KNOT Offshore[4.06977%], ECARX [4%], Innate Pharma[3.805%], Cellectis ADR[3.46021%], Torm [2.92553%], CRISPR [2.80839%]