
 Login Sign Up


| |||||
 |  | ||||

| 12Stocks.com Market Intelligence |
Best Consumer Services Stocks
| In a hurry? Services & Goods Stocks: Performance Trends Table, Stock Charts
Sort Consumer Services: Daily, Weekly, Year-to-Date, Market Cap & Trends. Filter Services & Goods stocks list by size: All Large Mid-Range Small |
| 12Stocks.com Consumer Services Stocks Performances & Trends Daily | |||||||||
|
|  The overall Smart Investing & Trading Score is 100 (0-bearish to 100-bullish) which puts Consumer Services sector in short term bullish trend. The Smart Investing & Trading Score from previous trading session is 50 and an improvement of trend continues.
| ||||||||
Here are the Smart Investing & Trading Scores of the most requested Consumer Services stocks at 12Stocks.com (click stock name for detailed review):
|


| Consider signing up for our daily 12Stocks.com "Best Stocks Newsletter". You will never ever miss a big stock move again! |
| 12Stocks.com: Investing in Consumer Services sector with Stocks | |
|
The following table helps investors and traders sort through current performance and trends (as measured by Smart Investing & Trading Score) of various
stocks in the Consumer Services sector. Quick View: Move mouse or cursor over stock symbol (ticker) to view short-term Technical chart and over stock name to view long term chart. Click on  to add stock symbol to your watchlist and to add stock symbol to your watchlist and  to view watchlist. Click on any ticker or stock name for detailed market intelligence report for that stock. to view watchlist. Click on any ticker or stock name for detailed market intelligence report for that stock. |
12Stocks.com Performance of Stocks in Consumer Services Sector
| Ticker | Stock Name | Watchlist | Category | Recent Price | Smart Investing & Trading Score | Change % | YTD Change% |
| RT | Ruby Tuesday |   | Restaurants | 19.14 | 0 | 1.54% | 0.00% |
| TCS | Container Store | | Retail | 2.65 | 60 | 22.69% | 0.00% |
| LAKE | Lakeland Industries | | Apparel Manufacturing | 14.49 | 60 | -0.96% | -43.70% |
| DLTH | Duluth | | Apparel Retail | 3.87 | 90 | 6.91% | 32.53% |
| CLAR | Clarus Corp | | Leisure | 3.83 | 60 | 0.26% | -14.40% |
| ROIAK | Radio One | | Broadcasting | 2.55 | 0 | -3.77% | 0.00% |
| VRM | Vroom | | Auto & Truck Dealerships | 28.59 | 70 | 5.89% | 455.15% |
| RUTH | Ruth s | | Restaurants | 0.97 | 0 | -1.02% | 0.00% |
| VIRC | Virco | | Furnishings, Fixtures & Appliances | 7.97 | 20 | -3.04% | -21.26% |
| GHG | GreenTree Hospitality | | Lodging | 2.18 | 90 | -2.79% | -13.83% |
| CAAS | China Automotive | | Auto Parts | 4.40 | 60 | -4.14% | 7.84% |
| SRSC | Sears Canada | | Department | 1.02 | 10 | 0.99% | 0.00% |
| SPWH | Sportsman's Warehouse | | Specialty Retail | 3.06 | 60 | 0.66% | 19.07% |
| CMLS | Cumulus Media | | Broadcasting | 0.16 | 40 | -2.81% | -78.70% |
| QRTEB | Qurate Retail | | Retail | 2.00 | 10 | -0.99% | -29.08% |
| FLL | Full House | | Casinos | 3.49 | 40 | 5.12% | -24.46% |
| PRPL | Purple Innovation | | Furnishings, Fixtures & Appliances | 1.05 | 30 | 0.00% | 40.17% |
| YUME | YuMe | | Advertising | 8.26 | 50 | 1.35% | 0.00% |
| PLCE | Childrens Place | | Apparel Manufacturing | 7.19 | 60 | 3.01% | -31.20% |
| KNDI | Kandi Technologies | | Recreational | 1.37 | 60 | 0.00% | 25.69% |
| HOFT | Hooker Furnishings | | Furnishings, Fixtures & Appliances | 10.00 | 40 | -3.29% | -22.75% |
| EXPR | Express | | Apparel | 23.97 | 100 | 2.30% | 0.00% |
| RRGB | Red Robin | | Restaurants | 6.76 | 80 | 0.30% | 19.22% |
| VIOT | Viomi Technology | | Furnishings, Fixtures & Appliances | 3.42 | 60 | -3.39% | 130.06% |
| WTRH | Waitr | | Restaurants | 1.82 | 20 | 0.00% | 0.00% |
| For chart view version of above stock list: Chart View ➞ 0 - 25 , 25 - 50 , 50 - 75 , 75 - 100 , 100 - 125 , 125 - 150 , 150 - 175 , 175 - 200 , 200 - 225 , 225 - 250 , 250 - 275 , 275 - 300 , 300 - 325 , 325 - 350 , 350 - 375 , 375 - 400 , 400 - 425 , 425 - 450 , 450 - 475 , 475 - 500 , 500 - 525 , 525 - 550 , 550 - 575 , 575 - 600 , 600 - 625 | ||
 | Click To Change The Sort Order: By Market Cap or Company Size Performance: Year-to-date, Week and Day |  |
|
Get the most comprehensive stock market coverage daily at 12Stocks.com ➞ Best Stocks Today ➞ Best Stocks Weekly ➞ Best Stocks Year-to-Date ➞ Best Stocks Trends ➞  Best Stocks Today 12Stocks.com Best Nasdaq Stocks ➞ Best S&P 500 Stocks ➞ Best Tech Stocks ➞ Best Biotech Stocks ➞ |
| Detailed Overview of Consumer Services Stocks |
| Consumer Services Technical Overview, Leaders & Laggards, Top Consumer Services ETF Funds & Detailed Consumer Services Stocks List, Charts, Trends & More |
| Consumer Services Sector: Technical Analysis, Trends & YTD Performance | |
| Consumer Services sector is composed of stocks
from retail, entertainment, media/publishing, consumer goods
and services subsectors. Consumer Services sector, as represented by XLY, an exchange-traded fund [ETF] that holds basket of Consumer Services stocks (e.g, Walmart, Alibaba) is up by 9.2482% and is currently underperforming the overall market by -4.1526% year-to-date. Below is a quick view of Technical charts and trends: |
|
 XLY Weekly Chart |
|
| Long Term Trend: Very Good | |
| Medium Term Trend: Good | |
 XLY Daily Chart |
|
| Short Term Trend: Very Good | |
| Overall Trend Score: 100 | |
| YTD Performance: 9.2482% | |
| **Trend Scores & Views Are Only For Educational Purposes And Not For Investing | |
| 12Stocks.com: Top Performing Consumer Services Sector Stocks | ||||||||||||||||||||||||||||||||||||||||||||||||
 The top performing Consumer Services sector stocks year to date are
Now, more recently, over last week, the top performing Consumer Services sector stocks on the move are


|
||||||||||||||||||||||||||||||||||||||||||||||||
| 12Stocks.com: Investing in Consumer Services Sector using Exchange Traded Funds | |
|
The following table shows list of key exchange traded funds (ETF) that
help investors track Consumer Services Index. For detailed view, check out our ETF Funds section of our website. Quick View: Move mouse or cursor over ETF symbol (ticker) to view short-term Technical chart and over ETF name to view long term chart. Click on ticker or stock name for detailed view. Click on to add stock symbol to your watchlist and to view watchlist. |
12Stocks.com List of ETFs that track Consumer Services Index
| Ticker | ETF Name | Watchlist | Recent Price | Smart Investing & Trading Score | Change % | Week % | Year-to-date % |
| PMR | Retail | | 40.96 | 70 | -0.0244081 | 2.86288 | 0% |
| 12Stocks.com: Charts, Trends, Fundamental Data and Performances of Consumer Services Stocks | |
|
We now take in-depth look at all Consumer Services stocks including charts, multi-period performances and overall trends (as measured by Smart Investing & Trading Score). One can sort Consumer Services stocks (click link to choose) by Daily, Weekly and by Year-to-Date performances. Also, one can sort by size of the company or by market capitalization. |
| Select Your Default Chart Type: | |||||
| |||||
| Click on stock symbol or name for detailed view. Click on to add stock symbol to your watchlist and to view watchlist. Quick View: Move mouse or cursor over "Daily" to quickly view daily Technical stock chart and over "Weekly" to view weekly Technical stock chart. | |||||

 | RT Ruby Tuesday, Inc. |
| Sector: Services & Goods | |
| SubSector: Restaurants | |
| MarketCap: 142.74 Millions | |
| Recent Price: 19.14 Smart Investing & Trading Score: 0 | |
| Day Percent Change: 1.53846% Day Change: -9999 | |
| Week Change: -5.76071% Year-to-date Change: 0.0% | |
| RT Links: Profile News Message Board | |
| Charts:- Daily , Weekly | |
| Add RT to Watchlist: View: Get Complete RT Trend Analysis ➞ | |
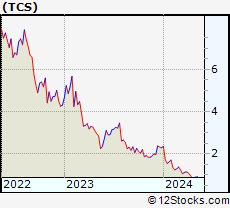 | TCS The Container Store Group, Inc. |
| Sector: Services & Goods | |
| SubSector: Specialty Retail, Other | |
| MarketCap: 142.644 Millions | |
| Recent Price: 2.65 Smart Investing & Trading Score: 60 | |
| Day Percent Change: 22.6852% Day Change: -9999 | |
| Week Change: -24.2857% Year-to-date Change: 0.0% | |
| TCS Links: Profile News Message Board | |
| Charts:- Daily , Weekly | |
| Add TCS to Watchlist: View: Get Complete TCS Trend Analysis ➞ | |
 | LAKE Lakeland Industries, Inc |
| Sector: Services & Goods | |
| SubSector: Apparel Manufacturing | |
| MarketCap: 142.53 Millions | |
| Recent Price: 14.49 Smart Investing & Trading Score: 60 | |
| Day Percent Change: -0.956938% Day Change: -0.27 | |
| Week Change: -3.27103% Year-to-date Change: -43.7% | |
| LAKE Links: Profile News Message Board | |
| Charts:- Daily , Weekly | |
| Add LAKE to Watchlist: View: Get Complete LAKE Trend Analysis ➞ | |
 | DLTH Duluth Holdings Inc |
| Sector: Services & Goods | |
| SubSector: Apparel Retail | |
| MarketCap: 142.42 Millions | |
| Recent Price: 3.87 Smart Investing & Trading Score: 90 | |
| Day Percent Change: 6.90608% Day Change: -0.03 | |
| Week Change: 2.11082% Year-to-date Change: 32.5% | |
| DLTH Links: Profile News Message Board | |
| Charts:- Daily , Weekly | |
| Add DLTH to Watchlist: View: Get Complete DLTH Trend Analysis ➞ | |
 | CLAR Clarus Corp |
| Sector: Services & Goods | |
| SubSector: Leisure | |
| MarketCap: 140.55 Millions | |
| Recent Price: 3.83 Smart Investing & Trading Score: 60 | |
| Day Percent Change: 0.26178% Day Change: 0.01 | |
| Week Change: 4.64481% Year-to-date Change: -14.4% | |
| CLAR Links: Profile News Message Board | |
| Charts:- Daily , Weekly | |
| Add CLAR to Watchlist: View: Get Complete CLAR Trend Analysis ➞ | |
 | ROIAK Radio One, Inc. |
| Sector: Services & Goods | |
| SubSector: Broadcasting - Radio | |
| MarketCap: 140.13 Millions | |
| Recent Price: 2.55 Smart Investing & Trading Score: 0 | |
| Day Percent Change: -3.77358% Day Change: -9999 | |
| Week Change: -17.7419% Year-to-date Change: 0.0% | |
| ROIAK Links: Profile News Message Board | |
| Charts:- Daily , Weekly | |
| Add ROIAK to Watchlist: View: Get Complete ROIAK Trend Analysis ➞ | |
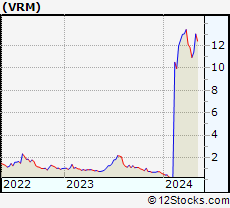 | VRM Vroom Inc |
| Sector: Services & Goods | |
| SubSector: Auto & Truck Dealerships | |
| MarketCap: 140.13 Millions | |
| Recent Price: 28.59 Smart Investing & Trading Score: 70 | |
| Day Percent Change: 5.88889% Day Change: 1 | |
| Week Change: 0.315789% Year-to-date Change: 455.1% | |
| VRM Links: Profile News Message Board | |
| Charts:- Daily , Weekly | |
| Add VRM to Watchlist: View: Get Complete VRM Trend Analysis ➞ | |
 | RUTH Ruth s Hospitality Group, Inc. |
| Sector: Services & Goods | |
| SubSector: Restaurants | |
| MarketCap: 138.97 Millions | |
| Recent Price: 0.97 Smart Investing & Trading Score: 0 | |
| Day Percent Change: -1.02041% Day Change: -9999 | |
| Week Change: -95.4863% Year-to-date Change: 0.0% | |
| RUTH Links: Profile News Message Board | |
| Charts:- Daily , Weekly | |
| Add RUTH to Watchlist: View: Get Complete RUTH Trend Analysis ➞ | |
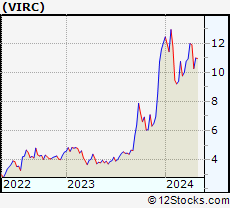 | VIRC Virco Manufacturing Corp |
| Sector: Services & Goods | |
| SubSector: Furnishings, Fixtures & Appliances | |
| MarketCap: 138.81 Millions | |
| Recent Price: 7.97 Smart Investing & Trading Score: 20 | |
| Day Percent Change: -3.04136% Day Change: 0 | |
| Week Change: -8.07382% Year-to-date Change: -21.3% | |
| VIRC Links: Profile News Message Board | |
| Charts:- Daily , Weekly | |
| Add VIRC to Watchlist: View: Get Complete VIRC Trend Analysis ➞ | |
 | GHG GreenTree Hospitality Group Ltd ADR |
| Sector: Services & Goods | |
| SubSector: Lodging | |
| MarketCap: 134.19 Millions | |
| Recent Price: 2.18 Smart Investing & Trading Score: 90 | |
| Day Percent Change: -2.78707% Day Change: 0 | |
| Week Change: 8.45771% Year-to-date Change: -13.8% | |
| GHG Links: Profile News Message Board | |
| Charts:- Daily , Weekly | |
| Add GHG to Watchlist: View: Get Complete GHG Trend Analysis ➞ | |
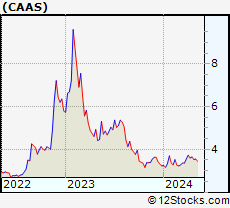 | CAAS China Automotive Systems Inc |
| Sector: Services & Goods | |
| SubSector: Auto Parts | |
| MarketCap: 133.96 Millions | |
| Recent Price: 4.40 Smart Investing & Trading Score: 60 | |
| Day Percent Change: -4.13943% Day Change: -0.01 | |
| Week Change: -0.900901% Year-to-date Change: 7.8% | |
| CAAS Links: Profile News Message Board | |
| Charts:- Daily , Weekly | |
| Add CAAS to Watchlist: View: Get Complete CAAS Trend Analysis ➞ | |
 | SRSC Sears Canada Inc. |
| Sector: Services & Goods | |
| SubSector: Department Stores | |
| MarketCap: 132.44 Millions | |
| Recent Price: 1.02 Smart Investing & Trading Score: 10 | |
| Day Percent Change: 0.990099% Day Change: -9999 | |
| Week Change: -87.218% Year-to-date Change: 0.0% | |
| SRSC Links: Profile News Message Board | |
| Charts:- Daily , Weekly | |
| Add SRSC to Watchlist: View: Get Complete SRSC Trend Analysis ➞ | |
 | SPWH Sportsman's Warehouse Holdings Inc |
| Sector: Services & Goods | |
| SubSector: Specialty Retail | |
| MarketCap: 129.9 Millions | |
| Recent Price: 3.06 Smart Investing & Trading Score: 60 | |
| Day Percent Change: 0.657895% Day Change: -0.05 | |
| Week Change: -9.46746% Year-to-date Change: 19.1% | |
| SPWH Links: Profile News Message Board | |
| Charts:- Daily , Weekly | |
| Add SPWH to Watchlist: View: Get Complete SPWH Trend Analysis ➞ | |
 | CMLS Cumulus Media Inc. |
| Sector: Services & Goods | |
| SubSector: Broadcasting - Radio | |
| MarketCap: 128.695 Millions | |
| Recent Price: 0.16 Smart Investing & Trading Score: 40 | |
| Day Percent Change: -2.8125% Day Change: -9999 | |
| Week Change: -8.52941% Year-to-date Change: -78.7% | |
| CMLS Links: Profile News Message Board | |
| Charts:- Daily , Weekly | |
| Add CMLS to Watchlist: View: Get Complete CMLS Trend Analysis ➞ | |
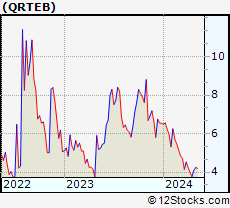 | QRTEB Qurate Retail, Inc. |
| Sector: Services & Goods | |
| SubSector: Specialty Retail, Other | |
| MarketCap: 124.244 Millions | |
| Recent Price: 2.00 Smart Investing & Trading Score: 10 | |
| Day Percent Change: -0.990099% Day Change: -9999 | |
| Week Change: -0.497512% Year-to-date Change: -29.1% | |
| QRTEB Links: Profile News Message Board | |
| Charts:- Daily , Weekly | |
| Add QRTEB to Watchlist: View: Get Complete QRTEB Trend Analysis ➞ | |
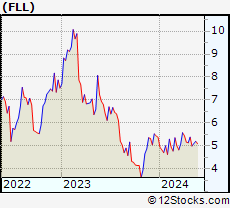 | FLL Full House Resorts, Inc |
| Sector: Services & Goods | |
| SubSector: Resorts & Casinos | |
| MarketCap: 122.78 Millions | |
| Recent Price: 3.49 Smart Investing & Trading Score: 40 | |
| Day Percent Change: 5.12048% Day Change: -0.08 | |
| Week Change: 2.64706% Year-to-date Change: -24.5% | |
| FLL Links: Profile News Message Board | |
| Charts:- Daily , Weekly | |
| Add FLL to Watchlist: View: Get Complete FLL Trend Analysis ➞ | |
 | PRPL Purple Innovation Inc |
| Sector: Services & Goods | |
| SubSector: Furnishings, Fixtures & Appliances | |
| MarketCap: 122.5 Millions | |
| Recent Price: 1.05 Smart Investing & Trading Score: 30 | |
| Day Percent Change: 0% Day Change: -0.02 | |
| Week Change: -7.07965% Year-to-date Change: 40.2% | |
| PRPL Links: Profile News Message Board | |
| Charts:- Daily , Weekly | |
| Add PRPL to Watchlist: View: Get Complete PRPL Trend Analysis ➞ | |
 | YUME YuMe, Inc. |
| Sector: Services & Goods | |
| SubSector: Advertising Agencies | |
| MarketCap: 122.13 Millions | |
| Recent Price: 8.26 Smart Investing & Trading Score: 50 | |
| Day Percent Change: 1.34969% Day Change: -9999 | |
| Week Change: -2.82353% Year-to-date Change: 0.0% | |
| YUME Links: Profile News Message Board | |
| Charts:- Daily , Weekly | |
| Add YUME to Watchlist: View: Get Complete YUME Trend Analysis ➞ | |
 | PLCE Childrens Place Inc |
| Sector: Services & Goods | |
| SubSector: Apparel Manufacturing | |
| MarketCap: 120.59 Millions | |
| Recent Price: 7.19 Smart Investing & Trading Score: 60 | |
| Day Percent Change: 3.0086% Day Change: 0.19 | |
| Week Change: 32.1691% Year-to-date Change: -31.2% | |
| PLCE Links: Profile News Message Board | |
| Charts:- Daily , Weekly | |
| Add PLCE to Watchlist: View: Get Complete PLCE Trend Analysis ➞ | |
 | KNDI Kandi Technologies Group Inc |
| Sector: Services & Goods | |
| SubSector: Recreational Vehicles | |
| MarketCap: 119.52 Millions | |
| Recent Price: 1.37 Smart Investing & Trading Score: 60 | |
| Day Percent Change: 0% Day Change: -0.07 | |
| Week Change: -1.43885% Year-to-date Change: 25.7% | |
| KNDI Links: Profile News Message Board | |
| Charts:- Daily , Weekly | |
| Add KNDI to Watchlist: View: Get Complete KNDI Trend Analysis ➞ | |
 | HOFT Hooker Furnishings Corporation |
| Sector: Services & Goods | |
| SubSector: Furnishings, Fixtures & Appliances | |
| MarketCap: 116.81 Millions | |
| Recent Price: 10.00 Smart Investing & Trading Score: 40 | |
| Day Percent Change: -3.2882% Day Change: -0.15 | |
| Week Change: -8.42491% Year-to-date Change: -22.8% | |
| HOFT Links: Profile News Message Board | |
| Charts:- Daily , Weekly | |
| Add HOFT to Watchlist: View: Get Complete HOFT Trend Analysis ➞ | |
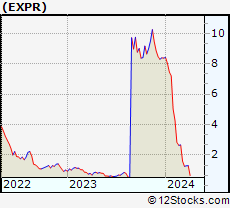 | EXPR Express, Inc. |
| Sector: Services & Goods | |
| SubSector: Apparel Stores | |
| MarketCap: 115.408 Millions | |
| Recent Price: 23.97 Smart Investing & Trading Score: 100 | |
| Day Percent Change: 2.30474% Day Change: -9999 | |
| Week Change: 946.725% Year-to-date Change: 0.0% | |
| EXPR Links: Profile News Message Board | |
| Charts:- Daily , Weekly | |
| Add EXPR to Watchlist: View: Get Complete EXPR Trend Analysis ➞ | |
 | RRGB Red Robin Gourmet Burgers Inc |
| Sector: Services & Goods | |
| SubSector: Restaurants | |
| MarketCap: 110.51 Millions | |
| Recent Price: 6.76 Smart Investing & Trading Score: 80 | |
| Day Percent Change: 0.296736% Day Change: -0.3 | |
| Week Change: 9.5624% Year-to-date Change: 19.2% | |
| RRGB Links: Profile News Message Board | |
| Charts:- Daily , Weekly | |
| Add RRGB to Watchlist: View: Get Complete RRGB Trend Analysis ➞ | |
 | VIOT Viomi Technology Co Ltd ADR |
| Sector: Services & Goods | |
| SubSector: Furnishings, Fixtures & Appliances | |
| MarketCap: 110.06 Millions | |
| Recent Price: 3.42 Smart Investing & Trading Score: 60 | |
| Day Percent Change: -3.38983% Day Change: 0.31 | |
| Week Change: 5.55556% Year-to-date Change: 130.1% | |
| VIOT Links: Profile News Message Board | |
| Charts:- Daily , Weekly | |
| Add VIOT to Watchlist: View: Get Complete VIOT Trend Analysis ➞ | |
 | WTRH Waitr Holdings Inc. |
| Sector: Services & Goods | |
| SubSector: Restaurants | |
| MarketCap: 109.57 Millions | |
| Recent Price: 1.82 Smart Investing & Trading Score: 20 | |
| Day Percent Change: 0% Day Change: -9999 | |
| Week Change: 0% Year-to-date Change: 0.0% | |
| WTRH Links: Profile News Message Board | |
| Charts:- Daily , Weekly | |
| Add WTRH to Watchlist: View: Get Complete WTRH Trend Analysis ➞ | |
| For tabular summary view of above stock list: Summary View ➞ 0 - 25 , 25 - 50 , 50 - 75 , 75 - 100 , 100 - 125 , 125 - 150 , 150 - 175 , 175 - 200 , 200 - 225 , 225 - 250 , 250 - 275 , 275 - 300 , 300 - 325 , 325 - 350 , 350 - 375 , 375 - 400 , 400 - 425 , 425 - 450 , 450 - 475 , 475 - 500 , 500 - 525 , 525 - 550 , 550 - 575 , 575 - 600 , 600 - 625 | ||
| Click To Change The Sort Order: By Market Cap or Company Size Performance: Year-to-date, Week and Day | |
| Select Chart Type: | ||
|
Best Stocks Today 12Stocks.com |
© 2025 12Stocks.com Terms & Conditions Privacy Contact Us
All Information Provided Only For Education And Not To Be Used For Investing or Trading. See Terms & Conditions


One More Thing ... Get Best Stocks Delivered Daily!
Never Ever Miss A Move With Our Top Ten Stocks Lists
Find Best Stocks In Any Market - Bull or Bear Market
Take A Peek At Our Top Ten Stocks Lists: Daily, Weekly, Year-to-Date & Top Trends
Find Best Stocks In Any Market - Bull or Bear Market
Take A Peek At Our Top Ten Stocks Lists: Daily, Weekly, Year-to-Date & Top Trends
Consumer Services Stocks With Best Up Trends [0-bearish to 100-bullish]: Whole Foods[100], Net 1[100], LiveWire [100], Denny's Corp[100], Ermenegildo Zegna[100], Revolve [100], Therealreal [100], Carters [100], Resources Connection[100], Sally Beauty[100], Advance Auto[100]
Best Consumer Services Stocks Year-to-Date:
WW [1871.33%], Nova Lifestyle[690.41%], ThredUp [665.957%], Lucid [554.785%], Vroom [455.146%], China Yuchai[297.742%], Luxottica [210.802%], Cooper-Standard [190.99%], Masterbeef [156.098%], Jumia Technologies[151.026%], Niu Technologies[136.782%] Best Consumer Services Stocks This Week:
Party City[37593.9%], Companhia Brasileira[18587.4%], Conn s[16420.1%], Rite Aid[10214.6%], Arctic Cat[2387.5%], Chico s[2120.53%], Multi-Color [2063.68%], Reis [1734.59%], Quotient Technology[954.386%], Express [946.725%], Volt Information[705.085%] Best Consumer Services Stocks Daily:
Container Store[22.6852%], SUPERVALU [20.4138%], Irobot Corp[15.4971%], World Wrestling[14.734%], Global Sources[13.1016%], Masterbeef [12.2995%], Whole Foods[11.8363%], iClick Interactive[10%], Net 1[9.46197%], LiveWire [9.09091%], Peloton Interactive[8.17942%]