
 Login Sign Up


| |||||
 |  | ||||

| 12Stocks.com Market Intelligence |
Best Consumer Services Stocks
| In a hurry? Services & Goods Stocks: Performance Trends Table, Stock Charts
Sort Consumer Services: Daily, Weekly, Year-to-Date, Market Cap & Trends. Filter Services & Goods stocks list by size: All Large Mid-Range Small |
| 12Stocks.com Consumer Services Stocks Performances & Trends Daily | |||||||||
|
|  The overall Smart Investing & Trading Score is 100 (0-bearish to 100-bullish) which puts Consumer Services sector in short term bullish trend. The Smart Investing & Trading Score from previous trading session is 50 and an improvement of trend continues.
| ||||||||
Here are the Smart Investing & Trading Scores of the most requested Consumer Services stocks at 12Stocks.com (click stock name for detailed review):
|


| Consider signing up for our daily 12Stocks.com "Best Stocks Newsletter". You will never ever miss a big stock move again! |
| 12Stocks.com: Investing in Consumer Services sector with Stocks | |
|
The following table helps investors and traders sort through current performance and trends (as measured by Smart Investing & Trading Score) of various
stocks in the Consumer Services sector. Quick View: Move mouse or cursor over stock symbol (ticker) to view short-term Technical chart and over stock name to view long term chart. Click on  to add stock symbol to your watchlist and to add stock symbol to your watchlist and  to view watchlist. Click on any ticker or stock name for detailed market intelligence report for that stock. to view watchlist. Click on any ticker or stock name for detailed market intelligence report for that stock. |
12Stocks.com Performance of Stocks in Consumer Services Sector
| Ticker | Stock Name | Watchlist | Category | Recent Price | Smart Investing & Trading Score | Change % | YTD Change% |
| FRGI | Fiesta Restaurant |   | Restaurants | 8.49 | 10 | 0.00% | 0.00% |
| SES | SES AI | | Auto Parts | 1.32 | 90 | 5.60% | -30.53% |
| HVT | Haverty Furniture | | Home Improvement Retail | 23.16 | 50 | 1.62% | 8.99% |
| JACK | Jack In | | Restaurants | 19.59 | 90 | 5.66% | -51.50% |
| PBPB | Potbelly Corp | | Restaurants | 17.01 | 100 | 0.06% | 81.54% |
| MCFT | MasterCraft Boat | | Recreational | 22.69 | 60 | 2.16% | 22.52% |
| CDRO | Codere Online | | Gambling | 7.60 | 0 | -1.94% | 20.25% |
| HABT | Habit Restaurants | | Restaurants | 31.04 | 70 | 0.00% | 0.00% |
| ZUMZ | Zumiez | | Apparel Retail | 20.03 | 50 | -0.94% | 5.59% |
| DIN | Dine Brands | | Restaurants | 23.90 | 80 | -1.24% | -16.81% |
| PLYA | Playa Hotels | | Casinos | 13.48 | 30 | -0.07% | 7.67% |
| GCO | Genesco | | Apparel Retail | 33.53 | 80 | 1.02% | -19.82% |
| BXG | Bluegreen Vacations | | Casinos | 9.32 | 0 | -52.08% | 0.00% |
| PERY | Perry Ellis | | Apparel | 1.65 | 30 | 1.85% | 0.00% |
| RECN | Resources Connection | | Staffing | 11.21 | 100 | 5.46% | 0.00% |
| STS | Supreme Industries | | Automotive | 3.46 | 10 | -3.62% | 0.00% |
| MYTE | MYT Netherlands | | Luxury Goods | 7.61 | 0 | -3.55% | 1.74% |
| PCMI | PCM | | Retail | 12.61 | 30 | 0.24% | 0.00% |
| FLWS | 1-800 Flowers.com | | Specialty Retail | 5.43 | 60 | 0.74% | -30.47% |
| ZOES | Zoes Kitchen | | Restaurants | 7.98 | 20 | 2.05% | 0.00% |
| MPX | Marine Products | | Recreational | 9.43 | 100 | 4.55% | 9.55% |
| HMHC | Houghton Mifflin | | Education | 7.45 | 30 | 1.36% | 0.00% |
| RICK | RCI Hospitality | | Restaurants | 34.32 | 10 | -1.69% | -39.77% |
| LOCO | El Pollo | | Restaurants | 10.14 | 10 | 0.20% | -11.13% |
| CTRN | Citi Trends | | Apparel Retail | 34.58 | 60 | 1.92% | 33.10% |
| For chart view version of above stock list: Chart View ➞ 0 - 25 , 25 - 50 , 50 - 75 , 75 - 100 , 100 - 125 , 125 - 150 , 150 - 175 , 175 - 200 , 200 - 225 , 225 - 250 , 250 - 275 , 275 - 300 , 300 - 325 , 325 - 350 , 350 - 375 , 375 - 400 , 400 - 425 , 425 - 450 , 450 - 475 , 475 - 500 , 500 - 525 , 525 - 550 , 550 - 575 , 575 - 600 , 600 - 625 | ||
 | Click To Change The Sort Order: By Market Cap or Company Size Performance: Year-to-date, Week and Day |  |
|
Get the most comprehensive stock market coverage daily at 12Stocks.com ➞ Best Stocks Today ➞ Best Stocks Weekly ➞ Best Stocks Year-to-Date ➞ Best Stocks Trends ➞  Best Stocks Today 12Stocks.com Best Nasdaq Stocks ➞ Best S&P 500 Stocks ➞ Best Tech Stocks ➞ Best Biotech Stocks ➞ |
| Detailed Overview of Consumer Services Stocks |
| Consumer Services Technical Overview, Leaders & Laggards, Top Consumer Services ETF Funds & Detailed Consumer Services Stocks List, Charts, Trends & More |
| Consumer Services Sector: Technical Analysis, Trends & YTD Performance | |
| Consumer Services sector is composed of stocks
from retail, entertainment, media/publishing, consumer goods
and services subsectors. Consumer Services sector, as represented by XLY, an exchange-traded fund [ETF] that holds basket of Consumer Services stocks (e.g, Walmart, Alibaba) is up by 9.2482% and is currently underperforming the overall market by -4.1526% year-to-date. Below is a quick view of Technical charts and trends: |
|
 XLY Weekly Chart |
|
| Long Term Trend: Very Good | |
| Medium Term Trend: Good | |
 XLY Daily Chart |
|
| Short Term Trend: Very Good | |
| Overall Trend Score: 100 | |
| YTD Performance: 9.2482% | |
| **Trend Scores & Views Are Only For Educational Purposes And Not For Investing | |
| 12Stocks.com: Top Performing Consumer Services Sector Stocks | ||||||||||||||||||||||||||||||||||||||||||||||||
 The top performing Consumer Services sector stocks year to date are
Now, more recently, over last week, the top performing Consumer Services sector stocks on the move are


|
||||||||||||||||||||||||||||||||||||||||||||||||
| 12Stocks.com: Investing in Consumer Services Sector using Exchange Traded Funds | |
|
The following table shows list of key exchange traded funds (ETF) that
help investors track Consumer Services Index. For detailed view, check out our ETF Funds section of our website. Quick View: Move mouse or cursor over ETF symbol (ticker) to view short-term Technical chart and over ETF name to view long term chart. Click on ticker or stock name for detailed view. Click on to add stock symbol to your watchlist and to view watchlist. |
12Stocks.com List of ETFs that track Consumer Services Index
| Ticker | ETF Name | Watchlist | Recent Price | Smart Investing & Trading Score | Change % | Week % | Year-to-date % |
| PMR | Retail | | 40.96 | 70 | -0.0244081 | 2.86288 | 0% |
| 12Stocks.com: Charts, Trends, Fundamental Data and Performances of Consumer Services Stocks | |
|
We now take in-depth look at all Consumer Services stocks including charts, multi-period performances and overall trends (as measured by Smart Investing & Trading Score). One can sort Consumer Services stocks (click link to choose) by Daily, Weekly and by Year-to-Date performances. Also, one can sort by size of the company or by market capitalization. |
| Select Your Default Chart Type: | |||||
| |||||
| Click on stock symbol or name for detailed view. Click on to add stock symbol to your watchlist and to view watchlist. Quick View: Move mouse or cursor over "Daily" to quickly view daily Technical stock chart and over "Weekly" to view weekly Technical stock chart. | |||||

 | FRGI Fiesta Restaurant Group, Inc. |
| Sector: Services & Goods | |
| SubSector: Restaurants | |
| MarketCap: 403.57 Millions | |
| Recent Price: 8.49 Smart Investing & Trading Score: 10 | |
| Day Percent Change: 0% Day Change: -9999 | |
| Week Change: 0% Year-to-date Change: 0.0% | |
| FRGI Links: Profile News Message Board | |
| Charts:- Daily , Weekly | |
| Add FRGI to Watchlist: View: Get Complete FRGI Trend Analysis ➞ | |
 | SES SES AI Corporation |
| Sector: Services & Goods | |
| SubSector: Auto Parts | |
| MarketCap: 394.98 Millions | |
| Recent Price: 1.32 Smart Investing & Trading Score: 90 | |
| Day Percent Change: 5.6% Day Change: -0.03 | |
| Week Change: 22.2222% Year-to-date Change: -30.5% | |
| SES Links: Profile News Message Board | |
| Charts:- Daily , Weekly | |
| Add SES to Watchlist: View: Get Complete SES Trend Analysis ➞ | |
 | HVT Haverty Furniture Cos., Inc |
| Sector: Services & Goods | |
| SubSector: Home Improvement Retail | |
| MarketCap: 389.83 Millions | |
| Recent Price: 23.16 Smart Investing & Trading Score: 50 | |
| Day Percent Change: 1.62352% Day Change: -0.08 | |
| Week Change: -3.5% Year-to-date Change: 9.0% | |
| HVT Links: Profile News Message Board | |
| Charts:- Daily , Weekly | |
| Add HVT to Watchlist: View: Get Complete HVT Trend Analysis ➞ | |
 | JACK Jack In The Box, Inc |
| Sector: Services & Goods | |
| SubSector: Restaurants | |
| MarketCap: 385.77 Millions | |
| Recent Price: 19.59 Smart Investing & Trading Score: 90 | |
| Day Percent Change: 5.66343% Day Change: -0.57 | |
| Week Change: -4.1116% Year-to-date Change: -51.5% | |
| JACK Links: Profile News Message Board | |
| Charts:- Daily , Weekly | |
| Add JACK to Watchlist: View: Get Complete JACK Trend Analysis ➞ | |
 | PBPB Potbelly Corp |
| Sector: Services & Goods | |
| SubSector: Restaurants | |
| MarketCap: 382.8 Millions | |
| Recent Price: 17.01 Smart Investing & Trading Score: 100 | |
| Day Percent Change: 0.0588235% Day Change: 0.13 | |
| Week Change: 34.4664% Year-to-date Change: 81.5% | |
| PBPB Links: Profile News Message Board | |
| Charts:- Daily , Weekly | |
| Add PBPB to Watchlist: View: Get Complete PBPB Trend Analysis ➞ | |
 | MCFT MasterCraft Boat Holdings Inc |
| Sector: Services & Goods | |
| SubSector: Recreational Vehicles | |
| MarketCap: 376.35 Millions | |
| Recent Price: 22.69 Smart Investing & Trading Score: 60 | |
| Day Percent Change: 2.16119% Day Change: -0.28 | |
| Week Change: -1.68977% Year-to-date Change: 22.5% | |
| MCFT Links: Profile News Message Board | |
| Charts:- Daily , Weekly | |
| Add MCFT to Watchlist: View: Get Complete MCFT Trend Analysis ➞ | |
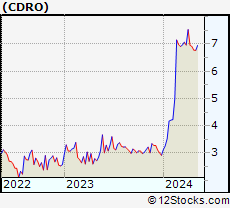 | CDRO Codere Online Luxembourg S.A |
| Sector: Services & Goods | |
| SubSector: Gambling | |
| MarketCap: 376.08 Millions | |
| Recent Price: 7.60 Smart Investing & Trading Score: 0 | |
| Day Percent Change: -1.93548% Day Change: 0.25 | |
| Week Change: -7.76699% Year-to-date Change: 20.3% | |
| CDRO Links: Profile News Message Board | |
| Charts:- Daily , Weekly | |
| Add CDRO to Watchlist: View: Get Complete CDRO Trend Analysis ➞ | |
 | HABT The Habit Restaurants, Inc. |
| Sector: Services & Goods | |
| SubSector: Restaurants | |
| MarketCap: 366.17 Millions | |
| Recent Price: 31.04 Smart Investing & Trading Score: 70 | |
| Day Percent Change: 0% Day Change: -9999 | |
| Week Change: 305.222% Year-to-date Change: 0.0% | |
| HABT Links: Profile News Message Board | |
| Charts:- Daily , Weekly | |
| Add HABT to Watchlist: View: Get Complete HABT Trend Analysis ➞ | |
 | ZUMZ Zumiez Inc |
| Sector: Services & Goods | |
| SubSector: Apparel Retail | |
| MarketCap: 365.54 Millions | |
| Recent Price: 20.03 Smart Investing & Trading Score: 50 | |
| Day Percent Change: -0.939664% Day Change: -0.06 | |
| Week Change: -6.00657% Year-to-date Change: 5.6% | |
| ZUMZ Links: Profile News Message Board | |
| Charts:- Daily , Weekly | |
| Add ZUMZ to Watchlist: View: Get Complete ZUMZ Trend Analysis ➞ | |
 | DIN Dine Brands Global Inc |
| Sector: Services & Goods | |
| SubSector: Restaurants | |
| MarketCap: 364.18 Millions | |
| Recent Price: 23.90 Smart Investing & Trading Score: 80 | |
| Day Percent Change: -1.23967% Day Change: -0.17 | |
| Week Change: 2.57511% Year-to-date Change: -16.8% | |
| DIN Links: Profile News Message Board | |
| Charts:- Daily , Weekly | |
| Add DIN to Watchlist: View: Get Complete DIN Trend Analysis ➞ | |
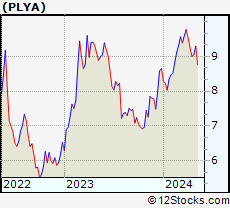 | PLYA Playa Hotels & Resorts N.V. |
| Sector: Services & Goods | |
| SubSector: Resorts & Casinos | |
| MarketCap: 360.194 Millions | |
| Recent Price: 13.48 Smart Investing & Trading Score: 30 | |
| Day Percent Change: -0.074129% Day Change: -9999 | |
| Week Change: 0% Year-to-date Change: 7.7% | |
| PLYA Links: Profile News Message Board | |
| Charts:- Daily , Weekly | |
| Add PLYA to Watchlist: View: Get Complete PLYA Trend Analysis ➞ | |
 | GCO Genesco Inc |
| Sector: Services & Goods | |
| SubSector: Apparel Retail | |
| MarketCap: 359.58 Millions | |
| Recent Price: 33.53 Smart Investing & Trading Score: 80 | |
| Day Percent Change: 1.0244% Day Change: 1.41 | |
| Week Change: 0.509592% Year-to-date Change: -19.8% | |
| GCO Links: Profile News Message Board | |
| Charts:- Daily , Weekly | |
| Add GCO to Watchlist: View: Get Complete GCO Trend Analysis ➞ | |
 | BXG Bluegreen Vacations Corporation |
| Sector: Services & Goods | |
| SubSector: Resorts & Casinos | |
| MarketCap: 353.894 Millions | |
| Recent Price: 9.32 Smart Investing & Trading Score: 0 | |
| Day Percent Change: -52.0823% Day Change: -9999 | |
| Week Change: 0% Year-to-date Change: 0.0% | |
| BXG Links: Profile News Message Board | |
| Charts:- Daily , Weekly | |
| Add BXG to Watchlist: View: Get Complete BXG Trend Analysis ➞ | |
 | PERY Perry Ellis International, Inc. |
| Sector: Services & Goods | |
| SubSector: Textile - Apparel Clothing | |
| MarketCap: 348.23 Millions | |
| Recent Price: 1.65 Smart Investing & Trading Score: 30 | |
| Day Percent Change: 1.85185% Day Change: -9999 | |
| Week Change: 25% Year-to-date Change: 0.0% | |
| PERY Links: Profile News Message Board | |
| Charts:- Daily , Weekly | |
| Add PERY to Watchlist: View: Get Complete PERY Trend Analysis ➞ | |
 | RECN Resources Connection, Inc. |
| Sector: Services & Goods | |
| SubSector: Staffing & Outsourcing Services | |
| MarketCap: 347.528 Millions | |
| Recent Price: 11.21 Smart Investing & Trading Score: 100 | |
| Day Percent Change: 5.45626% Day Change: -9999 | |
| Week Change: 3.98887% Year-to-date Change: 0.0% | |
| RECN Links: Profile News Message Board | |
| Charts:- Daily , Weekly | |
| Add RECN to Watchlist: View: Get Complete RECN Trend Analysis ➞ | |
 | STS Supreme Industries, Inc. |
| Sector: Services & Goods | |
| SubSector: Trucks & Other Vehicles | |
| MarketCap: 335.57 Millions | |
| Recent Price: 3.46 Smart Investing & Trading Score: 10 | |
| Day Percent Change: -3.62117% Day Change: -9999 | |
| Week Change: -63.6172% Year-to-date Change: 0.0% | |
| STS Links: Profile News Message Board | |
| Charts:- Daily , Weekly | |
| Add STS to Watchlist: View: Get Complete STS Trend Analysis ➞ | |
 | MYTE MYT Netherlands Parent B.V. |
| Sector: Services & Goods | |
| SubSector: Luxury Goods | |
| MarketCap: 330 Millions | |
| Recent Price: 7.61 Smart Investing & Trading Score: 0 | |
| Day Percent Change: -3.5488% Day Change: -9999 | |
| Week Change: -5.58313% Year-to-date Change: 1.7% | |
| MYTE Links: Profile News Message Board | |
| Charts:- Daily , Weekly | |
| Add MYTE to Watchlist: View: Get Complete MYTE Trend Analysis ➞ | |
 | PCMI PCM, Inc. |
| Sector: Services & Goods | |
| SubSector: Specialty Retail, Other | |
| MarketCap: 329.74 Millions | |
| Recent Price: 12.61 Smart Investing & Trading Score: 30 | |
| Day Percent Change: 0.238474% Day Change: -9999 | |
| Week Change: -2.92533% Year-to-date Change: 0.0% | |
| PCMI Links: Profile News Message Board | |
| Charts:- Daily , Weekly | |
| Add PCMI to Watchlist: View: Get Complete PCMI Trend Analysis ➞ | |
 | FLWS 1-800 Flowers.com Inc |
| Sector: Services & Goods | |
| SubSector: Specialty Retail | |
| MarketCap: 324.17 Millions | |
| Recent Price: 5.43 Smart Investing & Trading Score: 60 | |
| Day Percent Change: 0.742115% Day Change: -0.12 | |
| Week Change: 6.47059% Year-to-date Change: -30.5% | |
| FLWS Links: Profile News Message Board | |
| Charts:- Daily , Weekly | |
| Add FLWS to Watchlist: View: Get Complete FLWS Trend Analysis ➞ | |
 | ZOES Zoes Kitchen, Inc. |
| Sector: Services & Goods | |
| SubSector: Restaurants | |
| MarketCap: 323.88 Millions | |
| Recent Price: 7.98 Smart Investing & Trading Score: 20 | |
| Day Percent Change: 2.04604% Day Change: -9999 | |
| Week Change: -64.8458% Year-to-date Change: 0.0% | |
| ZOES Links: Profile News Message Board | |
| Charts:- Daily , Weekly | |
| Add ZOES to Watchlist: View: Get Complete ZOES Trend Analysis ➞ | |
 | MPX Marine Products Corp |
| Sector: Services & Goods | |
| SubSector: Recreational Vehicles | |
| MarketCap: 318.11 Millions | |
| Recent Price: 9.43 Smart Investing & Trading Score: 100 | |
| Day Percent Change: 4.54545% Day Change: -0.09 | |
| Week Change: 3.74037% Year-to-date Change: 9.5% | |
| MPX Links: Profile News Message Board | |
| Charts:- Daily , Weekly | |
| Add MPX to Watchlist: View: Get Complete MPX Trend Analysis ➞ | |
 | HMHC Houghton Mifflin Harcourt Company |
| Sector: Services & Goods | |
| SubSector: Education & Training Services | |
| MarketCap: 316.706 Millions | |
| Recent Price: 7.45 Smart Investing & Trading Score: 30 | |
| Day Percent Change: 1.36054% Day Change: -9999 | |
| Week Change: -64.5407% Year-to-date Change: 0.0% | |
| HMHC Links: Profile News Message Board | |
| Charts:- Daily , Weekly | |
| Add HMHC to Watchlist: View: Get Complete HMHC Trend Analysis ➞ | |
 | RICK RCI Hospitality Holdings Inc |
| Sector: Services & Goods | |
| SubSector: Restaurants | |
| MarketCap: 315.33 Millions | |
| Recent Price: 34.32 Smart Investing & Trading Score: 10 | |
| Day Percent Change: -1.69006% Day Change: 0.09 | |
| Week Change: -5.0885% Year-to-date Change: -39.8% | |
| RICK Links: Profile News Message Board | |
| Charts:- Daily , Weekly | |
| Add RICK to Watchlist: View: Get Complete RICK Trend Analysis ➞ | |
 | LOCO El Pollo Loco Holdings Inc |
| Sector: Services & Goods | |
| SubSector: Restaurants | |
| MarketCap: 313.75 Millions | |
| Recent Price: 10.14 Smart Investing & Trading Score: 10 | |
| Day Percent Change: 0.197628% Day Change: 0.01 | |
| Week Change: -3.05927% Year-to-date Change: -11.1% | |
| LOCO Links: Profile News Message Board | |
| Charts:- Daily , Weekly | |
| Add LOCO to Watchlist: View: Get Complete LOCO Trend Analysis ➞ | |
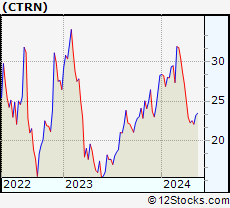 | CTRN Citi Trends Inc |
| Sector: Services & Goods | |
| SubSector: Apparel Retail | |
| MarketCap: 312.77 Millions | |
| Recent Price: 34.58 Smart Investing & Trading Score: 60 | |
| Day Percent Change: 1.91571% Day Change: 0.7 | |
| Week Change: -8.30019% Year-to-date Change: 33.1% | |
| CTRN Links: Profile News Message Board | |
| Charts:- Daily , Weekly | |
| Add CTRN to Watchlist: View: Get Complete CTRN Trend Analysis ➞ | |
| For tabular summary view of above stock list: Summary View ➞ 0 - 25 , 25 - 50 , 50 - 75 , 75 - 100 , 100 - 125 , 125 - 150 , 150 - 175 , 175 - 200 , 200 - 225 , 225 - 250 , 250 - 275 , 275 - 300 , 300 - 325 , 325 - 350 , 350 - 375 , 375 - 400 , 400 - 425 , 425 - 450 , 450 - 475 , 475 - 500 , 500 - 525 , 525 - 550 , 550 - 575 , 575 - 600 , 600 - 625 | ||
| Click To Change The Sort Order: By Market Cap or Company Size Performance: Year-to-date, Week and Day | |
| Select Chart Type: | ||
|
Best Stocks Today 12Stocks.com |
© 2025 12Stocks.com Terms & Conditions Privacy Contact Us
All Information Provided Only For Education And Not To Be Used For Investing or Trading. See Terms & Conditions


One More Thing ... Get Best Stocks Delivered Daily!
Never Ever Miss A Move With Our Top Ten Stocks Lists
Find Best Stocks In Any Market - Bull or Bear Market
Take A Peek At Our Top Ten Stocks Lists: Daily, Weekly, Year-to-Date & Top Trends
Find Best Stocks In Any Market - Bull or Bear Market
Take A Peek At Our Top Ten Stocks Lists: Daily, Weekly, Year-to-Date & Top Trends
Consumer Services Stocks With Best Up Trends [0-bearish to 100-bullish]: Whole Foods[100], Net 1[100], LiveWire [100], Denny's Corp[100], Ermenegildo Zegna[100], Revolve [100], Therealreal [100], Carters [100], Resources Connection[100], Sally Beauty[100], Advance Auto[100]
Best Consumer Services Stocks Year-to-Date:
WW [1871.33%], Nova Lifestyle[690.41%], ThredUp [665.957%], Lucid [554.785%], Vroom [455.146%], China Yuchai[297.742%], Luxottica [210.802%], Cooper-Standard [190.99%], Masterbeef [156.098%], Jumia Technologies[151.026%], Niu Technologies[136.782%] Best Consumer Services Stocks This Week:
Party City[37593.9%], Companhia Brasileira[18587.4%], Conn s[16420.1%], Rite Aid[10214.6%], Arctic Cat[2387.5%], Chico s[2120.53%], Multi-Color [2063.68%], Reis [1734.59%], Quotient Technology[954.386%], Express [946.725%], Volt Information[705.085%] Best Consumer Services Stocks Daily:
Container Store[22.6852%], SUPERVALU [20.4138%], Irobot Corp[15.4971%], World Wrestling[14.734%], Global Sources[13.1016%], Masterbeef [12.2995%], Whole Foods[11.8363%], iClick Interactive[10%], Net 1[9.46197%], LiveWire [9.09091%], Peloton Interactive[8.17942%]