
 Login Sign Up


| |||||
 |  | ||||

| 12Stocks.com Market Intelligence |
Best Consumer Services Stocks
| In a hurry? Services & Goods Stocks: Performance Trends Table, Stock Charts
Sort Consumer Services: Daily, Weekly, Year-to-Date, Market Cap & Trends. Filter Services & Goods stocks list by size: All Large Mid-Range Small |
| 12Stocks.com Consumer Services Stocks Performances & Trends Daily | |||||||||
|
|  The overall Smart Investing & Trading Score is 100 (0-bearish to 100-bullish) which puts Consumer Services sector in short term bullish trend. The Smart Investing & Trading Score from previous trading session is 100 and an improvement of trend continues.
| ||||||||
Here are the Smart Investing & Trading Scores of the most requested Consumer Services stocks at 12Stocks.com (click stock name for detailed review):
|


| Consider signing up for our daily 12Stocks.com "Best Stocks Newsletter". You will never ever miss a big stock move again! |
| 12Stocks.com: Investing in Consumer Services sector with Stocks | |
|
The following table helps investors and traders sort through current performance and trends (as measured by Smart Investing & Trading Score) of various
stocks in the Consumer Services sector. Quick View: Move mouse or cursor over stock symbol (ticker) to view short-term Technical chart and over stock name to view long term chart. Click on  to add stock symbol to your watchlist and to add stock symbol to your watchlist and  to view watchlist. Click on any ticker or stock name for detailed market intelligence report for that stock. to view watchlist. Click on any ticker or stock name for detailed market intelligence report for that stock. |
12Stocks.com Performance of Stocks in Consumer Services Sector
| Ticker | Stock Name | Watchlist | Category | Recent Price | Smart Investing & Trading Score | Change % | YTD Change% |
| AXL | American Axle |   | Auto Parts | 5.82 | 60 | 1.60% | -2.23% |
| CPS | Cooper-Standard | | Auto Parts | 36.82 | 90 | 16.38% | 153.02% |
| SCVL | Shoe Carnival | | Apparel Retail | 20.90 | 100 | 2.69% | -35.26% |
| CSV | Carriage Services | | Services | 43.78 | 40 | 0.07% | 14.24% |
| LEGH | Legacy Housing | | Residential Construction | 27.95 | 90 | 2.44% | 12.28% |
| ODP | ODP | | Specialty Retail | 20.26 | 100 | -2.57% | -11.74% |
| GDEN | Golden Entertainment | | Casinos | 24.87 | 40 | -0.41% | -21.56% |
| MBUU | Malibu Boats | | Recreational | 33.20 | 70 | -0.61% | -4.39% |
| OXM | Oxford Industries | | Apparel Manufacturing | 44.05 | 20 | -0.80% | -41.12% |
| MYE | Myers Industries | | Packaging | 16.74 | 50 | -1.11% | 47.77% |
| BLMN | Bloomin Brands | | Restaurants | 7.35 | 30 | -3.06% | -41.01% |
| UONEK | Urban One | | Broadcasting | 0.79 | 100 | -1.32% | -24.62% |
| RERE | ATRenew | | Internet Retail | 4.72 | 40 | 1.97% | 61.46% |
| ECX | ECARX | | Auto Parts | 1.62 | 0 | 1.85% | -21.80% |
| HZO | Marinemax | | Specialty Retail | 26.35 | 70 | -1.35% | -11.64% |
| CAL | Caleres | | Apparel Retail | 15.00 | 80 | 0.48% | -35.77% |
| MNRO | Monro | | Auto Parts | 16.58 | 100 | -2.18% | -34.50% |
| PTLO | Portillos | | Restaurants | 7.08 | 10 | -1.11% | -24.15% |
| KRT | Karat Packaging | | Packaging | 25.28 | 60 | -0.20% | -15.05% |
| MLR | Miller Industries | | Auto Parts | 42.09 | 50 | -0.83% | -33.78% |
| HLLY | Holley | | Auto Parts | 4.07 | 50 | -2.16% | 20.20% |
| LE | Lands' End | | Apparel Retail | 14.36 | 90 | 2.74% | 0.00% |
| PACK | Ranpak | | Packaging | 5.28 | 90 | -2.05% | -37.35% |
| NATH | Nathan's Famous | | Restaurants | 104.70 | 40 | 0.69% | 37.82% |
| JOUT | Johnson Outdoors | | Leisure | 40.32 | 80 | 0.48% | 25.55% |
| For chart view version of above stock list: Chart View ➞ 0 - 25 , 25 - 50 , 50 - 75 , 75 - 100 , 100 - 125 , 125 - 150 , 150 - 175 , 175 - 200 , 200 - 225 , 225 - 250 , 250 - 275 , 275 - 300 , 300 - 325 , 325 - 350 , 350 - 375 , 375 - 400 | ||
 | Click To Change The Sort Order: By Market Cap or Company Size Performance: Year-to-date, Week and Day |  |
|
Get the most comprehensive stock market coverage daily at 12Stocks.com ➞ Best Stocks Today ➞ Best Stocks Weekly ➞ Best Stocks Year-to-Date ➞ Best Stocks Trends ➞  Best Stocks Today 12Stocks.com Best Nasdaq Stocks ➞ Best S&P 500 Stocks ➞ Best Tech Stocks ➞ Best Biotech Stocks ➞ |
| Detailed Overview of Consumer Services Stocks |
| Consumer Services Technical Overview, Leaders & Laggards, Top Consumer Services ETF Funds & Detailed Consumer Services Stocks List, Charts, Trends & More |
| Consumer Services Sector: Technical Analysis, Trends & YTD Performance | |
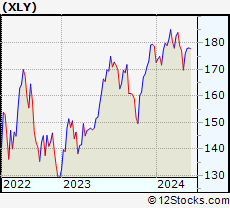
| Consumer Services sector is composed of stocks
from retail, entertainment, media/publishing, consumer goods
and services subsectors. Consumer Services sector, as represented by XLY, an exchange-traded fund [ETF] that holds basket of Consumer Services stocks (e.g, Walmart, Alibaba) is up by 0.83% and is currently underperforming the overall market by -6.89% year-to-date. Below is a quick view of Technical charts and trends: |
|
 XLY Weekly Chart |
|
| Long Term Trend: Very Good | |
| Medium Term Trend: Good | |
 XLY Daily Chart |
|
| Short Term Trend: Very Good | |
| Overall Trend Score: 100 | |
| YTD Performance: 0.83% | |
| **Trend Scores & Views Are Only For Educational Purposes And Not For Investing | |
| 12Stocks.com: Top Performing Consumer Services Sector Stocks | ||||||||||||||||||||||||||||||||||||||||||||||||
 The top performing Consumer Services sector stocks year to date are
Now, more recently, over last week, the top performing Consumer Services sector stocks on the move are


|
||||||||||||||||||||||||||||||||||||||||||||||||
| 12Stocks.com: Investing in Consumer Services Sector using Exchange Traded Funds | |
|
The following table shows list of key exchange traded funds (ETF) that
help investors track Consumer Services Index. For detailed view, check out our ETF Funds section of our website. Quick View: Move mouse or cursor over ETF symbol (ticker) to view short-term Technical chart and over ETF name to view long term chart. Click on ticker or stock name for detailed view. Click on to add stock symbol to your watchlist and to view watchlist. |
12Stocks.com List of ETFs that track Consumer Services Index
| Ticker | ETF Name | Watchlist | Recent Price | Smart Investing & Trading Score | Change % | Week % | Year-to-date % |
| 12Stocks.com: Charts, Trends, Fundamental Data and Performances of Consumer Services Stocks | |
|
We now take in-depth look at all Consumer Services stocks including charts, multi-period performances and overall trends (as measured by Smart Investing & Trading Score). One can sort Consumer Services stocks (click link to choose) by Daily, Weekly and by Year-to-Date performances. Also, one can sort by size of the company or by market capitalization. |
| Select Your Default Chart Type: | |||||
| |||||
| Click on stock symbol or name for detailed view. Click on to add stock symbol to your watchlist and to view watchlist. Quick View: Move mouse or cursor over "Daily" to quickly view daily Technical stock chart and over "Weekly" to view weekly Technical stock chart. | |||||

 | AXL American Axle & Manufacturing Holdings Inc |
| Sector: Services & Goods | |
| SubSector: Auto Parts | |
| MarketCap: 706.05 Millions | |
| Recent Price: 5.82 Smart Investing & Trading Score: 60 | |
| Day Percent Change: 1.6% Day Change: 0.09 | |
| Week Change: -2.06% Year-to-date Change: -2.2% | |
| AXL Links: Profile News Message Board | |
| Charts:- Daily , Weekly | |
| Add AXL to Watchlist: View: Get Complete AXL Trend Analysis ➞ | |
 | CPS Cooper-Standard Holdings Inc |
| Sector: Services & Goods | |
| SubSector: Auto Parts | |
| MarketCap: 677.12 Millions | |
| Recent Price: 36.82 Smart Investing & Trading Score: 90 | |
| Day Percent Change: 16.38% Day Change: 4.83 | |
| Week Change: 18.47% Year-to-date Change: 153.0% | |
| CPS Links: Profile News Message Board | |
| Charts:- Daily , Weekly | |
| Add CPS to Watchlist: View: Get Complete CPS Trend Analysis ➞ | |
 | SCVL Shoe Carnival, Inc |
| Sector: Services & Goods | |
| SubSector: Apparel Retail | |
| MarketCap: 672.73 Millions | |
| Recent Price: 20.90 Smart Investing & Trading Score: 100 | |
| Day Percent Change: 2.69% Day Change: 0.55 | |
| Week Change: 1.16% Year-to-date Change: -35.3% | |
| SCVL Links: Profile News Message Board | |
| Charts:- Daily , Weekly | |
| Add SCVL to Watchlist: View: Get Complete SCVL Trend Analysis ➞ | |
 | CSV Carriage Services, Inc |
| Sector: Services & Goods | |
| SubSector: Personal Services | |
| MarketCap: 670.95 Millions | |
| Recent Price: 43.78 Smart Investing & Trading Score: 40 | |
| Day Percent Change: 0.07% Day Change: 0.03 | |
| Week Change: -2.88% Year-to-date Change: 14.2% | |
| CSV Links: Profile News Message Board | |
| Charts:- Daily , Weekly | |
| Add CSV to Watchlist: View: Get Complete CSV Trend Analysis ➞ | |
 | LEGH Legacy Housing Corp |
| Sector: Services & Goods | |
| SubSector: Residential Construction | |
| MarketCap: 669.76 Millions | |
| Recent Price: 27.95 Smart Investing & Trading Score: 90 | |
| Day Percent Change: 2.44% Day Change: 0.66 | |
| Week Change: 2.78% Year-to-date Change: 12.3% | |
| LEGH Links: Profile News Message Board | |
| Charts:- Daily , Weekly | |
| Add LEGH to Watchlist: View: Get Complete LEGH Trend Analysis ➞ | |
 | ODP ODP Corporation |
| Sector: Services & Goods | |
| SubSector: Specialty Retail | |
| MarketCap: 668.17 Millions | |
| Recent Price: 20.26 Smart Investing & Trading Score: 100 | |
| Day Percent Change: -2.57% Day Change: -0.53 | |
| Week Change: -3.42% Year-to-date Change: -11.7% | |
| ODP Links: Profile News Message Board | |
| Charts:- Daily , Weekly | |
| Add ODP to Watchlist: View: Get Complete ODP Trend Analysis ➞ | |
 | GDEN Golden Entertainment Inc |
| Sector: Services & Goods | |
| SubSector: Resorts & Casinos | |
| MarketCap: 648.72 Millions | |
| Recent Price: 24.87 Smart Investing & Trading Score: 40 | |
| Day Percent Change: -0.41% Day Change: -0.1 | |
| Week Change: -3.64% Year-to-date Change: -21.6% | |
| GDEN Links: Profile News Message Board | |
| Charts:- Daily , Weekly | |
| Add GDEN to Watchlist: View: Get Complete GDEN Trend Analysis ➞ | |
 | MBUU Malibu Boats Inc |
| Sector: Services & Goods | |
| SubSector: Recreational Vehicles | |
| MarketCap: 647.79 Millions | |
| Recent Price: 33.20 Smart Investing & Trading Score: 70 | |
| Day Percent Change: -0.61% Day Change: -0.22 | |
| Week Change: -1.48% Year-to-date Change: -4.4% | |
| MBUU Links: Profile News Message Board | |
| Charts:- Daily , Weekly | |
| Add MBUU to Watchlist: View: Get Complete MBUU Trend Analysis ➞ | |
 | OXM Oxford Industries, Inc |
| Sector: Services & Goods | |
| SubSector: Apparel Manufacturing | |
| MarketCap: 629.38 Millions | |
| Recent Price: 44.05 Smart Investing & Trading Score: 20 | |
| Day Percent Change: -0.8% Day Change: -0.36 | |
| Week Change: -0.29% Year-to-date Change: -41.1% | |
| OXM Links: Profile News Message Board | |
| Charts:- Daily , Weekly | |
| Add OXM to Watchlist: View: Get Complete OXM Trend Analysis ➞ | |
 | MYE Myers Industries Inc |
| Sector: Services & Goods | |
| SubSector: Packaging & Containers | |
| MarketCap: 610.53 Millions | |
| Recent Price: 16.74 Smart Investing & Trading Score: 50 | |
| Day Percent Change: -1.11% Day Change: -0.18 | |
| Week Change: -2.62% Year-to-date Change: 47.8% | |
| MYE Links: Profile News Message Board | |
| Charts:- Daily , Weekly | |
| Add MYE to Watchlist: View: Get Complete MYE Trend Analysis ➞ | |
 | BLMN Bloomin Brands Inc |
| Sector: Services & Goods | |
| SubSector: Restaurants | |
| MarketCap: 604.84 Millions | |
| Recent Price: 7.35 Smart Investing & Trading Score: 30 | |
| Day Percent Change: -3.06% Day Change: -0.22 | |
| Week Change: -4.13% Year-to-date Change: -41.0% | |
| BLMN Links: Profile News Message Board | |
| Charts:- Daily , Weekly | |
| Add BLMN to Watchlist: View: Get Complete BLMN Trend Analysis ➞ | |
 | UONEK Urban One, Inc. |
| Sector: Services & Goods | |
| SubSector: Broadcasting - Radio | |
| MarketCap: 601.795 Millions | |
| Recent Price: 0.79 Smart Investing & Trading Score: 100 | |
| Day Percent Change: -1.32% Day Change: -0.01 | |
| Week Change: 10.62% Year-to-date Change: -24.6% | |
| UONEK Links: Profile News Message Board | |
| Charts:- Daily , Weekly | |
| Add UONEK to Watchlist: View: Get Complete UONEK Trend Analysis ➞ | |
 | RERE ATRenew Inc ADR |
| Sector: Services & Goods | |
| SubSector: Internet Retail | |
| MarketCap: 575.69 Millions | |
| Recent Price: 4.72 Smart Investing & Trading Score: 40 | |
| Day Percent Change: 1.97% Day Change: 0.09 | |
| Week Change: 9.67% Year-to-date Change: 61.5% | |
| RERE Links: Profile News Message Board | |
| Charts:- Daily , Weekly | |
| Add RERE to Watchlist: View: Get Complete RERE Trend Analysis ➞ | |
 | ECX ECARX Holdings Inc |
| Sector: Services & Goods | |
| SubSector: Auto Parts | |
| MarketCap: 575.54 Millions | |
| Recent Price: 1.62 Smart Investing & Trading Score: 0 | |
| Day Percent Change: 1.85% Day Change: 0.03 | |
| Week Change: 3.77% Year-to-date Change: -21.8% | |
| ECX Links: Profile News Message Board | |
| Charts:- Daily , Weekly | |
| Add ECX to Watchlist: View: Get Complete ECX Trend Analysis ➞ | |
 | HZO Marinemax, Inc |
| Sector: Services & Goods | |
| SubSector: Specialty Retail | |
| MarketCap: 567.93 Millions | |
| Recent Price: 26.35 Smart Investing & Trading Score: 70 | |
| Day Percent Change: -1.35% Day Change: -0.35 | |
| Week Change: -0.74% Year-to-date Change: -11.6% | |
| HZO Links: Profile News Message Board | |
| Charts:- Daily , Weekly | |
| Add HZO to Watchlist: View: Get Complete HZO Trend Analysis ➞ | |
 | CAL Caleres Inc |
| Sector: Services & Goods | |
| SubSector: Apparel Retail | |
| MarketCap: 530.61 Millions | |
| Recent Price: 15.00 Smart Investing & Trading Score: 80 | |
| Day Percent Change: 0.48% Day Change: 0.07 | |
| Week Change: 1.03% Year-to-date Change: -35.8% | |
| CAL Links: Profile News Message Board | |
| Charts:- Daily , Weekly | |
| Add CAL to Watchlist: View: Get Complete CAL Trend Analysis ➞ | |
 | MNRO Monro Inc |
| Sector: Services & Goods | |
| SubSector: Auto Parts | |
| MarketCap: 530.03 Millions | |
| Recent Price: 16.58 Smart Investing & Trading Score: 100 | |
| Day Percent Change: -2.18% Day Change: -0.35 | |
| Week Change: -1.26% Year-to-date Change: -34.5% | |
| MNRO Links: Profile News Message Board | |
| Charts:- Daily , Weekly | |
| Add MNRO to Watchlist: View: Get Complete MNRO Trend Analysis ➞ | |
 | PTLO Portillos Inc |
| Sector: Services & Goods | |
| SubSector: Restaurants | |
| MarketCap: 513.87 Millions | |
| Recent Price: 7.08 Smart Investing & Trading Score: 10 | |
| Day Percent Change: -1.11% Day Change: -0.08 | |
| Week Change: -7.4% Year-to-date Change: -24.2% | |
| PTLO Links: Profile News Message Board | |
| Charts:- Daily , Weekly | |
| Add PTLO to Watchlist: View: Get Complete PTLO Trend Analysis ➞ | |
 | KRT Karat Packaging Inc |
| Sector: Services & Goods | |
| SubSector: Packaging & Containers | |
| MarketCap: 512.16 Millions | |
| Recent Price: 25.28 Smart Investing & Trading Score: 60 | |
| Day Percent Change: -0.2% Day Change: -0.05 | |
| Week Change: -1.89% Year-to-date Change: -15.1% | |
| KRT Links: Profile News Message Board | |
| Charts:- Daily , Weekly | |
| Add KRT to Watchlist: View: Get Complete KRT Trend Analysis ➞ | |
 | MLR Miller Industries Inc |
| Sector: Services & Goods | |
| SubSector: Auto Parts | |
| MarketCap: 478.72 Millions | |
| Recent Price: 42.09 Smart Investing & Trading Score: 50 | |
| Day Percent Change: -0.83% Day Change: -0.36 | |
| Week Change: 0% Year-to-date Change: -33.8% | |
| MLR Links: Profile News Message Board | |
| Charts:- Daily , Weekly | |
| Add MLR to Watchlist: View: Get Complete MLR Trend Analysis ➞ | |
 | HLLY Holley Inc |
| Sector: Services & Goods | |
| SubSector: Auto Parts | |
| MarketCap: 464.49 Millions | |
| Recent Price: 4.07 Smart Investing & Trading Score: 50 | |
| Day Percent Change: -2.16% Day Change: -0.08 | |
| Week Change: 0.28% Year-to-date Change: 20.2% | |
| HLLY Links: Profile News Message Board | |
| Charts:- Daily , Weekly | |
| Add HLLY to Watchlist: View: Get Complete HLLY Trend Analysis ➞ | |
 | LE Lands' End, Inc |
| Sector: Services & Goods | |
| SubSector: Apparel Retail | |
| MarketCap: 438.81 Millions | |
| Recent Price: 14.36 Smart Investing & Trading Score: 90 | |
| Day Percent Change: 2.74% Day Change: 0.35 | |
| Week Change: 3.06% Year-to-date Change: 0.0% | |
| LE Links: Profile News Message Board | |
| Charts:- Daily , Weekly | |
| Add LE to Watchlist: View: Get Complete LE Trend Analysis ➞ | |
 | PACK Ranpak Holdings Corp |
| Sector: Services & Goods | |
| SubSector: Packaging & Containers | |
| MarketCap: 435.31 Millions | |
| Recent Price: 5.28 Smart Investing & Trading Score: 90 | |
| Day Percent Change: -2.05% Day Change: -0.09 | |
| Week Change: 0.94% Year-to-date Change: -37.4% | |
| PACK Links: Profile News Message Board | |
| Charts:- Daily , Weekly | |
| Add PACK to Watchlist: View: Get Complete PACK Trend Analysis ➞ | |
 | NATH Nathan's Famous, Inc |
| Sector: Services & Goods | |
| SubSector: Restaurants | |
| MarketCap: 429.4 Millions | |
| Recent Price: 104.70 Smart Investing & Trading Score: 40 | |
| Day Percent Change: 0.69% Day Change: 0.74 | |
| Week Change: 3.37% Year-to-date Change: 37.8% | |
| NATH Links: Profile News Message Board | |
| Charts:- Daily , Weekly | |
| Add NATH to Watchlist: View: Get Complete NATH Trend Analysis ➞ | |
 | JOUT Johnson Outdoors Inc |
| Sector: Services & Goods | |
| SubSector: Leisure | |
| MarketCap: 418.81 Millions | |
| Recent Price: 40.32 Smart Investing & Trading Score: 80 | |
| Day Percent Change: 0.48% Day Change: 0.19 | |
| Week Change: 2.67% Year-to-date Change: 25.6% | |
| JOUT Links: Profile News Message Board | |
| Charts:- Daily , Weekly | |
| Add JOUT to Watchlist: View: Get Complete JOUT Trend Analysis ➞ | |
| For tabular summary view of above stock list: Summary View ➞ 0 - 25 , 25 - 50 , 50 - 75 , 75 - 100 , 100 - 125 , 125 - 150 , 150 - 175 , 175 - 200 , 200 - 225 , 225 - 250 , 250 - 275 , 275 - 300 , 300 - 325 , 325 - 350 , 350 - 375 , 375 - 400 | ||
| Click To Change The Sort Order: By Market Cap or Company Size Performance: Year-to-date, Week and Day | |
| Select Chart Type: | ||
|
Best Stocks Today 12Stocks.com |
© 2025 12Stocks.com Terms & Conditions Privacy Contact Us
All Information Provided Only For Education And Not To Be Used For Investing or Trading. See Terms & Conditions


One More Thing ... Get Best Stocks Delivered Daily!
Never Ever Miss A Move With Our Top Ten Stocks Lists
Find Best Stocks In Any Market - Bull or Bear Market
Take A Peek At Our Top Ten Stocks Lists: Daily, Weekly, Year-to-Date & Top Trends
Find Best Stocks In Any Market - Bull or Bear Market
Take A Peek At Our Top Ten Stocks Lists: Daily, Weekly, Year-to-Date & Top Trends
Consumer Services Stocks With Best Up Trends [0-bearish to 100-bullish]: Designer Brands[100], Childrens Place[100], PDD [100], Lennar Corp[100], D.R. Horton[100], Mohawk Industries[100], Signet Jewelers[100], Shoe Carnival[100], H World[100], Pulte [100], Lowe's Cos[100]
Best Consumer Services Stocks Year-to-Date:
WW [2341.73%], ThredUp [702.88%], China Yuchai[231.9%], Niu Technologies[159.78%], Viomi Technology[154.48%], Cooper-Standard [153.02%], Nova Lifestyle[146.73%], National Vision[130.71%], Solid Power[128.57%], XPeng [92.47%], Super [88.69%] Best Consumer Services Stocks This Week:
Macy's [27.61%], Guess [25.88%], NIO [24.49%], Kandi Technologies[24.41%], Fossil [20%], Kohl's Corp[19.29%], Cooper-Standard [18.47%], Flexsteel Industries[18.05%], XPeng [17.39%], Smart Share[14.53%], MINISO [13.58%] Best Consumer Services Stocks Daily:
Cooper-Standard [16.38%], XPeng [11.68%], Viomi Technology[9.39%], NIO [9.27%], Funko [9.16%], Designer Brands[9.15%], Hamilton Beach[7.24%], MINISO [6.38%], Genesco [5.5%], Flexsteel Industries[5.47%], Solid Power[4.85%]