
 Login Sign Up


| |||||
 |  | ||||

| 12Stocks.com Market Intelligence |
Best Consumer Services Stocks
| In a hurry? Services & Goods Stocks: Performance Trends Table, Stock Charts
Sort Consumer Services: Daily, Weekly, Year-to-Date, Market Cap & Trends. Filter Services & Goods stocks list by size: All Large Mid-Range Small |
| 12Stocks.com Consumer Services Stocks Performances & Trends Daily | |||||||||
|
|  The overall Smart Investing & Trading Score is 100 (0-bearish to 100-bullish) which puts Consumer Services sector in short term bullish trend. The Smart Investing & Trading Score from previous trading session is 100 and an improvement of trend continues.
| ||||||||
Here are the Smart Investing & Trading Scores of the most requested Consumer Services stocks at 12Stocks.com (click stock name for detailed review):
|


| Consider signing up for our daily 12Stocks.com "Best Stocks Newsletter". You will never ever miss a big stock move again! |
| 12Stocks.com: Investing in Consumer Services sector with Stocks | |
|
The following table helps investors and traders sort through current performance and trends (as measured by Smart Investing & Trading Score) of various
stocks in the Consumer Services sector. Quick View: Move mouse or cursor over stock symbol (ticker) to view short-term Technical chart and over stock name to view long term chart. Click on  to add stock symbol to your watchlist and to add stock symbol to your watchlist and  to view watchlist. Click on any ticker or stock name for detailed market intelligence report for that stock. to view watchlist. Click on any ticker or stock name for detailed market intelligence report for that stock. |
12Stocks.com Performance of Stocks in Consumer Services Sector
| Ticker | Stock Name | Watchlist | Category | Recent Price | Smart Investing & Trading Score | Change % | YTD Change% |
| CRI | Carters |   | Apparel Retail | 28.56 | 70 | -0.47% | -51.98% |
| WGO | Winnebago Industries | | Recreational | 35.98 | 90 | -1.94% | -27.23% |
| WOOF | Petco Health | | Specialty Retail | 3.99 | 70 | -3.83% | -14.44% |
| REAL | Therealreal | | Luxury Goods | 7.63 | 100 | -6.16% | -30.28% |
| AMWD | American Woodmark | | Furnishings, Fixtures & Appliances | 64.57 | 100 | 0.02% | -21.61% |
| OLPX | Olaplex | | Specialty Retail | 1.43 | 56 | 0.75% | -22.54% |
| XPEL | XPEL | | Auto Parts | 37.16 | 10 | -0.62% | -8.11% |
| KRUS | Kura Sushi | | Restaurants | 84.81 | 30 | 0.64% | -12.64% |
| ACEL | Accel Entertainment | | Gambling | 11.59 | 50 | 1.07% | 5.99% |
| BH | Biglari | | Restaurants | 310.87 | 30 | -2.13% | 16.25% |
| HEPS | D-MARKET Electronic | | Internet Retail | 2.76 | 20 | 1.78% | -5.61% |
| SMP | Standard Motor | | Auto Parts | 38.81 | 100 | -1.08% | 23.39% |
| GES | Guess | | Apparel Retail | 16.81 | 60 | -0.12% | 26.73% |
| HOV | Hovnanian Enterprises | | Residential Construction | 140.36 | 90 | -11.51% | -1.51% |
| BBW | Build A | | Specialty Retail | 60.81 | 100 | -0.95% | 19.56% |
| LQDT | Liquidity Services | | Internet Retail | 26.59 | 80 | 2.70% | -18.86% |
| LIND | Lindblad Expeditions | | Travel Services | 14.58 | 70 | 0.14% | 16.61% |
| BZH | Beazer Homes | | Residential Construction | 25.16 | 100 | -1.37% | -10.96% |
| PLOW | Douglas Dynamics | | Auto Parts | 33.67 | 50 | 0.83% | 41.11% |
| SLDP | Solid Power | | Auto Parts | 4.33 | 70 | 4.85% | 128.57% |
| BJRI | BJ's Restaurant | | Restaurants | 33.56 | 20 | -1.97% | -2.26% |
| MSC | Studio City | | Casinos | 4.82 | 20 | -4.75% | -14.87% |
| SFIX | Stitch Fix | | Apparel Retail | 5.29 | 100 | -1.57% | 16.47% |
| LVWR | LiveWire | | Auto Manufacturers | 3.85 | 20 | 4.43% | -21.62% |
| UXIN | Uxin | | Auto & Truck Dealerships | 3.49 | 40 | 2.77% | -19.87% |
| For chart view version of above stock list: Chart View ➞ 0 - 25 , 25 - 50 , 50 - 75 , 75 - 100 , 100 - 125 , 125 - 150 , 150 - 175 , 175 - 200 , 200 - 225 , 225 - 250 , 250 - 275 , 275 - 300 , 300 - 325 , 325 - 350 , 350 - 375 , 375 - 400 | ||
 | Click To Change The Sort Order: By Market Cap or Company Size Performance: Year-to-date, Week and Day |  |
|
Get the most comprehensive stock market coverage daily at 12Stocks.com ➞ Best Stocks Today ➞ Best Stocks Weekly ➞ Best Stocks Year-to-Date ➞ Best Stocks Trends ➞  Best Stocks Today 12Stocks.com Best Nasdaq Stocks ➞ Best S&P 500 Stocks ➞ Best Tech Stocks ➞ Best Biotech Stocks ➞ |
| Detailed Overview of Consumer Services Stocks |
| Consumer Services Technical Overview, Leaders & Laggards, Top Consumer Services ETF Funds & Detailed Consumer Services Stocks List, Charts, Trends & More |
| Consumer Services Sector: Technical Analysis, Trends & YTD Performance | |
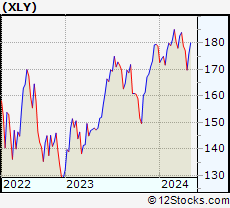
| Consumer Services sector is composed of stocks
from retail, entertainment, media/publishing, consumer goods
and services subsectors. Consumer Services sector, as represented by XLY, an exchange-traded fund [ETF] that holds basket of Consumer Services stocks (e.g, Walmart, Alibaba) is up by 0.83% and is currently underperforming the overall market by -6.89% year-to-date. Below is a quick view of Technical charts and trends: |
|
 XLY Weekly Chart |
|
| Long Term Trend: Very Good | |
| Medium Term Trend: Good | |
 XLY Daily Chart |
|
| Short Term Trend: Very Good | |
| Overall Trend Score: 100 | |
| YTD Performance: 0.83% | |
| **Trend Scores & Views Are Only For Educational Purposes And Not For Investing | |
| 12Stocks.com: Top Performing Consumer Services Sector Stocks | ||||||||||||||||||||||||||||||||||||||||||||||||
 The top performing Consumer Services sector stocks year to date are
Now, more recently, over last week, the top performing Consumer Services sector stocks on the move are


|
||||||||||||||||||||||||||||||||||||||||||||||||
| 12Stocks.com: Investing in Consumer Services Sector using Exchange Traded Funds | |
|
The following table shows list of key exchange traded funds (ETF) that
help investors track Consumer Services Index. For detailed view, check out our ETF Funds section of our website. Quick View: Move mouse or cursor over ETF symbol (ticker) to view short-term Technical chart and over ETF name to view long term chart. Click on ticker or stock name for detailed view. Click on to add stock symbol to your watchlist and to view watchlist. |
12Stocks.com List of ETFs that track Consumer Services Index
| Ticker | ETF Name | Watchlist | Recent Price | Smart Investing & Trading Score | Change % | Week % | Year-to-date % |
| 12Stocks.com: Charts, Trends, Fundamental Data and Performances of Consumer Services Stocks | |
|
We now take in-depth look at all Consumer Services stocks including charts, multi-period performances and overall trends (as measured by Smart Investing & Trading Score). One can sort Consumer Services stocks (click link to choose) by Daily, Weekly and by Year-to-Date performances. Also, one can sort by size of the company or by market capitalization. |
| Select Your Default Chart Type: | |||||
| |||||
| Click on stock symbol or name for detailed view. Click on to add stock symbol to your watchlist and to view watchlist. Quick View: Move mouse or cursor over "Daily" to quickly view daily Technical stock chart and over "Weekly" to view weekly Technical stock chart. | |||||

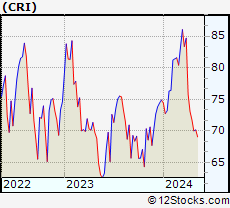 | CRI Carters Inc |
| Sector: Services & Goods | |
| SubSector: Apparel Retail | |
| MarketCap: 1047.06 Millions | |
| Recent Price: 28.56 Smart Investing & Trading Score: 70 | |
| Day Percent Change: -0.47% Day Change: -0.12 | |
| Week Change: -3.69% Year-to-date Change: -52.0% | |
| CRI Links: Profile News Message Board | |
| Charts:- Daily , Weekly | |
| Add CRI to Watchlist: View: Get Complete CRI Trend Analysis ➞ | |
 | WGO Winnebago Industries, Inc |
| Sector: Services & Goods | |
| SubSector: Recreational Vehicles | |
| MarketCap: 1031.24 Millions | |
| Recent Price: 35.98 Smart Investing & Trading Score: 90 | |
| Day Percent Change: -1.94% Day Change: -0.67 | |
| Week Change: -1.63% Year-to-date Change: -27.2% | |
| WGO Links: Profile News Message Board | |
| Charts:- Daily , Weekly | |
| Add WGO to Watchlist: View: Get Complete WGO Trend Analysis ➞ | |
 | WOOF Petco Health and Wellness Co Inc |
| Sector: Services & Goods | |
| SubSector: Specialty Retail | |
| MarketCap: 1028.55 Millions | |
| Recent Price: 3.99 Smart Investing & Trading Score: 70 | |
| Day Percent Change: -3.83% Day Change: -0.13 | |
| Week Change: -4.68% Year-to-date Change: -14.4% | |
| WOOF Links: Profile News Message Board | |
| Charts:- Daily , Weekly | |
| Add WOOF to Watchlist: View: Get Complete WOOF Trend Analysis ➞ | |
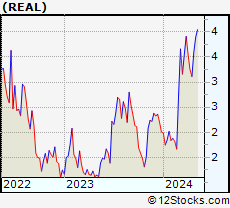 | REAL Therealreal Inc |
| Sector: Services & Goods | |
| SubSector: Luxury Goods | |
| MarketCap: 999.11 Millions | |
| Recent Price: 7.63 Smart Investing & Trading Score: 100 | |
| Day Percent Change: -6.16% Day Change: -0.5 | |
| Week Change: -3.18% Year-to-date Change: -30.3% | |
| REAL Links: Profile News Message Board | |
| Charts:- Daily , Weekly | |
| Add REAL to Watchlist: View: Get Complete REAL Trend Analysis ➞ | |
 | AMWD American Woodmark Corp |
| Sector: Services & Goods | |
| SubSector: Furnishings, Fixtures & Appliances | |
| MarketCap: 997.1 Millions | |
| Recent Price: 64.57 Smart Investing & Trading Score: 100 | |
| Day Percent Change: 0.02% Day Change: 0.01 | |
| Week Change: -3.62% Year-to-date Change: -21.6% | |
| AMWD Links: Profile News Message Board | |
| Charts:- Daily , Weekly | |
| Add AMWD to Watchlist: View: Get Complete AMWD Trend Analysis ➞ | |
 | OLPX Olaplex Holdings Inc |
| Sector: Services & Goods | |
| SubSector: Specialty Retail | |
| MarketCap: 993.95 Millions | |
| Recent Price: 1.43 Smart Investing & Trading Score: 56 | |
| Day Percent Change: 0.75% Day Change: 0.01 | |
| Week Change: -2.9% Year-to-date Change: -22.5% | |
| OLPX Links: Profile News Message Board | |
| Charts:- Daily , Weekly | |
| Add OLPX to Watchlist: View: Get Complete OLPX Trend Analysis ➞ | |
 | XPEL XPEL Inc |
| Sector: Services & Goods | |
| SubSector: Auto Parts | |
| MarketCap: 987.36 Millions | |
| Recent Price: 37.16 Smart Investing & Trading Score: 10 | |
| Day Percent Change: -0.62% Day Change: -0.23 | |
| Week Change: -2.73% Year-to-date Change: -8.1% | |
| XPEL Links: Profile News Message Board | |
| Charts:- Daily , Weekly | |
| Add XPEL to Watchlist: View: Get Complete XPEL Trend Analysis ➞ | |
 | KRUS Kura Sushi USA Inc |
| Sector: Services & Goods | |
| SubSector: Restaurants | |
| MarketCap: 985.17 Millions | |
| Recent Price: 84.81 Smart Investing & Trading Score: 30 | |
| Day Percent Change: 0.64% Day Change: 0.5 | |
| Week Change: 1.41% Year-to-date Change: -12.6% | |
| KRUS Links: Profile News Message Board | |
| Charts:- Daily , Weekly | |
| Add KRUS to Watchlist: View: Get Complete KRUS Trend Analysis ➞ | |
 | ACEL Accel Entertainment Inc |
| Sector: Services & Goods | |
| SubSector: Gambling | |
| MarketCap: 966.85 Millions | |
| Recent Price: 11.59 Smart Investing & Trading Score: 50 | |
| Day Percent Change: 1.07% Day Change: 0.12 | |
| Week Change: 1.52% Year-to-date Change: 6.0% | |
| ACEL Links: Profile News Message Board | |
| Charts:- Daily , Weekly | |
| Add ACEL to Watchlist: View: Get Complete ACEL Trend Analysis ➞ | |
 | BH Biglari Holdings Inc |
| Sector: Services & Goods | |
| SubSector: Restaurants | |
| MarketCap: 962.97 Millions | |
| Recent Price: 310.87 Smart Investing & Trading Score: 30 | |
| Day Percent Change: -2.13% Day Change: -6.43 | |
| Week Change: 2.55% Year-to-date Change: 16.3% | |
| BH Links: Profile News Message Board | |
| Charts:- Daily , Weekly | |
| Add BH to Watchlist: View: Get Complete BH Trend Analysis ➞ | |
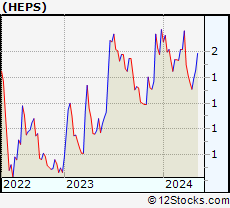 | HEPS D-MARKET Electronic Services & Trading ADR |
| Sector: Services & Goods | |
| SubSector: Internet Retail | |
| MarketCap: 903.08 Millions | |
| Recent Price: 2.76 Smart Investing & Trading Score: 20 | |
| Day Percent Change: 1.78% Day Change: 0.05 | |
| Week Change: -4.67% Year-to-date Change: -5.6% | |
| HEPS Links: Profile News Message Board | |
| Charts:- Daily , Weekly | |
| Add HEPS to Watchlist: View: Get Complete HEPS Trend Analysis ➞ | |
 | SMP Standard Motor Products, Inc |
| Sector: Services & Goods | |
| SubSector: Auto Parts | |
| MarketCap: 879.29 Millions | |
| Recent Price: 38.81 Smart Investing & Trading Score: 100 | |
| Day Percent Change: -1.08% Day Change: -0.41 | |
| Week Change: -4.39% Year-to-date Change: 23.4% | |
| SMP Links: Profile News Message Board | |
| Charts:- Daily , Weekly | |
| Add SMP to Watchlist: View: Get Complete SMP Trend Analysis ➞ | |
 | GES Guess Inc |
| Sector: Services & Goods | |
| SubSector: Apparel Retail | |
| MarketCap: 877 Millions | |
| Recent Price: 16.81 Smart Investing & Trading Score: 60 | |
| Day Percent Change: -0.12% Day Change: -0.02 | |
| Week Change: 25.88% Year-to-date Change: 26.7% | |
| GES Links: Profile News Message Board | |
| Charts:- Daily , Weekly | |
| Add GES to Watchlist: View: Get Complete GES Trend Analysis ➞ | |
 | HOV Hovnanian Enterprises, Inc |
| Sector: Services & Goods | |
| SubSector: Residential Construction | |
| MarketCap: 853.89 Millions | |
| Recent Price: 140.36 Smart Investing & Trading Score: 90 | |
| Day Percent Change: -11.51% Day Change: -17.15 | |
| Week Change: -15.6% Year-to-date Change: -1.5% | |
| HOV Links: Profile News Message Board | |
| Charts:- Daily , Weekly | |
| Add HOV to Watchlist: View: Get Complete HOV Trend Analysis ➞ | |
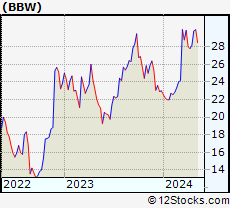 | BBW Build A Bear Workshop Inc |
| Sector: Services & Goods | |
| SubSector: Specialty Retail | |
| MarketCap: 853.54 Millions | |
| Recent Price: 60.81 Smart Investing & Trading Score: 100 | |
| Day Percent Change: -0.95% Day Change: -0.52 | |
| Week Change: -2.17% Year-to-date Change: 19.6% | |
| BBW Links: Profile News Message Board | |
| Charts:- Daily , Weekly | |
| Add BBW to Watchlist: View: Get Complete BBW Trend Analysis ➞ | |
 | LQDT Liquidity Services Inc |
| Sector: Services & Goods | |
| SubSector: Internet Retail | |
| MarketCap: 836.21 Millions | |
| Recent Price: 26.59 Smart Investing & Trading Score: 80 | |
| Day Percent Change: 2.7% Day Change: 0.69 | |
| Week Change: -0.08% Year-to-date Change: -18.9% | |
| LQDT Links: Profile News Message Board | |
| Charts:- Daily , Weekly | |
| Add LQDT to Watchlist: View: Get Complete LQDT Trend Analysis ➞ | |
 | LIND Lindblad Expeditions Holdings Inc |
| Sector: Services & Goods | |
| SubSector: Travel Services | |
| MarketCap: 803.21 Millions | |
| Recent Price: 14.58 Smart Investing & Trading Score: 70 | |
| Day Percent Change: 0.14% Day Change: 0.02 | |
| Week Change: 4.22% Year-to-date Change: 16.6% | |
| LIND Links: Profile News Message Board | |
| Charts:- Daily , Weekly | |
| Add LIND to Watchlist: View: Get Complete LIND Trend Analysis ➞ | |
 | BZH Beazer Homes USA Inc |
| Sector: Services & Goods | |
| SubSector: Residential Construction | |
| MarketCap: 780.6 Millions | |
| Recent Price: 25.16 Smart Investing & Trading Score: 100 | |
| Day Percent Change: -1.37% Day Change: -0.34 | |
| Week Change: -3.51% Year-to-date Change: -11.0% | |
| BZH Links: Profile News Message Board | |
| Charts:- Daily , Weekly | |
| Add BZH to Watchlist: View: Get Complete BZH Trend Analysis ➞ | |
 | PLOW Douglas Dynamics Inc |
| Sector: Services & Goods | |
| SubSector: Auto Parts | |
| MarketCap: 770.72 Millions | |
| Recent Price: 33.67 Smart Investing & Trading Score: 50 | |
| Day Percent Change: 0.83% Day Change: 0.27 | |
| Week Change: 1.97% Year-to-date Change: 41.1% | |
| PLOW Links: Profile News Message Board | |
| Charts:- Daily , Weekly | |
| Add PLOW to Watchlist: View: Get Complete PLOW Trend Analysis ➞ | |
 | SLDP Solid Power Inc |
| Sector: Services & Goods | |
| SubSector: Auto Parts | |
| MarketCap: 759.58 Millions | |
| Recent Price: 4.33 Smart Investing & Trading Score: 70 | |
| Day Percent Change: 4.85% Day Change: 0.2 | |
| Week Change: -19.55% Year-to-date Change: 128.6% | |
| SLDP Links: Profile News Message Board | |
| Charts:- Daily , Weekly | |
| Add SLDP to Watchlist: View: Get Complete SLDP Trend Analysis ➞ | |
 | BJRI BJ's Restaurant Inc |
| Sector: Services & Goods | |
| SubSector: Restaurants | |
| MarketCap: 742.49 Millions | |
| Recent Price: 33.56 Smart Investing & Trading Score: 20 | |
| Day Percent Change: -1.97% Day Change: -0.69 | |
| Week Change: -3.16% Year-to-date Change: -2.3% | |
| BJRI Links: Profile News Message Board | |
| Charts:- Daily , Weekly | |
| Add BJRI to Watchlist: View: Get Complete BJRI Trend Analysis ➞ | |
 | MSC Studio City International Holdings Ltd ADR |
| Sector: Services & Goods | |
| SubSector: Resorts & Casinos | |
| MarketCap: 741.47 Millions | |
| Recent Price: 4.82 Smart Investing & Trading Score: 20 | |
| Day Percent Change: -4.75% Day Change: -0.24 | |
| Week Change: 3.44% Year-to-date Change: -14.9% | |
| MSC Links: Profile News Message Board | |
| Charts:- Daily , Weekly | |
| Add MSC to Watchlist: View: Get Complete MSC Trend Analysis ➞ | |
 | SFIX Stitch Fix Inc |
| Sector: Services & Goods | |
| SubSector: Apparel Retail | |
| MarketCap: 737.25 Millions | |
| Recent Price: 5.29 Smart Investing & Trading Score: 100 | |
| Day Percent Change: -1.57% Day Change: -0.08 | |
| Week Change: 3.08% Year-to-date Change: 16.5% | |
| SFIX Links: Profile News Message Board | |
| Charts:- Daily , Weekly | |
| Add SFIX to Watchlist: View: Get Complete SFIX Trend Analysis ➞ | |
 | LVWR LiveWire Group Inc |
| Sector: Services & Goods | |
| SubSector: Auto Manufacturers | |
| MarketCap: 721.23 Millions | |
| Recent Price: 3.85 Smart Investing & Trading Score: 20 | |
| Day Percent Change: 4.43% Day Change: 0.16 | |
| Week Change: -0.79% Year-to-date Change: -21.6% | |
| LVWR Links: Profile News Message Board | |
| Charts:- Daily , Weekly | |
| Add LVWR to Watchlist: View: Get Complete LVWR Trend Analysis ➞ | |
 | UXIN Uxin Ltd ADR |
| Sector: Services & Goods | |
| SubSector: Auto & Truck Dealerships | |
| MarketCap: 721.11 Millions | |
| Recent Price: 3.49 Smart Investing & Trading Score: 40 | |
| Day Percent Change: 2.77% Day Change: 0.1 | |
| Week Change: -2.24% Year-to-date Change: -19.9% | |
| UXIN Links: Profile News Message Board | |
| Charts:- Daily , Weekly | |
| Add UXIN to Watchlist: View: Get Complete UXIN Trend Analysis ➞ | |
| For tabular summary view of above stock list: Summary View ➞ 0 - 25 , 25 - 50 , 50 - 75 , 75 - 100 , 100 - 125 , 125 - 150 , 150 - 175 , 175 - 200 , 200 - 225 , 225 - 250 , 250 - 275 , 275 - 300 , 300 - 325 , 325 - 350 , 350 - 375 , 375 - 400 | ||
| Click To Change The Sort Order: By Market Cap or Company Size Performance: Year-to-date, Week and Day | |
| Select Chart Type: | ||
|
Best Stocks Today 12Stocks.com |
© 2025 12Stocks.com Terms & Conditions Privacy Contact Us
All Information Provided Only For Education And Not To Be Used For Investing or Trading. See Terms & Conditions


One More Thing ... Get Best Stocks Delivered Daily!
Never Ever Miss A Move With Our Top Ten Stocks Lists
Find Best Stocks In Any Market - Bull or Bear Market
Take A Peek At Our Top Ten Stocks Lists: Daily, Weekly, Year-to-Date & Top Trends
Find Best Stocks In Any Market - Bull or Bear Market
Take A Peek At Our Top Ten Stocks Lists: Daily, Weekly, Year-to-Date & Top Trends
Consumer Services Stocks With Best Up Trends [0-bearish to 100-bullish]: Designer Brands[100], Childrens Place[100], PDD [100], Lennar Corp[100], D.R. Horton[100], Mohawk Industries[100], Signet Jewelers[100], Shoe Carnival[100], H World[100], Pulte [100], Lowe's Cos[100]
Best Consumer Services Stocks Year-to-Date:
WW [2341.73%], ThredUp [702.88%], China Yuchai[231.9%], Niu Technologies[159.78%], Viomi Technology[154.48%], Cooper-Standard [153.02%], Nova Lifestyle[146.73%], National Vision[130.71%], Solid Power[128.57%], XPeng [92.47%], Super [88.69%] Best Consumer Services Stocks This Week:
Macy's [27.61%], Guess [25.88%], NIO [24.49%], Kandi Technologies[24.41%], Fossil [20%], Kohl's Corp[19.29%], Cooper-Standard [18.47%], Flexsteel Industries[18.05%], XPeng [17.39%], Smart Share[14.53%], MINISO [13.58%] Best Consumer Services Stocks Daily:
Cooper-Standard [16.38%], XPeng [11.68%], Viomi Technology[9.39%], NIO [9.27%], Funko [9.16%], Designer Brands[9.15%], Hamilton Beach[7.24%], MINISO [6.38%], Genesco [5.5%], Flexsteel Industries[5.47%], Solid Power[4.85%]