
 Login Sign Up


| |||||
 |  | ||||

| 12Stocks.com Market Intelligence |
Best Consumer Services Stocks
| In a hurry? Services & Goods Stocks: Performance Trends Table, Stock Charts
Sort Consumer Services: Daily, Weekly, Year-to-Date, Market Cap & Trends. Filter Services & Goods stocks list by size: All Large Mid-Range Small |
| 12Stocks.com Consumer Services Stocks Performances & Trends Daily | |||||||||
|
|  The overall Smart Investing & Trading Score is 90 (0-bearish to 100-bullish) which puts Consumer Services sector in short term bullish trend. The Smart Investing & Trading Score from previous trading session is 50 and hence an improvement of trend.
| ||||||||
Here are the Smart Investing & Trading Scores of the most requested Consumer Services stocks at 12Stocks.com (click stock name for detailed review):
|


| Consider signing up for our daily 12Stocks.com "Best Stocks Newsletter". You will never ever miss a big stock move again! |
| 12Stocks.com: Investing in Consumer Services sector with Stocks | |
|
The following table helps investors and traders sort through current performance and trends (as measured by Smart Investing & Trading Score) of various
stocks in the Consumer Services sector. Quick View: Move mouse or cursor over stock symbol (ticker) to view short-term Technical chart and over stock name to view long term chart. Click on  to add stock symbol to your watchlist and to add stock symbol to your watchlist and  to view watchlist. Click on any ticker or stock name for detailed market intelligence report for that stock. to view watchlist. Click on any ticker or stock name for detailed market intelligence report for that stock. |
12Stocks.com Performance of Stocks in Consumer Services Sector
| Ticker | Stock Name | Watchlist | Category | Recent Price | Smart Investing & Trading Score | Change % | YTD Change% |
| MCW | Mister Car |   | Services | 5.91 | 50 | 2.72% | -18.93% |
| AVT | Avnet | | Retail | 53.34 | 80 | 1.37% | 3.32% |
| NXST | Nexstar Media | | Broadcasting | 202.05 | 100 | 2.48% | 30.86% |
| IAS | Integral Ad | | Advertising | 8.89 | 70 | 2.73% | -14.85% |
| AN | AutoNation | | Automobile | 205.37 | 90 | 4.40% | 20.92% |
| MSM | MSC Industrial | | Equipment | 86.39 | 40 | -18.22% | 19.43% |
| ACVA | ACV Auctions | | Auto & Truck Dealerships | 11.17 | 0 | 2.38% | -48.29% |
| WH | Wyndham Hotels | | Lodging | 87.61 | 70 | 0.99% | -12.68% |
| TNET | TriNet | | Services | 64.47 | 40 | 4.08% | -28.26% |
| STRA | Strategic Education | | Education | 78.11 | 40 | 29.85% | -15.20% |
| TXRH | Texas Roadhouse | | Restaurants | 176.71 | 0 | 55.27% | -1.33% |
| BCO | Brink s | | Security | 108.89 | 100 | 3.96% | 18.35% |
| MANU | Manchester United | | Sporting | 17.58 | 40 | -1.90% | 1.33% |
| KBR | KBR | | Services | 49.79 | 40 | 1.08% | -13.50% |
| SFM | Sprouts Farmers | | Grocery | 147.83 | 0 | 2.18% | 16.34% |
| INCR | Research | | Research | 1.73 | 80 | 3.43% | 8.81% |
| PFGC | Performance Food | | Restaurants | 98.36 | 60 | 1.44% | 16.33% |
| WNS | WNS () | | Services | 75.02 | 80 | 0.62% | 58.30% |
| LVWR | LiveWire | | Auto Manufacturers | 3.51 | 28 | -0.30% | -27.03% |
| M | Macy s | | Department | 12.73 | 80 | 5.03% | -22.61% |
| OLPX | Olaplex | | Specialty Retail | 1.36 | 56 | -1.65% | -21.39% |
| DFH | Dream Finders | | Residential Construction | 25.97 | 40 | 8.21% | 11.60% |
| LAUR | Laureate Education | | Education | 26.57 | 100 | 1.90% | 45.27% |
| PK | Park Hotels | | Lodging | 10.66 | 70 | 1.78% | -22.46% |
| VAC | Marriott Vacations | | Casinos | 73.62 | 60 | 2.56% | -16.12% |
| For chart view version of above stock list: Chart View ➞ 0 - 25 , 25 - 50 , 50 - 75 , 75 - 100 , 100 - 125 , 125 - 150 , 150 - 175 , 175 - 200 , 200 - 225 , 225 - 250 , 250 - 275 , 275 - 300 , 300 - 325 , 325 - 350 , 350 - 375 | ||
 | Click To Change The Sort Order: By Market Cap or Company Size Performance: Year-to-date, Week and Day |  |
|
Get the most comprehensive stock market coverage daily at 12Stocks.com ➞ Best Stocks Today ➞ Best Stocks Weekly ➞ Best Stocks Year-to-Date ➞ Best Stocks Trends ➞  Best Stocks Today 12Stocks.com Best Nasdaq Stocks ➞ Best S&P 500 Stocks ➞ Best Tech Stocks ➞ Best Biotech Stocks ➞ |
| Detailed Overview of Consumer Services Stocks |
| Consumer Services Technical Overview, Leaders & Laggards, Top Consumer Services ETF Funds & Detailed Consumer Services Stocks List, Charts, Trends & More |
| Consumer Services Sector: Technical Analysis, Trends & YTD Performance | |
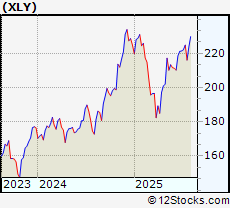
| Consumer Services sector is composed of stocks
from retail, entertainment, media/publishing, consumer goods
and services subsectors. Consumer Services sector, as represented by XLY, an exchange-traded fund [ETF] that holds basket of Consumer Services stocks (e.g, Walmart, Alibaba) is up by 1.56% and is currently underperforming the overall market by -8.24% year-to-date. Below is a quick view of Technical charts and trends: |
|
 XLY Weekly Chart |
|
| Long Term Trend: Very Good | |
| Medium Term Trend: Very Good | |
 XLY Daily Chart |
|
| Short Term Trend: Very Good | |
| Overall Trend Score: 90 | |
| YTD Performance: 1.56% | |
| **Trend Scores & Views Are Only For Educational Purposes And Not For Investing | |
| 12Stocks.com: Top Performing Consumer Services Sector Stocks | ||||||||||||||||||||||||||||||||||||||||||||||||
 The top performing Consumer Services sector stocks year to date are
Now, more recently, over last week, the top performing Consumer Services sector stocks on the move are


|
||||||||||||||||||||||||||||||||||||||||||||||||
| 12Stocks.com: Investing in Consumer Services Sector using Exchange Traded Funds | |
|
The following table shows list of key exchange traded funds (ETF) that
help investors track Consumer Services Index. For detailed view, check out our ETF Funds section of our website. Quick View: Move mouse or cursor over ETF symbol (ticker) to view short-term Technical chart and over ETF name to view long term chart. Click on ticker or stock name for detailed view. Click on to add stock symbol to your watchlist and to view watchlist. |
12Stocks.com List of ETFs that track Consumer Services Index
| Ticker | ETF Name | Watchlist | Recent Price | Smart Investing & Trading Score | Change % | Week % | Year-to-date % |
| XLY | Consumer Discret Sel | | 226.74 | 90 | 2.01 | 3.58 | 1.56% |
| RTH | Retail | | 245.88 | 90 | 0.63 | 2.04 | 9.67% |
| IYC | Consumer Services | | 101.87 | 90 | 1.68 | 2.71 | 6.29% |
| XRT | Retail | | 83.23 | 90 | 2.54 | 4.59 | 5.13% |
| IYK | Consumer Goods | | 70.15 | 40 | 0.37 | 1.9 | 8.01% |
| UCC | Consumer Services | | 48.63 | 90 | 2.96 | 7 | -5.38% |
| RETL | Retail Bull 3X | | 9.28 | 90 | 26.94 | 13.31 | -5.36% |
| SCC | Short Consumer Services | | 16.35 | 0 | -19.86 | -6.67 | -9.94% |
| UGE | Consumer Goods | | 19.12 | 50 | 1.05 | 5.18 | 6.94% |
| 12Stocks.com: Charts, Trends, Fundamental Data and Performances of Consumer Services Stocks | |
|
We now take in-depth look at all Consumer Services stocks including charts, multi-period performances and overall trends (as measured by Smart Investing & Trading Score). One can sort Consumer Services stocks (click link to choose) by Daily, Weekly and by Year-to-Date performances. Also, one can sort by size of the company or by market capitalization. |
| Select Your Default Chart Type: | |||||
| |||||
| Click on stock symbol or name for detailed view. Click on to add stock symbol to your watchlist and to view watchlist. Quick View: Move mouse or cursor over "Daily" to quickly view daily Technical stock chart and over "Weekly" to view weekly Technical stock chart. | |||||

 | MCW Mister Car Wash, Inc. |
| Sector: Services & Goods | |
| SubSector: Personal Services | |
| MarketCap: 2790 Millions | |
| Recent Price: 5.91 Smart Investing & Trading Score: 50 | |
| Day Percent Change: 2.72% Day Change: 0.18 | |
| Week Change: 5.35% Year-to-date Change: -18.9% | |
| MCW Links: Profile News Message Board | |
| Charts:- Daily , Weekly | |
| Add MCW to Watchlist: View: Get Complete MCW Trend Analysis ➞ | |
 | AVT Avnet, Inc. |
| Sector: Services & Goods | |
| SubSector: Electronics Wholesale | |
| MarketCap: 2776.33 Millions | |
| Recent Price: 53.34 Smart Investing & Trading Score: 80 | |
| Day Percent Change: 1.37% Day Change: 0.75 | |
| Week Change: 2.79% Year-to-date Change: 3.3% | |
| AVT Links: Profile News Message Board | |
| Charts:- Daily , Weekly | |
| Add AVT to Watchlist: View: Get Complete AVT Trend Analysis ➞ | |
 | NXST Nexstar Media Group, Inc. |
| Sector: Services & Goods | |
| SubSector: Broadcasting - TV | |
| MarketCap: 2763.73 Millions | |
| Recent Price: 202.05 Smart Investing & Trading Score: 100 | |
| Day Percent Change: 2.48% Day Change: 4.15 | |
| Week Change: 7.92% Year-to-date Change: 30.9% | |
| NXST Links: Profile News Message Board | |
| Charts:- Daily , Weekly | |
| Add NXST to Watchlist: View: Get Complete NXST Trend Analysis ➞ | |
 | IAS Integral Ad Science Holding Corp. |
| Sector: Services & Goods | |
| SubSector: Advertising Agencies | |
| MarketCap: 2760 Millions | |
| Recent Price: 8.89 Smart Investing & Trading Score: 70 | |
| Day Percent Change: 2.73% Day Change: 0.31 | |
| Week Change: 10.43% Year-to-date Change: -14.9% | |
| IAS Links: Profile News Message Board | |
| Charts:- Daily , Weekly | |
| Add IAS to Watchlist: View: Get Complete IAS Trend Analysis ➞ | |
 | AN AutoNation, Inc. |
| Sector: Services & Goods | |
| SubSector: Auto Dealerships | |
| MarketCap: 2732.61 Millions | |
| Recent Price: 205.37 Smart Investing & Trading Score: 90 | |
| Day Percent Change: 4.4% Day Change: 7.61 | |
| Week Change: 5.05% Year-to-date Change: 20.9% | |
| AN Links: Profile News Message Board | |
| Charts:- Daily , Weekly | |
| Add AN to Watchlist: View: Get Complete AN Trend Analysis ➞ | |
 | MSM MSC Industrial Direct Co., Inc. |
| Sector: Services & Goods | |
| SubSector: Industrial Equipment Wholesale | |
| MarketCap: 2701.88 Millions | |
| Recent Price: 86.39 Smart Investing & Trading Score: 40 | |
| Day Percent Change: -18.22% Day Change: -18.54 | |
| Week Change: 0.33% Year-to-date Change: 19.4% | |
| MSM Links: Profile News Message Board | |
| Charts:- Daily , Weekly | |
| Add MSM to Watchlist: View: Get Complete MSM Trend Analysis ➞ | |
 | ACVA ACV Auctions Inc. |
| Sector: Services & Goods | |
| SubSector: Auto & Truck Dealerships | |
| MarketCap: 2680 Millions | |
| Recent Price: 11.17 Smart Investing & Trading Score: 0 | |
| Day Percent Change: 2.38% Day Change: 0.44 | |
| Week Change: -21.06% Year-to-date Change: -48.3% | |
| ACVA Links: Profile News Message Board | |
| Charts:- Daily , Weekly | |
| Add ACVA to Watchlist: View: Get Complete ACVA Trend Analysis ➞ | |
 | WH Wyndham Hotels & Resorts, Inc. |
| Sector: Services & Goods | |
| SubSector: Lodging | |
| MarketCap: 2656.66 Millions | |
| Recent Price: 87.61 Smart Investing & Trading Score: 70 | |
| Day Percent Change: 0.99% Day Change: 0.76 | |
| Week Change: 3.07% Year-to-date Change: -12.7% | |
| WH Links: Profile News Message Board | |
| Charts:- Daily , Weekly | |
| Add WH to Watchlist: View: Get Complete WH Trend Analysis ➞ | |
 | TNET TriNet Group, Inc. |
| Sector: Services & Goods | |
| SubSector: Business Services | |
| MarketCap: 2648.72 Millions | |
| Recent Price: 64.47 Smart Investing & Trading Score: 40 | |
| Day Percent Change: 4.08% Day Change: 4.02 | |
| Week Change: 2.28% Year-to-date Change: -28.3% | |
| TNET Links: Profile News Message Board | |
| Charts:- Daily , Weekly | |
| Add TNET to Watchlist: View: Get Complete TNET Trend Analysis ➞ | |
 | STRA Strategic Education, Inc. |
| Sector: Services & Goods | |
| SubSector: Education & Training Services | |
| MarketCap: 2621.56 Millions | |
| Recent Price: 78.11 Smart Investing & Trading Score: 40 | |
| Day Percent Change: 29.85% Day Change: 22.39 | |
| Week Change: 4.37% Year-to-date Change: -15.2% | |
| STRA Links: Profile News Message Board | |
| Charts:- Daily , Weekly | |
| Add STRA to Watchlist: View: Get Complete STRA Trend Analysis ➞ | |
 | TXRH Texas Roadhouse, Inc. |
| Sector: Services & Goods | |
| SubSector: Restaurants | |
| MarketCap: 2569.4 Millions | |
| Recent Price: 176.71 Smart Investing & Trading Score: 0 | |
| Day Percent Change: 55.27% Day Change: 60.01 | |
| Week Change: -3.03% Year-to-date Change: -1.3% | |
| TXRH Links: Profile News Message Board | |
| Charts:- Daily , Weekly | |
| Add TXRH to Watchlist: View: Get Complete TXRH Trend Analysis ➞ | |
 | BCO The Brink s Company |
| Sector: Services & Goods | |
| SubSector: Security & Protection Services | |
| MarketCap: 2544.73 Millions | |
| Recent Price: 108.89 Smart Investing & Trading Score: 100 | |
| Day Percent Change: 3.96% Day Change: 4.16 | |
| Week Change: 22.82% Year-to-date Change: 18.4% | |
| BCO Links: Profile News Message Board | |
| Charts:- Daily , Weekly | |
| Add BCO to Watchlist: View: Get Complete BCO Trend Analysis ➞ | |
 | MANU Manchester United plc |
| Sector: Services & Goods | |
| SubSector: Sporting Activities | |
| MarketCap: 2537.74 Millions | |
| Recent Price: 17.58 Smart Investing & Trading Score: 40 | |
| Day Percent Change: -1.9% Day Change: -0.34 | |
| Week Change: -2.39% Year-to-date Change: 1.3% | |
| MANU Links: Profile News Message Board | |
| Charts:- Daily , Weekly | |
| Add MANU to Watchlist: View: Get Complete MANU Trend Analysis ➞ | |
 | KBR KBR, Inc. |
| Sector: Services & Goods | |
| SubSector: Technical Services | |
| MarketCap: 2526.1 Millions | |
| Recent Price: 49.79 Smart Investing & Trading Score: 40 | |
| Day Percent Change: 1.08% Day Change: 0.72 | |
| Week Change: 0.28% Year-to-date Change: -13.5% | |
| KBR Links: Profile News Message Board | |
| Charts:- Daily , Weekly | |
| Add KBR to Watchlist: View: Get Complete KBR Trend Analysis ➞ | |
 | SFM Sprouts Farmers Market, Inc. |
| Sector: Services & Goods | |
| SubSector: Grocery Stores | |
| MarketCap: 2495.85 Millions | |
| Recent Price: 147.83 Smart Investing & Trading Score: 0 | |
| Day Percent Change: 2.18% Day Change: 2.09 | |
| Week Change: -0.94% Year-to-date Change: 16.3% | |
| SFM Links: Profile News Message Board | |
| Charts:- Daily , Weekly | |
| Add SFM to Watchlist: View: Get Complete SFM Trend Analysis ➞ | |
 | INCR INC Research Holdings, Inc. |
| Sector: Services & Goods | |
| SubSector: Research Services | |
| MarketCap: 2486.94 Millions | |
| Recent Price: 1.73 Smart Investing & Trading Score: 80 | |
| Day Percent Change: 3.43% Day Change: 0.07 | |
| Week Change: 18.9% Year-to-date Change: 8.8% | |
| INCR Links: Profile News Message Board | |
| Charts:- Daily , Weekly | |
| Add INCR to Watchlist: View: Get Complete INCR Trend Analysis ➞ | |
 | PFGC Performance Food Group Company |
| Sector: Services & Goods | |
| SubSector: Restaurants | |
| MarketCap: 2457.5 Millions | |
| Recent Price: 98.36 Smart Investing & Trading Score: 60 | |
| Day Percent Change: 1.44% Day Change: 1.06 | |
| Week Change: 0.17% Year-to-date Change: 16.3% | |
| PFGC Links: Profile News Message Board | |
| Charts:- Daily , Weekly | |
| Add PFGC to Watchlist: View: Get Complete PFGC Trend Analysis ➞ | |
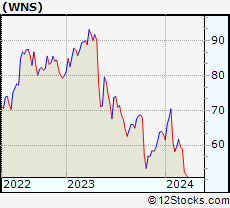 | WNS WNS (Holdings) Limited |
| Sector: Services & Goods | |
| SubSector: Business Services | |
| MarketCap: 2410.72 Millions | |
| Recent Price: 75.02 Smart Investing & Trading Score: 80 | |
| Day Percent Change: 0.62% Day Change: 0.31 | |
| Week Change: 0.25% Year-to-date Change: 58.3% | |
| WNS Links: Profile News Message Board | |
| Charts:- Daily , Weekly | |
| Add WNS to Watchlist: View: Get Complete WNS Trend Analysis ➞ | |
 | LVWR LiveWire Group, Inc. |
| Sector: Services & Goods | |
| SubSector: Auto Manufacturers | |
| MarketCap: 2400 Millions | |
| Recent Price: 3.51 Smart Investing & Trading Score: 28 | |
| Day Percent Change: -0.3% Day Change: -0.02 | |
| Week Change: 4.15% Year-to-date Change: -27.0% | |
| LVWR Links: Profile News Message Board | |
| Charts:- Daily , Weekly | |
| Add LVWR to Watchlist: View: Get Complete LVWR Trend Analysis ➞ | |
 | M Macy s, Inc. |
| Sector: Services & Goods | |
| SubSector: Department Stores | |
| MarketCap: 2391.72 Millions | |
| Recent Price: 12.73 Smart Investing & Trading Score: 80 | |
| Day Percent Change: 5.03% Day Change: 0.77 | |
| Week Change: 6.08% Year-to-date Change: -22.6% | |
| M Links: Profile News Message Board | |
| Charts:- Daily , Weekly | |
| Add M to Watchlist: View: Get Complete M Trend Analysis ➞ | |
 | OLPX Olaplex Holdings, Inc. |
| Sector: Services & Goods | |
| SubSector: Specialty Retail | |
| MarketCap: 2340 Millions | |
| Recent Price: 1.36 Smart Investing & Trading Score: 56 | |
| Day Percent Change: -1.65% Day Change: -0.04 | |
| Week Change: -4.9% Year-to-date Change: -21.4% | |
| OLPX Links: Profile News Message Board | |
| Charts:- Daily , Weekly | |
| Add OLPX to Watchlist: View: Get Complete OLPX Trend Analysis ➞ | |
 | DFH Dream Finders Homes, Inc. |
| Sector: Services & Goods | |
| SubSector: Residential Construction | |
| MarketCap: 2270 Millions | |
| Recent Price: 25.97 Smart Investing & Trading Score: 40 | |
| Day Percent Change: 8.21% Day Change: 2.55 | |
| Week Change: -1.1% Year-to-date Change: 11.6% | |
| DFH Links: Profile News Message Board | |
| Charts:- Daily , Weekly | |
| Add DFH to Watchlist: View: Get Complete DFH Trend Analysis ➞ | |
 | LAUR Laureate Education, Inc. |
| Sector: Services & Goods | |
| SubSector: Education & Training Services | |
| MarketCap: 2258.56 Millions | |
| Recent Price: 26.57 Smart Investing & Trading Score: 100 | |
| Day Percent Change: 1.9% Day Change: 0.29 | |
| Week Change: 12.11% Year-to-date Change: 45.3% | |
| LAUR Links: Profile News Message Board | |
| Charts:- Daily , Weekly | |
| Add LAUR to Watchlist: View: Get Complete LAUR Trend Analysis ➞ | |
 | PK Park Hotels & Resorts Inc. |
| Sector: Services & Goods | |
| SubSector: Lodging | |
| MarketCap: 2221.06 Millions | |
| Recent Price: 10.66 Smart Investing & Trading Score: 70 | |
| Day Percent Change: 1.78% Day Change: 0.27 | |
| Week Change: 1.91% Year-to-date Change: -22.5% | |
| PK Links: Profile News Message Board | |
| Charts:- Daily , Weekly | |
| Add PK to Watchlist: View: Get Complete PK Trend Analysis ➞ | |
 | VAC Marriott Vacations Worldwide Corporation |
| Sector: Services & Goods | |
| SubSector: Resorts & Casinos | |
| MarketCap: 2173.54 Millions | |
| Recent Price: 73.62 Smart Investing & Trading Score: 60 | |
| Day Percent Change: 2.56% Day Change: 1.85 | |
| Week Change: 0.88% Year-to-date Change: -16.1% | |
| VAC Links: Profile News Message Board | |
| Charts:- Daily , Weekly | |
| Add VAC to Watchlist: View: Get Complete VAC Trend Analysis ➞ | |
| For tabular summary view of above stock list: Summary View ➞ 0 - 25 , 25 - 50 , 50 - 75 , 75 - 100 , 100 - 125 , 125 - 150 , 150 - 175 , 175 - 200 , 200 - 225 , 225 - 250 , 250 - 275 , 275 - 300 , 300 - 325 , 325 - 350 , 350 - 375 | ||
| Click To Change The Sort Order: By Market Cap or Company Size Performance: Year-to-date, Week and Day | |
| Select Chart Type: | ||
|
Best Stocks Today 12Stocks.com |
© 2025 12Stocks.com Terms & Conditions Privacy Contact Us
All Information Provided Only For Education And Not To Be Used For Investing or Trading. See Terms & Conditions


One More Thing ... Get Best Stocks Delivered Daily!
Never Ever Miss A Move With Our Top Ten Stocks Lists
Find Best Stocks In Any Market - Bull or Bear Market
Take A Peek At Our Top Ten Stocks Lists: Daily, Weekly, Year-to-Date & Top Trends
Find Best Stocks In Any Market - Bull or Bear Market
Take A Peek At Our Top Ten Stocks Lists: Daily, Weekly, Year-to-Date & Top Trends
Consumer Services Stocks With Best Up Trends [0-bearish to 100-bullish]: VSE [100], eBay [100], Kratos Defense[100], Graham [100], CompX [100], Fastenal [100], Jacobs Engineering[100], Willdan [100], Gray Television[100], Williams-Sonoma [100], Rush Enterprises[100]
Best Consumer Services Stocks Year-to-Date:
ThredUp [640.29%], Vivid Seats[278.19%], Willdan [211.45%], Kratos Defense[162.09%], Roblox [123.87%], National Vision[120.92%], Altisource Portfolio[99.84%], Noodles & [90.05%], Gray Television[89.96%], QuantumScape [80.15%], PaySign [80.13%] Best Consumer Services Stocks This Week:
Vivid Seats[1616.67%], Holley [66.18%], Money[64.55%], Myriad Genetics[55.81%], Grocery Outlet[42.09%], RealReal [33.98%], CompX [30.87%], Willdan [30.08%], comScore [29.36%], Arhaus [27.48%], Gray Television[26.37%] Best Consumer Services Stocks Daily:
CareDx [185.69%], Wingstop [150.46%], National CineMedia[112.46%], VSE [69.41%], Burlington Stores[66.03%], Myriad Genetics[64.88%], Costco Wholesale[58.1%], Daily Journal[57.5%], Texas Roadhouse[55.27%], Royal Caribbean[53.63%], CRA [53.26%]