
 Login Sign Up


| |||||
 |  | ||||

| 12Stocks.com Market Intelligence |
Best Consumer Services Stocks
| In a hurry? Services & Goods Stocks: Performance Trends Table, Stock Charts
Sort Consumer Services: Daily, Weekly, Year-to-Date, Market Cap & Trends. Filter Services & Goods stocks list by size: All Large Mid-Range Small |
| 12Stocks.com Consumer Services Stocks Performances & Trends Daily | |||||||||
|
|  The overall Smart Investing & Trading Score is 100 (0-bearish to 100-bullish) which puts Consumer Services sector in short term bullish trend. The Smart Investing & Trading Score from previous trading session is 100 and an improvement of trend continues.
| ||||||||
Here are the Smart Investing & Trading Scores of the most requested Consumer Services stocks at 12Stocks.com (click stock name for detailed review):
|


| Consider signing up for our daily 12Stocks.com "Best Stocks Newsletter". You will never ever miss a big stock move again! |
| 12Stocks.com: Investing in Consumer Services sector with Stocks | |
|
The following table helps investors and traders sort through current performance and trends (as measured by Smart Investing & Trading Score) of various
stocks in the Consumer Services sector. Quick View: Move mouse or cursor over stock symbol (ticker) to view short-term Technical chart and over stock name to view long term chart. Click on  to add stock symbol to your watchlist and to add stock symbol to your watchlist and  to view watchlist. Click on any ticker or stock name for detailed market intelligence report for that stock. to view watchlist. Click on any ticker or stock name for detailed market intelligence report for that stock. |
12Stocks.com Performance of Stocks in Consumer Services Sector
| Ticker | Stock Name | Watchlist | Category | Recent Price | Smart Investing & Trading Score | Change % | YTD Change% |
| GLBE | Global E |   | Internet Retail | 33.46 | 90 | -0.57% | -41.94% |
| THO | Thor Industries | | Recreational | 109.60 | 100 | -0.60% | 11.72% |
| LEA | Lear Corp | | Auto Parts | 110.00 | 90 | 0.04% | 10.72% |
| MTH | Meritage Homes | | Residential Construction | 77.69 | 100 | -0.13% | -1.37% |
| MTN | Vail Resorts | | Casinos | 163.80 | 30 | 1.97% | -13.83% |
| VFC | VF Corp | | Apparel Manufacturing | 14.81 | 80 | -1.07% | -42.30% |
| LCID | Lucid | | Auto Manufacturers | 1.98 | 100 | 0.00% | -30.79% |
| BOOT | Boot Barn | | Apparel Retail | 177.77 | 90 | 0.34% | 11.55% |
| CZR | Caesars Entertainment | | Casinos | 25.91 | 70 | 0.62% | -28.13% |
| CHH | Choice Hotels | | Lodging | 119.58 | 20 | 0.65% | -14.99% |
| ETSY | Etsy | | Internet Retail | 53.65 | 60 | 2.76% | -2.29% |
| WHR | Whirlpool Corp | | Furnishings, Fixtures & Appliances | 94.71 | 70 | 2.91% | -6.28% |
| ABG | Asbury Automotive | | Auto & Truck Dealerships | 251.54 | 80 | -0.29% | -1.19% |
| REYN | Reynolds Consumer | | Packaging | 23.21 | 100 | -0.13% | -12.82% |
| DORM | Dorman Products | | Auto Parts | 161.79 | 80 | -0.60% | 18.19% |
| VVV | Valvoline | | Auto & Truck Dealerships | 38.78 | 60 | -0.05% | 7.46% |
| SLGN | Silgan | | Packaging | 46.92 | 20 | -0.15% | -10.46% |
| SEE | Sealed Air | | Packaging | 32.47 | 90 | 1.44% | -5.01% |
| DOOO | BRP | | Recreational | 62.98 | 80 | -1.86% | 9.69% |
| CROX | Crocs | | Footwear & Accessories | 87.20 | 30 | 0.11% | -23.48% |
| M | Macy's | | Department | 17.33 | 100 | 0.52% | 14.49% |
| RH | RH | | Specialty Retail | 225.67 | 100 | 1.01% | -44.41% |
| KBH | KB Home | | Residential Construction | 63.55 | 100 | -1.05% | -6.65% |
| FTDR | Frontdoor | | Services | 60.75 | 90 | -0.32% | 7.32% |
| SON | Sonoco Products | | Packaging | 47.25 | 40 | 1.30% | -1.29% |
| For chart view version of above stock list: Chart View ➞ 0 - 25 , 25 - 50 , 50 - 75 , 75 - 100 , 100 - 125 , 125 - 150 , 150 - 175 , 175 - 200 , 200 - 225 , 225 - 250 , 250 - 275 , 275 - 300 , 300 - 325 , 325 - 350 , 350 - 375 , 375 - 400 | ||
 | Click To Change The Sort Order: By Market Cap or Company Size Performance: Year-to-date, Week and Day |  |
|
Get the most comprehensive stock market coverage daily at 12Stocks.com ➞ Best Stocks Today ➞ Best Stocks Weekly ➞ Best Stocks Year-to-Date ➞ Best Stocks Trends ➞  Best Stocks Today 12Stocks.com Best Nasdaq Stocks ➞ Best S&P 500 Stocks ➞ Best Tech Stocks ➞ Best Biotech Stocks ➞ |
| Detailed Overview of Consumer Services Stocks |
| Consumer Services Technical Overview, Leaders & Laggards, Top Consumer Services ETF Funds & Detailed Consumer Services Stocks List, Charts, Trends & More |
| Consumer Services Sector: Technical Analysis, Trends & YTD Performance | |
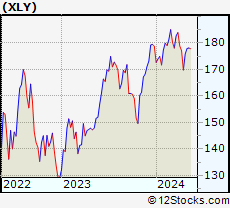
| Consumer Services sector is composed of stocks
from retail, entertainment, media/publishing, consumer goods
and services subsectors. Consumer Services sector, as represented by XLY, an exchange-traded fund [ETF] that holds basket of Consumer Services stocks (e.g, Walmart, Alibaba) is up by 0.83% and is currently underperforming the overall market by -6.89% year-to-date. Below is a quick view of Technical charts and trends: |
|
 XLY Weekly Chart |
|
| Long Term Trend: Very Good | |
| Medium Term Trend: Good | |
 XLY Daily Chart |
|
| Short Term Trend: Very Good | |
| Overall Trend Score: 100 | |
| YTD Performance: 0.83% | |
| **Trend Scores & Views Are Only For Educational Purposes And Not For Investing | |
| 12Stocks.com: Top Performing Consumer Services Sector Stocks | ||||||||||||||||||||||||||||||||||||||||||||||||
 The top performing Consumer Services sector stocks year to date are
Now, more recently, over last week, the top performing Consumer Services sector stocks on the move are


|
||||||||||||||||||||||||||||||||||||||||||||||||
| 12Stocks.com: Investing in Consumer Services Sector using Exchange Traded Funds | |
|
The following table shows list of key exchange traded funds (ETF) that
help investors track Consumer Services Index. For detailed view, check out our ETF Funds section of our website. Quick View: Move mouse or cursor over ETF symbol (ticker) to view short-term Technical chart and over ETF name to view long term chart. Click on ticker or stock name for detailed view. Click on to add stock symbol to your watchlist and to view watchlist. |
12Stocks.com List of ETFs that track Consumer Services Index
| Ticker | ETF Name | Watchlist | Recent Price | Smart Investing & Trading Score | Change % | Week % | Year-to-date % |
| 12Stocks.com: Charts, Trends, Fundamental Data and Performances of Consumer Services Stocks | |
|
We now take in-depth look at all Consumer Services stocks including charts, multi-period performances and overall trends (as measured by Smart Investing & Trading Score). One can sort Consumer Services stocks (click link to choose) by Daily, Weekly and by Year-to-Date performances. Also, one can sort by size of the company or by market capitalization. |
| Select Your Default Chart Type: | |||||
| |||||
| Click on stock symbol or name for detailed view. Click on to add stock symbol to your watchlist and to view watchlist. Quick View: Move mouse or cursor over "Daily" to quickly view daily Technical stock chart and over "Weekly" to view weekly Technical stock chart. | |||||

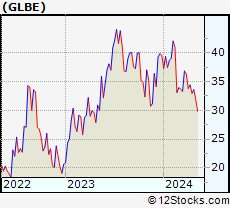 | GLBE Global E Online Ltd |
| Sector: Services & Goods | |
| SubSector: Internet Retail | |
| MarketCap: 6062.4 Millions | |
| Recent Price: 33.46 Smart Investing & Trading Score: 90 | |
| Day Percent Change: -0.57% Day Change: -0.18 | |
| Week Change: 3.46% Year-to-date Change: -41.9% | |
| GLBE Links: Profile News Message Board | |
| Charts:- Daily , Weekly | |
| Add GLBE to Watchlist: View: Get Complete GLBE Trend Analysis ➞ | |
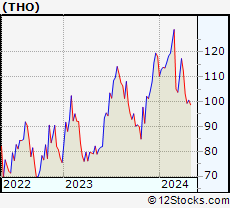 | THO Thor Industries, Inc |
| Sector: Services & Goods | |
| SubSector: Recreational Vehicles | |
| MarketCap: 5976.36 Millions | |
| Recent Price: 109.60 Smart Investing & Trading Score: 100 | |
| Day Percent Change: -0.6% Day Change: -0.63 | |
| Week Change: -3.16% Year-to-date Change: 11.7% | |
| THO Links: Profile News Message Board | |
| Charts:- Daily , Weekly | |
| Add THO to Watchlist: View: Get Complete THO Trend Analysis ➞ | |
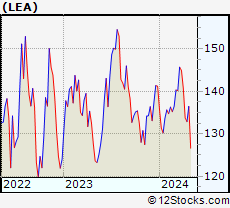 | LEA Lear Corp |
| Sector: Services & Goods | |
| SubSector: Auto Parts | |
| MarketCap: 5908.54 Millions | |
| Recent Price: 110.00 Smart Investing & Trading Score: 90 | |
| Day Percent Change: 0.04% Day Change: 0.04 | |
| Week Change: -0.22% Year-to-date Change: 10.7% | |
| LEA Links: Profile News Message Board | |
| Charts:- Daily , Weekly | |
| Add LEA to Watchlist: View: Get Complete LEA Trend Analysis ➞ | |
 | MTH Meritage Homes Corp |
| Sector: Services & Goods | |
| SubSector: Residential Construction | |
| MarketCap: 5893.86 Millions | |
| Recent Price: 77.69 Smart Investing & Trading Score: 100 | |
| Day Percent Change: -0.13% Day Change: -0.1 | |
| Week Change: -2.74% Year-to-date Change: -1.4% | |
| MTH Links: Profile News Message Board | |
| Charts:- Daily , Weekly | |
| Add MTH to Watchlist: View: Get Complete MTH Trend Analysis ➞ | |
 | MTN Vail Resorts Inc |
| Sector: Services & Goods | |
| SubSector: Resorts & Casinos | |
| MarketCap: 5866.36 Millions | |
| Recent Price: 163.80 Smart Investing & Trading Score: 30 | |
| Day Percent Change: 1.97% Day Change: 3.03 | |
| Week Change: 3.06% Year-to-date Change: -13.8% | |
| MTN Links: Profile News Message Board | |
| Charts:- Daily , Weekly | |
| Add MTN to Watchlist: View: Get Complete MTN Trend Analysis ➞ | |
 | VFC VF Corp |
| Sector: Services & Goods | |
| SubSector: Apparel Manufacturing | |
| MarketCap: 5859.25 Millions | |
| Recent Price: 14.81 Smart Investing & Trading Score: 80 | |
| Day Percent Change: -1.07% Day Change: -0.16 | |
| Week Change: 8.1% Year-to-date Change: -42.3% | |
| VFC Links: Profile News Message Board | |
| Charts:- Daily , Weekly | |
| Add VFC to Watchlist: View: Get Complete VFC Trend Analysis ➞ | |
 | LCID Lucid Group Inc |
| Sector: Services & Goods | |
| SubSector: Auto Manufacturers | |
| MarketCap: 5656.46 Millions | |
| Recent Price: 1.98 Smart Investing & Trading Score: 100 | |
| Day Percent Change: 0% Day Change: 0 | |
| Week Change: -7.11% Year-to-date Change: -30.8% | |
| LCID Links: Profile News Message Board | |
| Charts:- Daily , Weekly | |
| Add LCID to Watchlist: View: Get Complete LCID Trend Analysis ➞ | |
 | BOOT Boot Barn Holdings Inc |
| Sector: Services & Goods | |
| SubSector: Apparel Retail | |
| MarketCap: 5578.54 Millions | |
| Recent Price: 177.77 Smart Investing & Trading Score: 90 | |
| Day Percent Change: 0.34% Day Change: 0.58 | |
| Week Change: 4.23% Year-to-date Change: 11.6% | |
| BOOT Links: Profile News Message Board | |
| Charts:- Daily , Weekly | |
| Add BOOT to Watchlist: View: Get Complete BOOT Trend Analysis ➞ | |
 | CZR Caesars Entertainment Inc |
| Sector: Services & Goods | |
| SubSector: Resorts & Casinos | |
| MarketCap: 5478.5 Millions | |
| Recent Price: 25.91 Smart Investing & Trading Score: 70 | |
| Day Percent Change: 0.62% Day Change: 0.16 | |
| Week Change: -3.14% Year-to-date Change: -28.1% | |
| CZR Links: Profile News Message Board | |
| Charts:- Daily , Weekly | |
| Add CZR to Watchlist: View: Get Complete CZR Trend Analysis ➞ | |
 | CHH Choice Hotels International, Inc |
| Sector: Services & Goods | |
| SubSector: Lodging | |
| MarketCap: 5405.53 Millions | |
| Recent Price: 119.58 Smart Investing & Trading Score: 20 | |
| Day Percent Change: 0.65% Day Change: 0.78 | |
| Week Change: -2.27% Year-to-date Change: -15.0% | |
| CHH Links: Profile News Message Board | |
| Charts:- Daily , Weekly | |
| Add CHH to Watchlist: View: Get Complete CHH Trend Analysis ➞ | |
 | ETSY Etsy Inc |
| Sector: Services & Goods | |
| SubSector: Internet Retail | |
| MarketCap: 5357.81 Millions | |
| Recent Price: 53.65 Smart Investing & Trading Score: 60 | |
| Day Percent Change: 2.76% Day Change: 1.44 | |
| Week Change: -14.38% Year-to-date Change: -2.3% | |
| ETSY Links: Profile News Message Board | |
| Charts:- Daily , Weekly | |
| Add ETSY to Watchlist: View: Get Complete ETSY Trend Analysis ➞ | |
 | WHR Whirlpool Corp |
| Sector: Services & Goods | |
| SubSector: Furnishings, Fixtures & Appliances | |
| MarketCap: 5278.67 Millions | |
| Recent Price: 94.71 Smart Investing & Trading Score: 70 | |
| Day Percent Change: 2.91% Day Change: 2.68 | |
| Week Change: 1.13% Year-to-date Change: -6.3% | |
| WHR Links: Profile News Message Board | |
| Charts:- Daily , Weekly | |
| Add WHR to Watchlist: View: Get Complete WHR Trend Analysis ➞ | |
 | ABG Asbury Automotive Group Inc |
| Sector: Services & Goods | |
| SubSector: Auto & Truck Dealerships | |
| MarketCap: 5062.22 Millions | |
| Recent Price: 251.54 Smart Investing & Trading Score: 80 | |
| Day Percent Change: -0.29% Day Change: -0.71 | |
| Week Change: -0.85% Year-to-date Change: -1.2% | |
| ABG Links: Profile News Message Board | |
| Charts:- Daily , Weekly | |
| Add ABG to Watchlist: View: Get Complete ABG Trend Analysis ➞ | |
 | REYN Reynolds Consumer Products Inc |
| Sector: Services & Goods | |
| SubSector: Packaging & Containers | |
| MarketCap: 5003.63 Millions | |
| Recent Price: 23.21 Smart Investing & Trading Score: 100 | |
| Day Percent Change: -0.13% Day Change: -0.03 | |
| Week Change: -0.26% Year-to-date Change: -12.8% | |
| REYN Links: Profile News Message Board | |
| Charts:- Daily , Weekly | |
| Add REYN to Watchlist: View: Get Complete REYN Trend Analysis ➞ | |
 | DORM Dorman Products Inc |
| Sector: Services & Goods | |
| SubSector: Auto Parts | |
| MarketCap: 4997.54 Millions | |
| Recent Price: 161.79 Smart Investing & Trading Score: 80 | |
| Day Percent Change: -0.6% Day Change: -0.93 | |
| Week Change: -1.73% Year-to-date Change: 18.2% | |
| DORM Links: Profile News Message Board | |
| Charts:- Daily , Weekly | |
| Add DORM to Watchlist: View: Get Complete DORM Trend Analysis ➞ | |
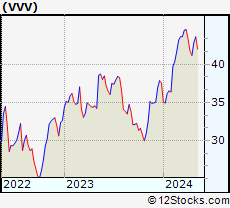 | VVV Valvoline Inc |
| Sector: Services & Goods | |
| SubSector: Auto & Truck Dealerships | |
| MarketCap: 4962.56 Millions | |
| Recent Price: 38.78 Smart Investing & Trading Score: 60 | |
| Day Percent Change: -0.05% Day Change: -0.02 | |
| Week Change: -1.32% Year-to-date Change: 7.5% | |
| VVV Links: Profile News Message Board | |
| Charts:- Daily , Weekly | |
| Add VVV to Watchlist: View: Get Complete VVV Trend Analysis ➞ | |
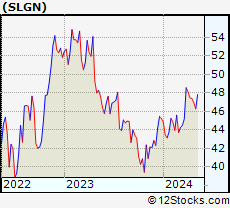 | SLGN Silgan Holdings Inc |
| Sector: Services & Goods | |
| SubSector: Packaging & Containers | |
| MarketCap: 4832.88 Millions | |
| Recent Price: 46.92 Smart Investing & Trading Score: 20 | |
| Day Percent Change: -0.15% Day Change: -0.07 | |
| Week Change: -1.6% Year-to-date Change: -10.5% | |
| SLGN Links: Profile News Message Board | |
| Charts:- Daily , Weekly | |
| Add SLGN to Watchlist: View: Get Complete SLGN Trend Analysis ➞ | |
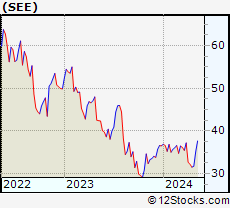 | SEE Sealed Air Corp |
| Sector: Services & Goods | |
| SubSector: Packaging & Containers | |
| MarketCap: 4815.89 Millions | |
| Recent Price: 32.47 Smart Investing & Trading Score: 90 | |
| Day Percent Change: 1.44% Day Change: 0.45 | |
| Week Change: 6.3% Year-to-date Change: -5.0% | |
| SEE Links: Profile News Message Board | |
| Charts:- Daily , Weekly | |
| Add SEE to Watchlist: View: Get Complete SEE Trend Analysis ➞ | |
 | DOOO BRP Inc |
| Sector: Services & Goods | |
| SubSector: Recreational Vehicles | |
| MarketCap: 4783.47 Millions | |
| Recent Price: 62.98 Smart Investing & Trading Score: 80 | |
| Day Percent Change: -1.86% Day Change: -1.05 | |
| Week Change: -3.77% Year-to-date Change: 9.7% | |
| DOOO Links: Profile News Message Board | |
| Charts:- Daily , Weekly | |
| Add DOOO to Watchlist: View: Get Complete DOOO Trend Analysis ➞ | |
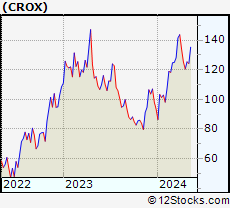 | CROX Crocs Inc |
| Sector: Services & Goods | |
| SubSector: Footwear & Accessories | |
| MarketCap: 4721.67 Millions | |
| Recent Price: 87.20 Smart Investing & Trading Score: 30 | |
| Day Percent Change: 0.11% Day Change: 0.09 | |
| Week Change: -0.26% Year-to-date Change: -23.5% | |
| CROX Links: Profile News Message Board | |
| Charts:- Daily , Weekly | |
| Add CROX to Watchlist: View: Get Complete CROX Trend Analysis ➞ | |
 | M Macy's Inc |
| Sector: Services & Goods | |
| SubSector: Department Stores | |
| MarketCap: 4705.78 Millions | |
| Recent Price: 17.33 Smart Investing & Trading Score: 100 | |
| Day Percent Change: 0.52% Day Change: 0.09 | |
| Week Change: 27.61% Year-to-date Change: 14.5% | |
| M Links: Profile News Message Board | |
| Charts:- Daily , Weekly | |
| Add M to Watchlist: View: Get Complete M Trend Analysis ➞ | |
 | RH RH |
| Sector: Services & Goods | |
| SubSector: Specialty Retail | |
| MarketCap: 4701.84 Millions | |
| Recent Price: 225.67 Smart Investing & Trading Score: 100 | |
| Day Percent Change: 1.01% Day Change: 2.18 | |
| Week Change: -6.94% Year-to-date Change: -44.4% | |
| RH Links: Profile News Message Board | |
| Charts:- Daily , Weekly | |
| Add RH to Watchlist: View: Get Complete RH Trend Analysis ➞ | |
 | KBH KB Home |
| Sector: Services & Goods | |
| SubSector: Residential Construction | |
| MarketCap: 4625.37 Millions | |
| Recent Price: 63.55 Smart Investing & Trading Score: 100 | |
| Day Percent Change: -1.05% Day Change: -0.64 | |
| Week Change: -3.89% Year-to-date Change: -6.7% | |
| KBH Links: Profile News Message Board | |
| Charts:- Daily , Weekly | |
| Add KBH to Watchlist: View: Get Complete KBH Trend Analysis ➞ | |
 | FTDR Frontdoor Inc |
| Sector: Services & Goods | |
| SubSector: Personal Services | |
| MarketCap: 4593.15 Millions | |
| Recent Price: 60.75 Smart Investing & Trading Score: 90 | |
| Day Percent Change: -0.32% Day Change: -0.19 | |
| Week Change: -0.68% Year-to-date Change: 7.3% | |
| FTDR Links: Profile News Message Board | |
| Charts:- Daily , Weekly | |
| Add FTDR to Watchlist: View: Get Complete FTDR Trend Analysis ➞ | |
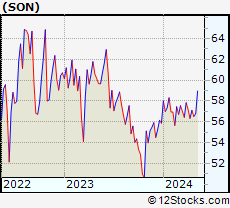 | SON Sonoco Products Co |
| Sector: Services & Goods | |
| SubSector: Packaging & Containers | |
| MarketCap: 4558.73 Millions | |
| Recent Price: 47.25 Smart Investing & Trading Score: 40 | |
| Day Percent Change: 1.3% Day Change: 0.6 | |
| Week Change: 1.24% Year-to-date Change: -1.3% | |
| SON Links: Profile News Message Board | |
| Charts:- Daily , Weekly | |
| Add SON to Watchlist: View: Get Complete SON Trend Analysis ➞ | |
| For tabular summary view of above stock list: Summary View ➞ 0 - 25 , 25 - 50 , 50 - 75 , 75 - 100 , 100 - 125 , 125 - 150 , 150 - 175 , 175 - 200 , 200 - 225 , 225 - 250 , 250 - 275 , 275 - 300 , 300 - 325 , 325 - 350 , 350 - 375 , 375 - 400 | ||
| Click To Change The Sort Order: By Market Cap or Company Size Performance: Year-to-date, Week and Day | |
| Select Chart Type: | ||
|
Best Stocks Today 12Stocks.com |
© 2025 12Stocks.com Terms & Conditions Privacy Contact Us
All Information Provided Only For Education And Not To Be Used For Investing or Trading. See Terms & Conditions


One More Thing ... Get Best Stocks Delivered Daily!
Never Ever Miss A Move With Our Top Ten Stocks Lists
Find Best Stocks In Any Market - Bull or Bear Market
Take A Peek At Our Top Ten Stocks Lists: Daily, Weekly, Year-to-Date & Top Trends
Find Best Stocks In Any Market - Bull or Bear Market
Take A Peek At Our Top Ten Stocks Lists: Daily, Weekly, Year-to-Date & Top Trends
Consumer Services Stocks With Best Up Trends [0-bearish to 100-bullish]: Designer Brands[100], Childrens Place[100], PDD [100], Lennar Corp[100], D.R. Horton[100], Mohawk Industries[100], Signet Jewelers[100], Shoe Carnival[100], H World[100], Pulte [100], Lowe's Cos[100]
Best Consumer Services Stocks Year-to-Date:
WW [2341.73%], ThredUp [702.88%], China Yuchai[231.9%], Niu Technologies[159.78%], Viomi Technology[154.48%], Cooper-Standard [153.02%], Nova Lifestyle[146.73%], National Vision[130.71%], Solid Power[128.57%], XPeng [92.47%], Super [88.69%] Best Consumer Services Stocks This Week:
Macy's [27.61%], Guess [25.88%], NIO [24.49%], Kandi Technologies[24.41%], Fossil [20%], Kohl's Corp[19.29%], Cooper-Standard [18.47%], Flexsteel Industries[18.05%], XPeng [17.39%], Smart Share[14.53%], MINISO [13.58%] Best Consumer Services Stocks Daily:
Cooper-Standard [16.38%], XPeng [11.68%], Viomi Technology[9.39%], NIO [9.27%], Funko [9.16%], Designer Brands[9.15%], Hamilton Beach[7.24%], MINISO [6.38%], Genesco [5.5%], Flexsteel Industries[5.47%], Solid Power[4.85%]