
 Login Sign Up


| |||||
 |  | ||||

| 12Stocks.com Market Intelligence |
Best Consumer Services Stocks
| In a hurry? Services & Goods Stocks: Performance Trends Table, Stock Charts
Sort Consumer Services: Daily, Weekly, Year-to-Date, Market Cap & Trends. Filter Services & Goods stocks list by size: All Large Mid-Range Small |
| 12Stocks.com Consumer Services Stocks Performances & Trends Daily | |||||||||
|
|  The overall Smart Investing & Trading Score is 50 (0-bearish to 100-bullish) which puts Consumer Services sector in short term neutral trend. The Smart Investing & Trading Score from previous trading session is 60 and hence a deterioration of trend.
| ||||||||
Here are the Smart Investing & Trading Scores of the most requested Consumer Services stocks at 12Stocks.com (click stock name for detailed review):
|


| Consider signing up for our daily 12Stocks.com "Best Stocks Newsletter". You will never ever miss a big stock move again! |
| 12Stocks.com: Investing in Consumer Services sector with Stocks | |
|
The following table helps investors and traders sort through current performance and trends (as measured by Smart Investing & Trading Score) of various
stocks in the Consumer Services sector. Quick View: Move mouse or cursor over stock symbol (ticker) to view short-term Technical chart and over stock name to view long term chart. Click on  to add stock symbol to your watchlist and to add stock symbol to your watchlist and  to view watchlist. Click on any ticker or stock name for detailed market intelligence report for that stock. to view watchlist. Click on any ticker or stock name for detailed market intelligence report for that stock. |
12Stocks.com Performance of Stocks in Consumer Services Sector
| Ticker | Stock Name | Watchlist | Category | Recent Price | Smart Investing & Trading Score | Change % | YTD Change% |
| XPEV | XPeng |   | Auto Manufacturers | 21.02 | 40 | 11.68 | 92.47% |
| MNSO | MINISO | | Specialty Retail | 24.85 | 80 | 6.38 | -5.28% |
| VMAR | Vision Marine | | Leisure | 1.37 | 50 | 5.23 | -89.87% |
| PDD | Pinduoduo | | Retail | 120.22 | 60 | 4.20 | 26.78% |
| BQ | Boqii Holding | | Specialty Retail | 2.91 | 70 | 3.14 | -27.78% |
| HTHT | Huazhu | | Lodging | 36.85 | 100 | 2.19 | 12.31% |
| VIPS | Vipshop | | Retail | 16.74 | 40 | 1.80 | 30.68% |
| ONEW | OneWater Marine | | Recreational | 16.83 | 40 | 1.21 | -3.80% |
| KMX | CarMax | | Automobile | 60.39 | 30 | 1.17 | -29.48% |
| YUMC | Yum China | | Restaurants | 44.72 | 0 | 1.08 | -5.42% |
| BATRA | Liberty Braves | | Broadcasting | 47.51 | 10 | 1.03 | 14.13% |
| ULTA | Ulta Beauty | | Retail | 537.94 | 60 | 1.02 | 30.52% |
| VRSK | Verisk Analytics | | Services | 267.42 | 20 | 0.91 | -6.69% |
| CCL | Carnival | | Casinos | 31.41 | 60 | 0.80 | 13.52% |
| EDU | New Oriental | | Education | 47.98 | 70 | 0.79 | -26.29% |
| ASO | Academy Sports | | Specialty Retail | 53.55 | 20 | 0.76 | -9.81% |
| TCOM | Trip.com | | Lodging | 73.75 | 80 | 0.70 | -6.89% |
| YSG | Yatsen Holding | | Specialty Retail | 9.34 | 40 | 0.63 | 141.21% |
| FAST | Fastenal | | Equipment | 49.47 | 50 | 0.57 | 36.46% |
| CMG | Chipotle Mexican | | Restaurants | 41.99 | 10 | 0.57 | -28.04% |
| AMZN | Amazon.com | | Retail | 226.59 | 10 | 0.55 | -4.67% |
| SIRI | Sirius XM | | Broadcasting | 23.64 | 50 | 0.50 | 1.18% |
| BKNG | Booking | | Services | 5531.8 | 10 | 0.48 | 17.21% |
| HLT | Hilton Worldwide | | Lodging | 277.28 | 80 | 0.46 | 8.41% |
| LBRDK | Liberty Broadband | | Broadcasting | 60.86 | 10 | 0.46 | -12.14% |
| For chart view version of above stock list: Chart View ➞ 0 - 25 , 25 - 50 , 50 - 75 , 75 - 100 | ||
 | Click To Change The Sort Order: By Market Cap or Company Size Performance: Year-to-date, Week and Day |  |
|
Get the most comprehensive stock market coverage daily at 12Stocks.com ➞ Best Stocks Today ➞ Best Stocks Weekly ➞ Best Stocks Year-to-Date ➞ Best Stocks Trends ➞  Best Stocks Today 12Stocks.com Best Nasdaq Stocks ➞ Best S&P 500 Stocks ➞ Best Tech Stocks ➞ Best Biotech Stocks ➞ |
| Detailed Overview of Consumer Services Stocks |
| Consumer Services Technical Overview, Leaders & Laggards, Top Consumer Services ETF Funds & Detailed Consumer Services Stocks List, Charts, Trends & More |
| Consumer Services Sector: Technical Analysis, Trends & YTD Performance | |
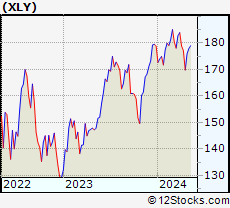
| Consumer Services sector is composed of stocks
from retail, entertainment, media/publishing, consumer goods
and services subsectors. Consumer Services sector, as represented by XLY, an exchange-traded fund [ETF] that holds basket of Consumer Services stocks (e.g, Walmart, Alibaba) is up by 0.83% and is currently underperforming the overall market by -5.95% year-to-date. Below is a quick view of Technical charts and trends: |
|
 XLY Weekly Chart |
|
| Long Term Trend: Very Good | |
| Medium Term Trend: Very Good | |
 XLY Daily Chart |
|
| Short Term Trend: Not Good | |
| Overall Trend Score: 50 | |
| YTD Performance: 0.83% | |
| **Trend Scores & Views Are Only For Educational Purposes And Not For Investing | |
| 12Stocks.com: Top Performing Consumer Services Sector Stocks | ||||||||||||||||||||||||||||||||||||||||||||||||
 The top performing Consumer Services sector stocks year to date are
Now, more recently, over last week, the top performing Consumer Services sector stocks on the move are


|
||||||||||||||||||||||||||||||||||||||||||||||||
| 12Stocks.com: Investing in Consumer Services Sector using Exchange Traded Funds | |
|
The following table shows list of key exchange traded funds (ETF) that
help investors track Consumer Services Index. For detailed view, check out our ETF Funds section of our website. Quick View: Move mouse or cursor over ETF symbol (ticker) to view short-term Technical chart and over ETF name to view long term chart. Click on ticker or stock name for detailed view. Click on to add stock symbol to your watchlist and to view watchlist. |
12Stocks.com List of ETFs that track Consumer Services Index
| Ticker | ETF Name | Watchlist | Recent Price | Smart Investing & Trading Score | Change % | Week % | Year-to-date % |
| XLY | Consumer Discret Sel | | 231.74 | 50 | 2.98 | 1.72 | 0.83% |
| RTH | Retail | | 248.15 | 80 | 0.04 | 0.04 | 3.56% |
| IYC | Consumer Services | | 103.45 | 40 | -0.77 | -1.16 | 6.01% |
| XRT | Retail | | 84.58 | 60 | 0.28 | 0.46 | 5.95% |
| IYK | Consumer Goods | | 70.34 | 40 | -0.08 | 2.42 | 10.27% |
| UCC | Consumer Services | | 50.49 | 50 | 5.11 | 2.52 | -7.59% |
| RETL | Retail Bull 3X | | 9.55 | 60 | -2.11 | -2.32 | -5.57% |
| RXI | Globl Consumer Discretionary | | 198.26 | 50 | -0.82 | -0.58 | 6.48% |
| SCC | Short Consumer Services | | 15.70 | 70 | -5.95 | -3.49 | -8.63% |
| UGE | Consumer Goods | | 18.18 | 20 | -0.14 | 1.22 | 6% |
| 12Stocks.com: Charts, Trends, Fundamental Data and Performances of Consumer Services Stocks | |
|
We now take in-depth look at all Consumer Services stocks including charts, multi-period performances and overall trends (as measured by Smart Investing & Trading Score). One can sort Consumer Services stocks (click link to choose) by Daily, Weekly and by Year-to-Date performances. Also, one can sort by size of the company or by market capitalization. |
| Select Your Default Chart Type: | |||||
| |||||
| Click on stock symbol or name for detailed view. Click on to add stock symbol to your watchlist and to view watchlist. Quick View: Move mouse or cursor over "Daily" to quickly view daily Technical stock chart and over "Weekly" to view weekly Technical stock chart. | |||||

 | XPEV XPeng Inc. |
| Sector: Services & Goods | |
| SubSector: Auto Manufacturers | |
| MarketCap: 32917 Millions | |
| Recent Price: 21.02 Smart Investing & Trading Score: 40 | |
| Day Percent Change: 11.68% Day Change: 2.38 | |
| Week Change: 17.39% Year-to-date Change: 92.5% | |
| XPEV Links: Profile News Message Board | |
| Charts:- Daily , Weekly | |
| Add XPEV to Watchlist: View: Get Complete XPEV Trend Analysis ➞ | |
 | MNSO MINISO Group Holding Limited |
| Sector: Services & Goods | |
| SubSector: Specialty Retail | |
| MarketCap: 69427 Millions | |
| Recent Price: 24.85 Smart Investing & Trading Score: 80 | |
| Day Percent Change: 6.38% Day Change: 1.33 | |
| Week Change: 13.58% Year-to-date Change: -5.3% | |
| MNSO Links: Profile News Message Board | |
| Charts:- Daily , Weekly | |
| Add MNSO to Watchlist: View: Get Complete MNSO Trend Analysis ➞ | |
 | VMAR Vision Marine Technologies Inc. |
| Sector: Services & Goods | |
| SubSector: Leisure | |
| MarketCap: 99027 Millions | |
| Recent Price: 1.37 Smart Investing & Trading Score: 50 | |
| Day Percent Change: 5.23% Day Change: 0.08 | |
| Week Change: -43.31% Year-to-date Change: -89.9% | |
| VMAR Links: Profile News Message Board | |
| Charts:- Daily , Weekly | |
| Add VMAR to Watchlist: View: Get Complete VMAR Trend Analysis ➞ | |
 | PDD Pinduoduo Inc. |
| Sector: Services & Goods | |
| SubSector: Specialty Retail, Other | |
| MarketCap: 41696.2 Millions | |
| Recent Price: 120.22 Smart Investing & Trading Score: 60 | |
| Day Percent Change: 4.2% Day Change: 4.96 | |
| Week Change: 7.16% Year-to-date Change: 26.8% | |
| PDD Links: Profile News Message Board | |
| Charts:- Daily , Weekly | |
| Add PDD to Watchlist: View: Get Complete PDD Trend Analysis ➞ | |
 | BQ Boqii Holding Limited |
| Sector: Services & Goods | |
| SubSector: Specialty Retail | |
| MarketCap: 33027 Millions | |
| Recent Price: 2.91 Smart Investing & Trading Score: 70 | |
| Day Percent Change: 3.14% Day Change: 0.08 | |
| Week Change: 6.12% Year-to-date Change: -27.8% | |
| BQ Links: Profile News Message Board | |
| Charts:- Daily , Weekly | |
| Add BQ to Watchlist: View: Get Complete BQ Trend Analysis ➞ | |
 | HTHT Huazhu Group Limited |
| Sector: Services & Goods | |
| SubSector: Lodging | |
| MarketCap: 9164.46 Millions | |
| Recent Price: 36.85 Smart Investing & Trading Score: 100 | |
| Day Percent Change: 2.19% Day Change: 0.77 | |
| Week Change: 8.16% Year-to-date Change: 12.3% | |
| HTHT Links: Profile News Message Board | |
| Charts:- Daily , Weekly | |
| Add HTHT to Watchlist: View: Get Complete HTHT Trend Analysis ➞ | |
 | VIPS Vipshop Holdings Limited |
| Sector: Services & Goods | |
| SubSector: Catalog & Mail Order Houses | |
| MarketCap: 10496.2 Millions | |
| Recent Price: 16.74 Smart Investing & Trading Score: 40 | |
| Day Percent Change: 1.8% Day Change: 0.3 | |
| Week Change: -2.14% Year-to-date Change: 30.7% | |
| VIPS Links: Profile News Message Board | |
| Charts:- Daily , Weekly | |
| Add VIPS to Watchlist: View: Get Complete VIPS Trend Analysis ➞ | |
 | ONEW OneWater Marine Inc. |
| Sector: Services & Goods | |
| SubSector: Recreational Vehicles | |
| MarketCap: 42027 Millions | |
| Recent Price: 16.83 Smart Investing & Trading Score: 40 | |
| Day Percent Change: 1.21% Day Change: 0.2 | |
| Week Change: -2.56% Year-to-date Change: -3.8% | |
| ONEW Links: Profile News Message Board | |
| Charts:- Daily , Weekly | |
| Add ONEW to Watchlist: View: Get Complete ONEW Trend Analysis ➞ | |
 | KMX CarMax, Inc. |
| Sector: Services & Goods | |
| SubSector: Auto Dealerships | |
| MarketCap: 8121.71 Millions | |
| Recent Price: 60.39 Smart Investing & Trading Score: 30 | |
| Day Percent Change: 1.17% Day Change: 0.7 | |
| Week Change: -1.56% Year-to-date Change: -29.5% | |
| KMX Links: Profile News Message Board | |
| Charts:- Daily , Weekly | |
| Add KMX to Watchlist: View: Get Complete KMX Trend Analysis ➞ | |
 | YUMC Yum China Holdings, Inc. |
| Sector: Services & Goods | |
| SubSector: Restaurants | |
| MarketCap: 16284.5 Millions | |
| Recent Price: 44.72 Smart Investing & Trading Score: 0 | |
| Day Percent Change: 1.08% Day Change: 0.48 | |
| Week Change: 0.6% Year-to-date Change: -5.4% | |
| YUMC Links: Profile News Message Board | |
| Charts:- Daily , Weekly | |
| Add YUMC to Watchlist: View: Get Complete YUMC Trend Analysis ➞ | |
 | BATRA The Liberty Braves Group |
| Sector: Services & Goods | |
| SubSector: Broadcasting - TV | |
| MarketCap: 18873.5 Millions | |
| Recent Price: 47.51 Smart Investing & Trading Score: 10 | |
| Day Percent Change: 1.03% Day Change: 0.47 | |
| Week Change: 0.4% Year-to-date Change: 14.1% | |
| BATRA Links: Profile News Message Board | |
| Charts:- Daily , Weekly | |
| Add BATRA to Watchlist: View: Get Complete BATRA Trend Analysis ➞ | |
 | ULTA Ulta Beauty, Inc. |
| Sector: Services & Goods | |
| SubSector: Specialty Retail, Other | |
| MarketCap: 9429.94 Millions | |
| Recent Price: 537.94 Smart Investing & Trading Score: 60 | |
| Day Percent Change: 1.02% Day Change: 5.42 | |
| Week Change: 9.18% Year-to-date Change: 30.5% | |
| ULTA Links: Profile News Message Board | |
| Charts:- Daily , Weekly | |
| Add ULTA to Watchlist: View: Get Complete ULTA Trend Analysis ➞ | |
 | VRSK Verisk Analytics, Inc. |
| Sector: Services & Goods | |
| SubSector: Business Services | |
| MarketCap: 22033.2 Millions | |
| Recent Price: 267.42 Smart Investing & Trading Score: 20 | |
| Day Percent Change: 0.91% Day Change: 2.42 | |
| Week Change: -0.26% Year-to-date Change: -6.7% | |
| VRSK Links: Profile News Message Board | |
| Charts:- Daily , Weekly | |
| Add VRSK to Watchlist: View: Get Complete VRSK Trend Analysis ➞ | |
 | CCL Carnival Corporation & Plc |
| Sector: Services & Goods | |
| SubSector: Resorts & Casinos | |
| MarketCap: 11725.4 Millions | |
| Recent Price: 31.41 Smart Investing & Trading Score: 60 | |
| Day Percent Change: 0.8% Day Change: 0.25 | |
| Week Change: -1.51% Year-to-date Change: 13.5% | |
| CCL Links: Profile News Message Board | |
| Charts:- Daily , Weekly | |
| Add CCL to Watchlist: View: Get Complete CCL Trend Analysis ➞ | |
 | EDU New Oriental Education & Technology Group Inc. |
| Sector: Services & Goods | |
| SubSector: Education & Training Services | |
| MarketCap: 18673.7 Millions | |
| Recent Price: 47.98 Smart Investing & Trading Score: 70 | |
| Day Percent Change: 0.79% Day Change: 0.37 | |
| Week Change: -1.56% Year-to-date Change: -26.3% | |
| EDU Links: Profile News Message Board | |
| Charts:- Daily , Weekly | |
| Add EDU to Watchlist: View: Get Complete EDU Trend Analysis ➞ | |
 | ASO Academy Sports and Outdoors, Inc. |
| Sector: Services & Goods | |
| SubSector: Specialty Retail | |
| MarketCap: 16027 Millions | |
| Recent Price: 53.55 Smart Investing & Trading Score: 20 | |
| Day Percent Change: 0.76% Day Change: 0.39 | |
| Week Change: -5.86% Year-to-date Change: -9.8% | |
| ASO Links: Profile News Message Board | |
| Charts:- Daily , Weekly | |
| Add ASO to Watchlist: View: Get Complete ASO Trend Analysis ➞ | |
 | TCOM Trip.com Group Limited |
| Sector: Services & Goods | |
| SubSector: Lodging | |
| MarketCap: 13449.6 Millions | |
| Recent Price: 73.75 Smart Investing & Trading Score: 80 | |
| Day Percent Change: 0.7% Day Change: 0.44 | |
| Week Change: 5.49% Year-to-date Change: -6.9% | |
| TCOM Links: Profile News Message Board | |
| Charts:- Daily , Weekly | |
| Add TCOM to Watchlist: View: Get Complete TCOM Trend Analysis ➞ | |
 | YSG Yatsen Holding Limited |
| Sector: Services & Goods | |
| SubSector: Specialty Retail | |
| MarketCap: 11827 Millions | |
| Recent Price: 9.34 Smart Investing & Trading Score: 40 | |
| Day Percent Change: 0.63% Day Change: 0.06 | |
| Week Change: 1.05% Year-to-date Change: 141.2% | |
| YSG Links: Profile News Message Board | |
| Charts:- Daily , Weekly | |
| Add YSG to Watchlist: View: Get Complete YSG Trend Analysis ➞ | |
 | FAST Fastenal Company |
| Sector: Services & Goods | |
| SubSector: Industrial Equipment Wholesale | |
| MarketCap: 17609.9 Millions | |
| Recent Price: 49.47 Smart Investing & Trading Score: 50 | |
| Day Percent Change: 0.57% Day Change: 0.28 | |
| Week Change: -0.38% Year-to-date Change: 36.5% | |
| FAST Links: Profile News Message Board | |
| Charts:- Daily , Weekly | |
| Add FAST to Watchlist: View: Get Complete FAST Trend Analysis ➞ | |
 | CMG Chipotle Mexican Grill, Inc. |
| Sector: Services & Goods | |
| SubSector: Restaurants | |
| MarketCap: 16849.9 Millions | |
| Recent Price: 41.99 Smart Investing & Trading Score: 10 | |
| Day Percent Change: 0.57% Day Change: 0.24 | |
| Week Change: -0.36% Year-to-date Change: -28.0% | |
| CMG Links: Profile News Message Board | |
| Charts:- Daily , Weekly | |
| Add CMG to Watchlist: View: Get Complete CMG Trend Analysis ➞ | |
 | AMZN Amazon.com, Inc. |
| Sector: Services & Goods | |
| SubSector: Catalog & Mail Order Houses | |
| MarketCap: 998070 Millions | |
| Recent Price: 226.59 Smart Investing & Trading Score: 10 | |
| Day Percent Change: 0.55% Day Change: 1.25 | |
| Week Change: -1.05% Year-to-date Change: -4.7% | |
| AMZN Links: Profile News Message Board | |
| Charts:- Daily , Weekly | |
| Add AMZN to Watchlist: View: Get Complete AMZN Trend Analysis ➞ | |
 | SIRI Sirius XM Holdings Inc. |
| Sector: Services & Goods | |
| SubSector: Broadcasting - Radio | |
| MarketCap: 21325.5 Millions | |
| Recent Price: 23.64 Smart Investing & Trading Score: 50 | |
| Day Percent Change: 0.5% Day Change: 0.11 | |
| Week Change: -5.24% Year-to-date Change: 1.2% | |
| SIRI Links: Profile News Message Board | |
| Charts:- Daily , Weekly | |
| Add SIRI to Watchlist: View: Get Complete SIRI Trend Analysis ➞ | |
 | BKNG Booking Holdings Inc. |
| Sector: Services & Goods | |
| SubSector: Business Services | |
| MarketCap: 54467.9 Millions | |
| Recent Price: 5531.8 Smart Investing & Trading Score: 10 | |
| Day Percent Change: 0.48% Day Change: 26.25 | |
| Week Change: -1.2% Year-to-date Change: 17.2% | |
| BKNG Links: Profile News Message Board | |
| Charts:- Daily , Weekly | |
| Add BKNG to Watchlist: View: Get Complete BKNG Trend Analysis ➞ | |
 | HLT Hilton Worldwide Holdings Inc. |
| Sector: Services & Goods | |
| SubSector: Lodging | |
| MarketCap: 18064.6 Millions | |
| Recent Price: 277.28 Smart Investing & Trading Score: 80 | |
| Day Percent Change: 0.46% Day Change: 1.27 | |
| Week Change: 0.44% Year-to-date Change: 8.4% | |
| HLT Links: Profile News Message Board | |
| Charts:- Daily , Weekly | |
| Add HLT to Watchlist: View: Get Complete HLT Trend Analysis ➞ | |
 | LBRDK Liberty Broadband Corporation |
| Sector: Services & Goods | |
| SubSector: Broadcasting - TV | |
| MarketCap: 13847.3 Millions | |
| Recent Price: 60.86 Smart Investing & Trading Score: 10 | |
| Day Percent Change: 0.46% Day Change: 0.28 | |
| Week Change: 2.14% Year-to-date Change: -12.1% | |
| LBRDK Links: Profile News Message Board | |
| Charts:- Daily , Weekly | |
| Add LBRDK to Watchlist: View: Get Complete LBRDK Trend Analysis ➞ | |
| For tabular summary view of above stock list: Summary View ➞ 0 - 25 , 25 - 50 , 50 - 75 , 75 - 100 | ||
| Click To Change The Sort Order: By Market Cap or Company Size Performance: Year-to-date, Week and Day | |
| Select Chart Type: | ||
|
Best Stocks Today 12Stocks.com |
© 2025 12Stocks.com Terms & Conditions Privacy Contact Us
All Information Provided Only For Education And Not To Be Used For Investing or Trading. See Terms & Conditions


One More Thing ... Get Best Stocks Delivered Daily!
Never Ever Miss A Move With Our Top Ten Stocks Lists
Find Best Stocks In Any Market - Bull or Bear Market
Take A Peek At Our Top Ten Stocks Lists: Daily, Weekly, Year-to-Date & Top Trends
Find Best Stocks In Any Market - Bull or Bear Market
Take A Peek At Our Top Ten Stocks Lists: Daily, Weekly, Year-to-Date & Top Trends
Consumer Services Stocks With Best Up Trends [0-bearish to 100-bullish]: Cato [100], Myriad Genetics[100], Seaways[100], Baozun [100], Huazhu [100], Quad/Graphics [100], Dillard s[100], Five Below[100], AMC Networks[100], Smart Share[100], Driven Brands[100]
Best Consumer Services Stocks Year-to-Date:
WW [2341.73%], ThredUp [702.88%], Willdan [179%], Kratos Defense[145.56%], Yatsen Holding[141.21%], IHS Holding[139.04%], National Vision[130.71%], Altisource Portfolio[127.41%], Roblox [98.5%], Gray Television[93.93%], XPeng [92.47%] Best Consumer Services Stocks This Week:
Cato [34.15%], Guess [25.88%], Altisource Portfolio[24.32%], Macy s[21.39%], Zhihu [18.1%], XPeng [17.39%], Smart Share[14.53%], MINISO [13.58%], Soho House[12.68%], Ameresco [11.37%], Urban One[10.62%] Best Consumer Services Stocks Daily:
Cato [34.15%], Macy s[19.05%], XPeng [11.68%], Designer Brands[9.15%], Altisource Portfolio[9.12%], E.W. Scripps[7.9%], MINISO [6.38%], Genesco [5.5%], Myriad Genetics[5.42%], Seaways[5.35%], Vision Marine[5.23%]