
 Login Sign Up


| |||||
 |  | ||||

| 12Stocks.com Market Intelligence |
Best Biotech Stocks
|
|
| Quick Read: Best Biotech Stocks List By Performances & Trends: Daily, Weekly, Year-to-Date, Market Cap (Size) & Technical Trends | |||
| Best Biotech Stocks Views: Quick Browse View, Summary & Slide Show View | |||
| 12Stocks.com Biotech Stocks Performances & Trends Daily | |||||||||
|
|  The overall market intelligence score is 49 (0-bearish to 100-bullish) which puts Biotech sector in short term neutral trend. The market intelligence score from previous trading session is 32 and hence an improvement of trend.
| ||||||||
Here are the market intelligence trend scores of the most requested Biotech stocks at 12Stocks.com (click stock name for detailed review):
|


| 12Stocks.com: Investing in Biotech sector with Stocks | |
|
The following table helps investors and traders sort through current performance and trends (as measured by market intelligence score) of various
stocks in the Biotech sector. Quick View: Move mouse or cursor over stock symbol (ticker) to view short-term Technical chart and over stock name to view long term chart. Click on  to add stock symbol to your watchlist and to add stock symbol to your watchlist and  to view watchlist. Click on any ticker or stock name for detailed market intelligence report for that stock. to view watchlist. Click on any ticker or stock name for detailed market intelligence report for that stock. |
12Stocks.com Performance of Stocks in Biotech Sector
| Ticker | Stock Name | Watchlist | Category | Recent Price | Market Intelligence Score | Change % | YTD Change% |
| CRSP | CRISPR |   | Biotechnology | 53.81 | 25 | 1.55% | -14.04% |
| PRLD | Prelude | | Biotechnology | 3.73 | 15 | -1.06% | -14.25% |
| BNTX | BioNTech SE | | Biotechnology | 89.95 | 100 | 1.27% | -14.77% |
| RXRX | Recursion | | Biotechnology | 8.33 | 49 | 6.66% | -14.91% |
| IONS | Ionis | | Biotechnology | 43.01 | 64 | 4.24% | -14.98% |
| ABOS | Acumen | | Biotechnology | 3.25 | 44 | 0.93% | -15.36% |
| MTNB | Matinas BioPharma | | Biotechnology | 0.18 | 35 | -1.67% | -15.54% |
| INCY | yte | | Biotechnology | 52.94 | 59 | 1.71% | -15.69% |
| ZYME | Zymeworks | | Biotechnology | 8.76 | 49 | 2.10% | -15.69% |
| OPK | OPKO Health | | Biotechnology | 1.27 | 88 | 4.10% | -15.89% |
| ATHA | Athira Pharma | | Biotechnology | 2.04 | 42 | 3.55% | -16.39% |
| NAUT | Nautilus nology | | Biotechnology | 2.75 | 90 | 8.27% | -16.41% |
| DVAX | Dynavax Technologies | | Biotechnology | 11.68 | 42 | 2.73% | -16.45% |
| BIIB | Biogen | | Biotechnology | 216.13 | 87 | 0.61% | -16.48% |
| NBTX | Nanobiotix S.A | | Biotechnology | 6.19 | 64 | 3.34% | -16.58% |
| INSM | Insmed | | Biotechnology | 25.59 | 49 | 3.52% | -17.42% |
| KRON | Kronos Bio | | Biotechnology | 1.03 | 37 | 0.00% | -17.60% |
| CLLS | Cellectis S.A | | Biotechnology | 2.54 | 35 | -0.94% | -17.66% |
| PSTX | Poseida | | Biotechnology | 2.77 | 64 | 14.46% | -17.68% |
| DRTS | Alpha Tau | | Biotechnology | 2.46 | 37 | -1.60% | -17.73% |
| HLVX | HilleVax | | Biotechnology | 13.53 | 49 | 2.58% | -17.88% |
| OMGA | Omega | | Biotechnology | 2.47 | 49 | 10.76% | -17.94% |
| RCUS | Arcus | | Biotechnology | 15.50 | 42 | 1.77% | -18.85% |
| FENC | Fennec | | Biotechnology | 9.09 | 10 | -0.98% | -18.98% |
| GILD | Gilead | | Biotechnology | 65.51 | 35 | 0.48% | -19.13% |
| To view more stocks, click on Next / Previous arrows or select different range: 0 - 25 , 25 - 50 , 50 - 75 , 75 - 100 , 100 - 125 , 125 - 150 , 150 - 175 , 175 - 200 , 200 - 225 , 225 - 250 , 250 - 275 , 275 - 300 , 300 - 325 , 325 - 350 , 350 - 375 , 375 - 400 | ||
 | Click To Change The Sort Order: By Market Cap or Company Size Performance: Year-to-date, Week and Day |  |
|
Get the most comprehensive stock market coverage daily at 12Stocks.com ➞ Best Stocks Today ➞ Best Stocks Weekly ➞ Best Stocks Year-to-Date ➞ Best Stocks Trends ➞  Best Stocks Today 12Stocks.com Best Nasdaq Stocks ➞ Best S&P 500 Stocks ➞ Best Tech Stocks ➞ Best Biotech Stocks ➞ |
| Detailed Overview of Biotech Stocks |
| Biotech Technical Overview, Leaders & Laggards, Top Biotech ETF Funds & Detailed Biotech Stocks List, Charts, Trends & More |
| Biotech Sector: Technical Analysis, Trends & YTD Performance | |
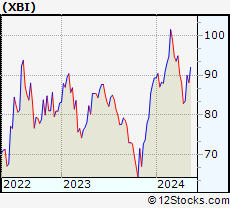
| Biotech sector, as represented by XBI, an exchange-traded fund [ETF] that holds basket of Biotech stocks (e.g, Amgen, Celgene) is down by -2.2% and is currently underperforming the overall market by -6.74% year-to-date. Below is a quick view of Technical charts and trends: | |
 XBI Weekly Chart |
|
| Long Term Trend: Not Good | |
| Medium Term Trend: Deteriorating | |
 XBI Daily Chart |
|
| Short Term Trend: Very Good | |
| Overall Trend Score: 49 | |
| YTD Performance: -2.2% | |
| **Trend Scores & Views Are Only For Educational Purposes And Not For Investing | |
| 12Stocks.com: Top Performing Biotech Sector Stocks | ||||||||||||||||||||||||||||||||||||||||||||||||
 The top performing Biotech sector stocks year to date are
Now, more recently, over last week, the top performing Biotech sector stocks on the move are


|
||||||||||||||||||||||||||||||||||||||||||||||||
| 12Stocks.com: Investing in Biotech Sector using Exchange Traded Funds | |
|
The following table shows list of key exchange traded funds (ETF) that
help investors track Biotech Index. For detailed view, check out our ETF Funds section of our website. Quick View: Move mouse or cursor over ETF symbol (ticker) to view short-term Technical chart and over ETF name to view long term chart. Click on ticker or stock name for detailed view. Click on to add stock symbol to your watchlist and to view watchlist. |
12Stocks.com List of ETFs that track Biotech Index
| Ticker | ETF Name | Watchlist | Recent Price | Market Intelligence Score | Change % | Week % | Year-to-date % |
| LABD | Biotech Bear 3X | | 9.03 | 49 | -10.24 | -14.16 | -6.81% |
| XBI | Biotech | | 87.33 | 49 | 3.20 | 4.6 | -2.2% |
| LABU | Biotech Bull 3X | | 99.81 | 49 | 9.84 | 14.06 | -18.17% |
| IBB | Biotechnology | | 129.49 | 57 | 2.02 | 2.37 | -4.68% |
| IYH | Healthcare | | 59.18 | 64 | 0.59 | 0.97 | 3.37% |
| IXJ | Global Healthcare | | 89.56 | 50 | 0.27 | 0.49 | 3.27% |
| IHF | Healthcare Providers | | 51.44 | 15 | -0.77 | -0.92 | -2.04% |
| FBT | First NYSE | | 146.02 | 49 | 1.46 | 1.65 | -7.61% |
| BIB | Biotechnology | | 52.58 | 64 | 4.43 | 5.88 | -7.84% |
| CURE | Healthcare Bull 3X | | 106.56 | 64 | 0.61 | 1.19 | 4.74% |
| PBE | Biotech & Genome | | 62.86 | 64 | 3.27 | 4.11 | -4.53% |
| PTH | DWA Healthcare Momentum | | 41.27 | 49 | 1.93 | 3.46 | 5.44% |
| BIS | Short Biotech | | 19.11 | 36 | -3.68 | -5.49 | 5.76% |
| BBH | Biotech | | 158.64 | 57 | 1.41 | 1.92 | -4.03% |
| BTEC | Principal Healthcare Innovators | | 35.90 | 62 | 3.60 | 4.81 | -1.19% |
| BBC | Bio Biotechnology Clinical | | 27.10 | 62 | 3.60 | 6.13 | 10.81% |
| BBP | Bio Biotechnology Products | | 54.35 | 64 | 2.00 | 5.56 | -6.45% |
| 12Stocks.com: Charts, Trends, Fundamental Data and Performances of Biotech Stocks | |
|
We now take in-depth look at all Biotech stocks including charts, multi-period performances and overall trends (as measured by market intelligence score). One can sort Biotech stocks (click link to choose) by Daily, Weekly and by Year-to-Date performances. Also, one can sort by size of the company or by market capitalization. |
| Select Your Default Chart Type: | |||||
| |||||
| Click on stock symbol or name for detailed view. Click on to add stock symbol to your watchlist and to view watchlist. Quick View: Move mouse or cursor over "Daily" to quickly view daily Technical stock chart and over "Weekly" to view weekly Technical stock chart. | |||||

 | CRSP CRISPR Therapeutics AG |
| Sector: Health Care | |
| SubSector: Biotechnology | |
| MarketCap: 2691.35 Millions | |
| Recent Price: 53.81 Market Intelligence Score: 25 | |
| Day Percent Change: 1.55% Day Change: 0.82 | |
| Week Change: -0.19% Year-to-date Change: -14.0% | |
| CRSP Links: Profile News Message Board | |
| Charts:- Daily , Weekly | |
| Add CRSP to Watchlist: View: Get Complete CRSP Trend Analysis ➞ | |
 | PRLD Prelude Therapeutics Incorporated |
| Sector: Health Care | |
| SubSector: Biotechnology | |
| MarketCap: 26087 Millions | |
| Recent Price: 3.73 Market Intelligence Score: 15 | |
| Day Percent Change: -1.06% Day Change: -0.04 | |
| Week Change: -8.35% Year-to-date Change: -14.3% | |
| PRLD Links: Profile News Message Board | |
| Charts:- Daily , Weekly | |
| Add PRLD to Watchlist: View: Get Complete PRLD Trend Analysis ➞ | |
 | BNTX BioNTech SE |
| Sector: Health Care | |
| SubSector: Biotechnology | |
| MarketCap: 11933.7 Millions | |
| Recent Price: 89.95 Market Intelligence Score: 100 | |
| Day Percent Change: 1.27% Day Change: 1.13 | |
| Week Change: 3.14% Year-to-date Change: -14.8% | |
| BNTX Links: Profile News Message Board | |
| Charts:- Daily , Weekly | |
| Add BNTX to Watchlist: View: Get Complete BNTX Trend Analysis ➞ | |
 | RXRX Recursion Pharmaceuticals, Inc. |
| Sector: Health Care | |
| SubSector: Biotechnology | |
| MarketCap: 1470 Millions | |
| Recent Price: 8.33 Market Intelligence Score: 49 | |
| Day Percent Change: 6.66% Day Change: 0.52 | |
| Week Change: 2.65% Year-to-date Change: -14.9% | |
| RXRX Links: Profile News Message Board | |
| Charts:- Daily , Weekly | |
| Add RXRX to Watchlist: View: Get Complete RXRX Trend Analysis ➞ | |
 | IONS Ionis Pharmaceuticals, Inc. |
| Sector: Health Care | |
| SubSector: Biotechnology | |
| MarketCap: 6725.05 Millions | |
| Recent Price: 43.01 Market Intelligence Score: 64 | |
| Day Percent Change: 4.24% Day Change: 1.75 | |
| Week Change: 3.41% Year-to-date Change: -15.0% | |
| IONS Links: Profile News Message Board | |
| Charts:- Daily , Weekly | |
| Add IONS to Watchlist: View: Get Complete IONS Trend Analysis ➞ | |
 | ABOS Acumen Pharmaceuticals, Inc. |
| Sector: Health Care | |
| SubSector: Biotechnology | |
| MarketCap: 199 Millions | |
| Recent Price: 3.25 Market Intelligence Score: 44 | |
| Day Percent Change: 0.93% Day Change: 0.03 | |
| Week Change: 2.52% Year-to-date Change: -15.4% | |
| ABOS Links: Profile News Message Board | |
| Charts:- Daily , Weekly | |
| Add ABOS to Watchlist: View: Get Complete ABOS Trend Analysis ➞ | |
 | MTNB Matinas BioPharma Holdings, Inc. |
| Sector: Health Care | |
| SubSector: Biotechnology | |
| MarketCap: 147.085 Millions | |
| Recent Price: 0.18 Market Intelligence Score: 35 | |
| Day Percent Change: -1.67% Day Change: 0.00 | |
| Week Change: 2.07% Year-to-date Change: -15.5% | |
| MTNB Links: Profile News Message Board | |
| Charts:- Daily , Weekly | |
| Add MTNB to Watchlist: View: Get Complete MTNB Trend Analysis ➞ | |
 | INCY Incyte Corporation |
| Sector: Health Care | |
| SubSector: Biotechnology | |
| MarketCap: 15343.2 Millions | |
| Recent Price: 52.94 Market Intelligence Score: 59 | |
| Day Percent Change: 1.71% Day Change: 0.89 | |
| Week Change: 2.44% Year-to-date Change: -15.7% | |
| INCY Links: Profile News Message Board | |
| Charts:- Daily , Weekly | |
| Add INCY to Watchlist: View: Get Complete INCY Trend Analysis ➞ | |
 | ZYME Zymeworks Inc. |
| Sector: Health Care | |
| SubSector: Biotechnology | |
| MarketCap: 1373.55 Millions | |
| Recent Price: 8.76 Market Intelligence Score: 49 | |
| Day Percent Change: 2.10% Day Change: 0.18 | |
| Week Change: 6.05% Year-to-date Change: -15.7% | |
| ZYME Links: Profile News Message Board | |
| Charts:- Daily , Weekly | |
| Add ZYME to Watchlist: View: Get Complete ZYME Trend Analysis ➞ | |
 | OPK OPKO Health, Inc. |
| Sector: Health Care | |
| SubSector: Biotechnology | |
| MarketCap: 1116.05 Millions | |
| Recent Price: 1.27 Market Intelligence Score: 88 | |
| Day Percent Change: 4.10% Day Change: 0.05 | |
| Week Change: 0.79% Year-to-date Change: -15.9% | |
| OPK Links: Profile News Message Board | |
| Charts:- Daily , Weekly | |
| Add OPK to Watchlist: View: Get Complete OPK Trend Analysis ➞ | |
 | ATHA Athira Pharma, Inc. |
| Sector: Health Care | |
| SubSector: Biotechnology | |
| MarketCap: 92487 Millions | |
| Recent Price: 2.04 Market Intelligence Score: 42 | |
| Day Percent Change: 3.55% Day Change: 0.07 | |
| Week Change: 6.25% Year-to-date Change: -16.4% | |
| ATHA Links: Profile News Message Board | |
| Charts:- Daily , Weekly | |
| Add ATHA to Watchlist: View: Get Complete ATHA Trend Analysis ➞ | |
 | NAUT Nautilus Biotechnology, Inc. |
| Sector: Health Care | |
| SubSector: Biotechnology | |
| MarketCap: 458 Millions | |
| Recent Price: 2.75 Market Intelligence Score: 90 | |
| Day Percent Change: 8.27% Day Change: 0.21 | |
| Week Change: 10.44% Year-to-date Change: -16.4% | |
| NAUT Links: Profile News Message Board | |
| Charts:- Daily , Weekly | |
| Add NAUT to Watchlist: View: Get Complete NAUT Trend Analysis ➞ | |
 | DVAX Dynavax Technologies Corporation |
| Sector: Health Care | |
| SubSector: Biotechnology | |
| MarketCap: 276.885 Millions | |
| Recent Price: 11.68 Market Intelligence Score: 42 | |
| Day Percent Change: 2.73% Day Change: 0.31 | |
| Week Change: 4.19% Year-to-date Change: -16.5% | |
| DVAX Links: Profile News Message Board | |
| Charts:- Daily , Weekly | |
| Add DVAX to Watchlist: View: Get Complete DVAX Trend Analysis ➞ | |
 | BIIB Biogen Inc. |
| Sector: Health Care | |
| SubSector: Biotechnology | |
| MarketCap: 53102.6 Millions | |
| Recent Price: 216.13 Market Intelligence Score: 87 | |
| Day Percent Change: 0.61% Day Change: 1.31 | |
| Week Change: 3.46% Year-to-date Change: -16.5% | |
| BIIB Links: Profile News Message Board | |
| Charts:- Daily , Weekly | |
| Add BIIB to Watchlist: View: Get Complete BIIB Trend Analysis ➞ | |
 | NBTX Nanobiotix S.A. |
| Sector: Health Care | |
| SubSector: Biotechnology | |
| MarketCap: 177 Millions | |
| Recent Price: 6.19 Market Intelligence Score: 64 | |
| Day Percent Change: 3.34% Day Change: 0.20 | |
| Week Change: 7.84% Year-to-date Change: -16.6% | |
| NBTX Links: Profile News Message Board | |
| Charts:- Daily , Weekly | |
| Add NBTX to Watchlist: View: Get Complete NBTX Trend Analysis ➞ | |
 | INSM Insmed Incorporated |
| Sector: Health Care | |
| SubSector: Biotechnology | |
| MarketCap: 1452.45 Millions | |
| Recent Price: 25.59 Market Intelligence Score: 49 | |
| Day Percent Change: 3.52% Day Change: 0.87 | |
| Week Change: 3.19% Year-to-date Change: -17.4% | |
| INSM Links: Profile News Message Board | |
| Charts:- Daily , Weekly | |
| Add INSM to Watchlist: View: Get Complete INSM Trend Analysis ➞ | |
 | KRON Kronos Bio, Inc. |
| Sector: Health Care | |
| SubSector: Biotechnology | |
| MarketCap: 17287 Millions | |
| Recent Price: 1.03 Market Intelligence Score: 37 | |
| Day Percent Change: 0.00% Day Change: 0.00 | |
| Week Change: 3% Year-to-date Change: -17.6% | |
| KRON Links: Profile News Message Board | |
| Charts:- Daily , Weekly | |
| Add KRON to Watchlist: View: Get Complete KRON Trend Analysis ➞ | |
 | CLLS Cellectis S.A. |
| Sector: Health Care | |
| SubSector: Biotechnology | |
| MarketCap: 398.685 Millions | |
| Recent Price: 2.54 Market Intelligence Score: 35 | |
| Day Percent Change: -0.94% Day Change: -0.02 | |
| Week Change: 1.2% Year-to-date Change: -17.7% | |
| CLLS Links: Profile News Message Board | |
| Charts:- Daily , Weekly | |
| Add CLLS to Watchlist: View: Get Complete CLLS Trend Analysis ➞ | |
 | PSTX Poseida Therapeutics, Inc. |
| Sector: Health Care | |
| SubSector: Biotechnology | |
| MarketCap: 64487 Millions | |
| Recent Price: 2.77 Market Intelligence Score: 64 | |
| Day Percent Change: 14.46% Day Change: 0.35 | |
| Week Change: 30.05% Year-to-date Change: -17.7% | |
| PSTX Links: Profile News Message Board | |
| Charts:- Daily , Weekly | |
| Add PSTX to Watchlist: View: Get Complete PSTX Trend Analysis ➞ | |
 | DRTS Alpha Tau Medical Ltd. |
| Sector: Health Care | |
| SubSector: Biotechnology | |
| MarketCap: 300 Millions | |
| Recent Price: 2.46 Market Intelligence Score: 37 | |
| Day Percent Change: -1.60% Day Change: -0.04 | |
| Week Change: 2.5% Year-to-date Change: -17.7% | |
| DRTS Links: Profile News Message Board | |
| Charts:- Daily , Weekly | |
| Add DRTS to Watchlist: View: Get Complete DRTS Trend Analysis ➞ | |
 | HLVX HilleVax, Inc. |
| Sector: Health Care | |
| SubSector: Biotechnology | |
| MarketCap: 680 Millions | |
| Recent Price: 13.53 Market Intelligence Score: 49 | |
| Day Percent Change: 2.58% Day Change: 0.34 | |
| Week Change: 5.62% Year-to-date Change: -17.9% | |
| HLVX Links: Profile News Message Board | |
| Charts:- Daily , Weekly | |
| Add HLVX to Watchlist: View: Get Complete HLVX Trend Analysis ➞ | |
 | OMGA Omega Therapeutics, Inc. |
| Sector: Health Care | |
| SubSector: Biotechnology | |
| MarketCap: 304 Millions | |
| Recent Price: 2.47 Market Intelligence Score: 49 | |
| Day Percent Change: 10.76% Day Change: 0.24 | |
| Week Change: 8.81% Year-to-date Change: -17.9% | |
| OMGA Links: Profile News Message Board | |
| Charts:- Daily , Weekly | |
| Add OMGA to Watchlist: View: Get Complete OMGA Trend Analysis ➞ | |
 | RCUS Arcus Biosciences, Inc. |
| Sector: Health Care | |
| SubSector: Biotechnology | |
| MarketCap: 539.285 Millions | |
| Recent Price: 15.50 Market Intelligence Score: 42 | |
| Day Percent Change: 1.77% Day Change: 0.27 | |
| Week Change: -0.32% Year-to-date Change: -18.9% | |
| RCUS Links: Profile News Message Board | |
| Charts:- Daily , Weekly | |
| Add RCUS to Watchlist: View: Get Complete RCUS Trend Analysis ➞ | |
 | FENC Fennec Pharmaceuticals Inc. |
| Sector: Health Care | |
| SubSector: Biotechnology | |
| MarketCap: 126.785 Millions | |
| Recent Price: 9.09 Market Intelligence Score: 10 | |
| Day Percent Change: -0.98% Day Change: -0.09 | |
| Week Change: -1.3% Year-to-date Change: -19.0% | |
| FENC Links: Profile News Message Board | |
| Charts:- Daily , Weekly | |
| Add FENC to Watchlist: View: Get Complete FENC Trend Analysis ➞ | |
 | GILD Gilead Sciences, Inc. |
| Sector: Health Care | |
| SubSector: Biotechnology | |
| MarketCap: 99485.6 Millions | |
| Recent Price: 65.51 Market Intelligence Score: 35 | |
| Day Percent Change: 0.48% Day Change: 0.31 | |
| Week Change: 0.14% Year-to-date Change: -19.1% | |
| GILD Links: Profile News Message Board | |
| Charts:- Daily , Weekly | |
| Add GILD to Watchlist: View: Get Complete GILD Trend Analysis ➞ | |
| To view more stocks, click on Next / Previous arrows or select different range: 0 - 25 , 25 - 50 , 50 - 75 , 75 - 100 , 100 - 125 , 125 - 150 , 150 - 175 , 175 - 200 , 200 - 225 , 225 - 250 , 250 - 275 , 275 - 300 , 300 - 325 , 325 - 350 , 350 - 375 , 375 - 400 | ||
| Click To Change The Sort Order: By Market Cap or Company Size Performance: Year-to-date, Week and Day | |
| Select Chart Type: | ||
|
Best Stocks Today 12Stocks.com |
© 2024 12Stocks.com Terms & Conditions Privacy Contact Us
All Information Provided Only For Education And Not To Be Used For Investing or Trading. See Terms & Conditions


One More Thing ... Get Best Stocks Delivered Daily!
Never Ever Miss A Move With Our Top Ten Stocks Lists
Find Best Stocks In Any Market - Bull or Bear Market
Take A Peek At Our Top Ten Stocks Lists: Daily, Weekly, Year-to-Date & Top Trends
Find Best Stocks In Any Market - Bull or Bear Market
Take A Peek At Our Top Ten Stocks Lists: Daily, Weekly, Year-to-Date & Top Trends
Biotech Stocks With Best Up Trends [0-bearish to 100-bullish]: CytomX [100], Summit [100], Xencor [100], Humacyte [100], Mesoblast [100], United [100], Nuvation Bio[100], AnaptysBio [100], PTC [100], Revolution Medicines[100], Cullinan Oncology[100]
Best Biotech Stocks Year-to-Date:
Pieris [6317.58%], Avenue [2856.52%], Precision [2771.23%], Inovio [2172.55%], Assembly [1518.1%], Agenus [1501.64%], NuCana [1245.5%], Adverum nologies[1200.48%], Affimed N.V[756%], Mesoblast [555.45%], Corbus [516.72%] Best Biotech Stocks This Week:
CytomX [222.64%], Deciphera [73.11%], Cue Biopharma[39.56%], Seres [30.91%], Poseida [30.05%], Exscientia [27.14%], Nektar [25%], AnaptysBio [23.9%], Janux [22.62%], Personalis [22.53%], Summit [21.76%] Best Biotech Stocks Daily:
CytomX [214.72%], Ventyx [24.63%], Summit [19.59%], Cabaletta Bio[16.58%], TG [16.25%], Bio-Techne [16.22%], Brainstorm Cell[15.10%], Wave Life[15.01%], Poseida [14.46%], Xencor [14.28%], NextCure [13.22%]