
 Login Sign Up


| |||||
 |  | ||||

| 12Stocks.com Market Intelligence |
Best Biotech Stocks
|
|
| Quick Read: Best Biotech Stocks List By Performances & Trends: Daily, Weekly, Year-to-Date, Market Cap (Size) & Technical Trends | |||
| Best Biotech Stocks Views: Quick Browse View, Summary & Slide Show View | |||
| 12Stocks.com Biotech Stocks Performances & Trends Daily | |||||||||
|
|  The overall market intelligence score is 10 (0-bearish to 100-bullish) which puts Biotech sector in short term bearish trend. The market intelligence score from previous trading session is 0 and hence an improvement of trend.
| ||||||||
Here are the market intelligence trend scores of the most requested Biotech stocks at 12Stocks.com (click stock name for detailed review):
|


| 12Stocks.com: Investing in Biotech sector with Stocks | |
|
The following table helps investors and traders sort through current performance and trends (as measured by market intelligence score) of various
stocks in the Biotech sector. Quick View: Move mouse or cursor over stock symbol (ticker) to view short-term Technical chart and over stock name to view long term chart. Click on  to add stock symbol to your watchlist and to add stock symbol to your watchlist and  to view watchlist. Click on any ticker or stock name for detailed market intelligence report for that stock. to view watchlist. Click on any ticker or stock name for detailed market intelligence report for that stock. |
12Stocks.com Performance of Stocks in Biotech Sector
| Ticker | Stock Name | Watchlist | Category | Recent Price | Market Intelligence Score | Change % | YTD Change% |
| MTNB | Matinas BioPharma |   | Biotechnology | 0.19 | 10 | -1.04% | -12.12% |
| AKRO | Akero | | Biotechnology | 20.51 | 10 | -5.05% | -12.16% |
| STRO | Sutro Biopharma | | Biotechnology | 3.76 | 10 | -1.05% | -12.35% |
| XENE | Xenon | | Biotechnology | 40.31 | 0 | -2.74% | -12.48% |
| NUVL | Nuvalent | | Biotechnology | 64.23 | 17 | 0.06% | -12.60% |
| RGEN | Repligen | | Biotechnology | 157.06 | 0 | -2.44% | -12.65% |
| FHTX | Foghorn | | Biotechnology | 5.58 | 36 | -3.13% | -13.02% |
| ERAS | Erasca | | Biotechnology | 1.85 | 36 | 0.00% | -13.38% |
| BTAI | BioXcel | | Biotechnology | 2.55 | 10 | -1.54% | -13.56% |
| IPHA | Innate Pharma | | Biotechnology | 2.40 | 0 | -0.41% | -14.29% |
| ALKS | Alkermes | | Biotechnology | 23.76 | 10 | -1.04% | -14.35% |
| VIGL | Vigil Neuroscience | | Biotechnology | 2.94 | 43 | 0.86% | -14.43% |
| FENC | Fennec | | Biotechnology | 9.59 | 0 | -1.13% | -14.53% |
| PIRS | Pieris | | Biotechnology | 0.16 | 20 | -1.21% | -14.73% |
| ATHA | Athira Pharma | | Biotechnology | 2.07 | 0 | -2.13% | -15.16% |
| INCY | yte | | Biotechnology | 52.82 | 10 | 0.19% | -15.88% |
| ILMN | Illumina | | Biotechnology | 116.69 | 10 | -1.35% | -16.20% |
| ZYME | Zymeworks | | Biotechnology | 8.67 | 0 | -2.03% | -16.55% |
| ARCT | Arcturus | | Biotechnology | 26.31 | 0 | -4.81% | -16.56% |
| KZR | Kezar Life | | Biotechnology | 0.79 | 20 | -3.31% | -16.66% |
| KMDA | Kamada | | Biotechnology | 5.10 | 25 | 0.39% | -16.67% |
| ARVN | Arvinas | | Biotechnology | 34.29 | 17 | 2.51% | -16.69% |
| RYTM | Rhythm | | Biotechnology | 38.11 | 0 | -0.88% | -17.10% |
| ABOS | Acumen | | Biotechnology | 3.18 | 0 | -8.49% | -17.19% |
| ZNTL | Zentalis | | Biotechnology | 12.55 | 46 | -1.26% | -17.22% |
| To view more stocks, click on Next / Previous arrows or select different range: 0 - 25 , 25 - 50 , 50 - 75 , 75 - 100 , 100 - 125 , 125 - 150 , 150 - 175 , 175 - 200 , 200 - 225 , 225 - 250 , 250 - 275 , 275 - 300 , 300 - 325 , 325 - 350 , 350 - 375 , 375 - 400 | ||
 | Click To Change The Sort Order: By Market Cap or Company Size Performance: Year-to-date, Week and Day |  |
|
Get the most comprehensive stock market coverage daily at 12Stocks.com ➞ Best Stocks Today ➞ Best Stocks Weekly ➞ Best Stocks Year-to-Date ➞ Best Stocks Trends ➞  Best Stocks Today 12Stocks.com Best Nasdaq Stocks ➞ Best S&P 500 Stocks ➞ Best Tech Stocks ➞ Best Biotech Stocks ➞ |
| Detailed Overview of Biotech Stocks |
| Biotech Technical Overview, Leaders & Laggards, Top Biotech ETF Funds & Detailed Biotech Stocks List, Charts, Trends & More |
| Biotech Sector: Technical Analysis, Trends & YTD Performance | |
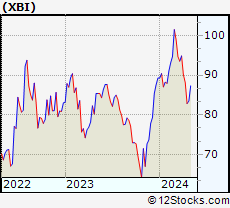
| Biotech sector, as represented by XBI, an exchange-traded fund [ETF] that holds basket of Biotech stocks (e.g, Amgen, Celgene) is down by -6.51% and is currently underperforming the overall market by -10.7% year-to-date. Below is a quick view of Technical charts and trends: | |
 XBI Weekly Chart |
|
| Long Term Trend: Not Good | |
| Medium Term Trend: Not Good | |
 XBI Daily Chart |
|
| Short Term Trend: Deteriorating | |
| Overall Trend Score: 10 | |
| YTD Performance: -6.51% | |
| **Trend Scores & Views Are Only For Educational Purposes And Not For Investing | |
| 12Stocks.com: Top Performing Biotech Sector Stocks | ||||||||||||||||||||||||||||||||||||||||||||||||
 The top performing Biotech sector stocks year to date are
Now, more recently, over last week, the top performing Biotech sector stocks on the move are


|
||||||||||||||||||||||||||||||||||||||||||||||||
| 12Stocks.com: Investing in Biotech Sector using Exchange Traded Funds | |
|
The following table shows list of key exchange traded funds (ETF) that
help investors track Biotech Index. For detailed view, check out our ETF Funds section of our website. Quick View: Move mouse or cursor over ETF symbol (ticker) to view short-term Technical chart and over ETF name to view long term chart. Click on ticker or stock name for detailed view. Click on to add stock symbol to your watchlist and to view watchlist. |
12Stocks.com List of ETFs that track Biotech Index
| Ticker | ETF Name | Watchlist | Recent Price | Market Intelligence Score | Change % | Week % | Year-to-date % |
| LABD | Biotech Bear 3X | | 10.52 | 82 | 4.37 | 17.15 | 8.57% |
| XBI | Biotech | | 83.48 | 10 | -1.38 | -5.3 | -6.51% |
| LABU | Biotech Bull 3X | | 88.04 | 10 | -4.33 | -15.63 | -27.82% |
| IBB | Biotechnology | | 124.64 | 0 | -0.99 | -3.81 | -8.25% |
| IYH | Healthcare | | 58.05 | 10 | -0.02 | -0.6 | 1.4% |
| IXJ | Global Healthcare | | 87.41 | 18 | -0.26 | -0.65 | 0.8% |
| BTEC | Principal Healthcare Innovators | | 34.09 | 0 | -1.51 | -5.29 | -6.17% |
| IHF | Healthcare Providers | | 51.55 | 32 | 0.93 | 1.99 | -1.84% |
| CURE | Healthcare Bull 3X | | 102.22 | 18 | -0.44 | -1.14 | 0.47% |
| FBT | First NYSE | | 141.52 | 10 | -1.52 | -3.94 | -10.46% |
| BIB | Biotechnology | | 47.94 | 0 | -2.02 | -6.71 | -15.97% |
| BIS | Short Biotech | | 20.87 | 100 | 1.69 | 6.46 | 15.47% |
| PTH | DWA Healthcare Momentum | | 39.57 | 46 | -2.18 | -5.4 | 1.1% |
| PBE | Biotech & Genome | | 59.62 | 18 | -1.75 | -2.66 | -9.45% |
| BBH | Biotech | | 152.35 | 10 | -0.43 | -3.33 | -7.84% |
| BBP | Bio Biotechnology Products | | 50.60 | 0 | -2.76 | -4.7 | -12.9% |
| BBC | Bio Biotechnology Clinical | | 25.48 | 36 | -1.32 | -6.06 | 4.2% |
| 12Stocks.com: Charts, Trends, Fundamental Data and Performances of Biotech Stocks | |
|
We now take in-depth look at all Biotech stocks including charts, multi-period performances and overall trends (as measured by market intelligence score). One can sort Biotech stocks (click link to choose) by Daily, Weekly and by Year-to-Date performances. Also, one can sort by size of the company or by market capitalization. |
| Select Your Default Chart Type: | |||||
| |||||
| Click on stock symbol or name for detailed view. Click on to add stock symbol to your watchlist and to view watchlist. Quick View: Move mouse or cursor over "Daily" to quickly view daily Technical stock chart and over "Weekly" to view weekly Technical stock chart. | |||||

 | MTNB Matinas BioPharma Holdings, Inc. |
| Sector: Health Care | |
| SubSector: Biotechnology | |
| MarketCap: 147.085 Millions | |
| Recent Price: 0.19 Market Intelligence Score: 10 | |
| Day Percent Change: -1.04% Day Change: 0.00 | |
| Week Change: -6.5% Year-to-date Change: -12.1% | |
| MTNB Links: Profile News Message Board | |
| Charts:- Daily , Weekly | |
| Add MTNB to Watchlist: View: Get Complete MTNB Trend Analysis ➞ | |
 | AKRO Akero Therapeutics, Inc. |
| Sector: Health Care | |
| SubSector: Biotechnology | |
| MarketCap: 675.085 Millions | |
| Recent Price: 20.51 Market Intelligence Score: 10 | |
| Day Percent Change: -5.05% Day Change: -1.09 | |
| Week Change: -7.53% Year-to-date Change: -12.2% | |
| AKRO Links: Profile News Message Board | |
| Charts:- Daily , Weekly | |
| Add AKRO to Watchlist: View: Get Complete AKRO Trend Analysis ➞ | |
 | STRO Sutro Biopharma, Inc. |
| Sector: Health Care | |
| SubSector: Biotechnology | |
| MarketCap: 196.485 Millions | |
| Recent Price: 3.76 Market Intelligence Score: 10 | |
| Day Percent Change: -1.05% Day Change: -0.04 | |
| Week Change: -9.18% Year-to-date Change: -12.4% | |
| STRO Links: Profile News Message Board | |
| Charts:- Daily , Weekly | |
| Add STRO to Watchlist: View: Get Complete STRO Trend Analysis ➞ | |
 | XENE Xenon Pharmaceuticals Inc. |
| Sector: Health Care | |
| SubSector: Biotechnology | |
| MarketCap: 388.585 Millions | |
| Recent Price: 40.31 Market Intelligence Score: 0 | |
| Day Percent Change: -2.74% Day Change: -1.13 | |
| Week Change: -2.23% Year-to-date Change: -12.5% | |
| XENE Links: Profile News Message Board | |
| Charts:- Daily , Weekly | |
| Add XENE to Watchlist: View: Get Complete XENE Trend Analysis ➞ | |
 | NUVL Nuvalent, Inc. |
| Sector: Health Care | |
| SubSector: Biotechnology | |
| MarketCap: 2400 Millions | |
| Recent Price: 64.23 Market Intelligence Score: 17 | |
| Day Percent Change: 0.06% Day Change: 0.04 | |
| Week Change: -1.95% Year-to-date Change: -12.6% | |
| NUVL Links: Profile News Message Board | |
| Charts:- Daily , Weekly | |
| Add NUVL to Watchlist: View: Get Complete NUVL Trend Analysis ➞ | |
 | RGEN Repligen Corporation |
| Sector: Health Care | |
| SubSector: Biotechnology | |
| MarketCap: 4711.75 Millions | |
| Recent Price: 157.06 Market Intelligence Score: 0 | |
| Day Percent Change: -2.44% Day Change: -3.92 | |
| Week Change: -8.44% Year-to-date Change: -12.7% | |
| RGEN Links: Profile News Message Board | |
| Charts:- Daily , Weekly | |
| Add RGEN to Watchlist: View: Get Complete RGEN Trend Analysis ➞ | |
 | FHTX Foghorn Therapeutics Inc. |
| Sector: Health Care | |
| SubSector: Biotechnology | |
| MarketCap: 74487 Millions | |
| Recent Price: 5.58 Market Intelligence Score: 36 | |
| Day Percent Change: -3.13% Day Change: -0.18 | |
| Week Change: -30.25% Year-to-date Change: -13.0% | |
| FHTX Links: Profile News Message Board | |
| Charts:- Daily , Weekly | |
| Add FHTX to Watchlist: View: Get Complete FHTX Trend Analysis ➞ | |
 | ERAS Erasca, Inc. |
| Sector: Health Care | |
| SubSector: Biotechnology | |
| MarketCap: 419 Millions | |
| Recent Price: 1.85 Market Intelligence Score: 36 | |
| Day Percent Change: 0.00% Day Change: 0.00 | |
| Week Change: -19.43% Year-to-date Change: -13.4% | |
| ERAS Links: Profile News Message Board | |
| Charts:- Daily , Weekly | |
| Add ERAS to Watchlist: View: Get Complete ERAS Trend Analysis ➞ | |
 | BTAI BioXcel Therapeutics, Inc. |
| Sector: Health Care | |
| SubSector: Biotechnology | |
| MarketCap: 487.485 Millions | |
| Recent Price: 2.55 Market Intelligence Score: 10 | |
| Day Percent Change: -1.54% Day Change: -0.04 | |
| Week Change: -12.07% Year-to-date Change: -13.6% | |
| BTAI Links: Profile News Message Board | |
| Charts:- Daily , Weekly | |
| Add BTAI to Watchlist: View: Get Complete BTAI Trend Analysis ➞ | |
 | IPHA Innate Pharma S.A. |
| Sector: Health Care | |
| SubSector: Biotechnology | |
| MarketCap: 309.485 Millions | |
| Recent Price: 2.40 Market Intelligence Score: 0 | |
| Day Percent Change: -0.41% Day Change: -0.01 | |
| Week Change: -3.23% Year-to-date Change: -14.3% | |
| IPHA Links: Profile News Message Board | |
| Charts:- Daily , Weekly | |
| Add IPHA to Watchlist: View: Get Complete IPHA Trend Analysis ➞ | |
 | ALKS Alkermes plc |
| Sector: Health Care | |
| SubSector: Biotechnology | |
| MarketCap: 2311.95 Millions | |
| Recent Price: 23.76 Market Intelligence Score: 10 | |
| Day Percent Change: -1.04% Day Change: -0.25 | |
| Week Change: -2.7% Year-to-date Change: -14.4% | |
| ALKS Links: Profile News Message Board | |
| Charts:- Daily , Weekly | |
| Add ALKS to Watchlist: View: Get Complete ALKS Trend Analysis ➞ | |
 | VIGL Vigil Neuroscience, Inc. |
| Sector: Health Care | |
| SubSector: Biotechnology | |
| MarketCap: 339 Millions | |
| Recent Price: 2.94 Market Intelligence Score: 43 | |
| Day Percent Change: 0.86% Day Change: 0.02 | |
| Week Change: -8.85% Year-to-date Change: -14.4% | |
| VIGL Links: Profile News Message Board | |
| Charts:- Daily , Weekly | |
| Add VIGL to Watchlist: View: Get Complete VIGL Trend Analysis ➞ | |
 | FENC Fennec Pharmaceuticals Inc. |
| Sector: Health Care | |
| SubSector: Biotechnology | |
| MarketCap: 126.785 Millions | |
| Recent Price: 9.59 Market Intelligence Score: 0 | |
| Day Percent Change: -1.13% Day Change: -0.11 | |
| Week Change: -11.45% Year-to-date Change: -14.5% | |
| FENC Links: Profile News Message Board | |
| Charts:- Daily , Weekly | |
| Add FENC to Watchlist: View: Get Complete FENC Trend Analysis ➞ | |
 | PIRS Pieris Pharmaceuticals, Inc. |
| Sector: Health Care | |
| SubSector: Biotechnology | |
| MarketCap: 150.785 Millions | |
| Recent Price: 0.16 Market Intelligence Score: 20 | |
| Day Percent Change: -1.21% Day Change: 0.00 | |
| Week Change: -9.45% Year-to-date Change: -14.7% | |
| PIRS Links: Profile News Message Board | |
| Charts:- Daily , Weekly | |
| Add PIRS to Watchlist: View: Get Complete PIRS Trend Analysis ➞ | |
 | ATHA Athira Pharma, Inc. |
| Sector: Health Care | |
| SubSector: Biotechnology | |
| MarketCap: 92487 Millions | |
| Recent Price: 2.07 Market Intelligence Score: 0 | |
| Day Percent Change: -2.13% Day Change: -0.05 | |
| Week Change: -15.16% Year-to-date Change: -15.2% | |
| ATHA Links: Profile News Message Board | |
| Charts:- Daily , Weekly | |
| Add ATHA to Watchlist: View: Get Complete ATHA Trend Analysis ➞ | |
 | INCY Incyte Corporation |
| Sector: Health Care | |
| SubSector: Biotechnology | |
| MarketCap: 15343.2 Millions | |
| Recent Price: 52.82 Market Intelligence Score: 10 | |
| Day Percent Change: 0.19% Day Change: 0.10 | |
| Week Change: -1.91% Year-to-date Change: -15.9% | |
| INCY Links: Profile News Message Board | |
| Charts:- Daily , Weekly | |
| Add INCY to Watchlist: View: Get Complete INCY Trend Analysis ➞ | |
 | ILMN Illumina, Inc. |
| Sector: Health Care | |
| SubSector: Biotechnology | |
| MarketCap: 39194.3 Millions | |
| Recent Price: 116.69 Market Intelligence Score: 10 | |
| Day Percent Change: -1.35% Day Change: -1.60 | |
| Week Change: -8.17% Year-to-date Change: -16.2% | |
| ILMN Links: Profile News Message Board | |
| Charts:- Daily , Weekly | |
| Add ILMN to Watchlist: View: Get Complete ILMN Trend Analysis ➞ | |
 | ZYME Zymeworks Inc. |
| Sector: Health Care | |
| SubSector: Biotechnology | |
| MarketCap: 1373.55 Millions | |
| Recent Price: 8.67 Market Intelligence Score: 0 | |
| Day Percent Change: -2.03% Day Change: -0.18 | |
| Week Change: -6.27% Year-to-date Change: -16.6% | |
| ZYME Links: Profile News Message Board | |
| Charts:- Daily , Weekly | |
| Add ZYME to Watchlist: View: Get Complete ZYME Trend Analysis ➞ | |
 | ARCT Arcturus Therapeutics Holdings Inc. |
| Sector: Health Care | |
| SubSector: Biotechnology | |
| MarketCap: 241.385 Millions | |
| Recent Price: 26.31 Market Intelligence Score: 0 | |
| Day Percent Change: -4.81% Day Change: -1.33 | |
| Week Change: -13.54% Year-to-date Change: -16.6% | |
| ARCT Links: Profile News Message Board | |
| Charts:- Daily , Weekly | |
| Add ARCT to Watchlist: View: Get Complete ARCT Trend Analysis ➞ | |
 | KZR Kezar Life Sciences, Inc. |
| Sector: Health Care | |
| SubSector: Biotechnology | |
| MarketCap: 174.885 Millions | |
| Recent Price: 0.79 Market Intelligence Score: 20 | |
| Day Percent Change: -3.31% Day Change: -0.03 | |
| Week Change: -8.47% Year-to-date Change: -16.7% | |
| KZR Links: Profile News Message Board | |
| Charts:- Daily , Weekly | |
| Add KZR to Watchlist: View: Get Complete KZR Trend Analysis ➞ | |
 | KMDA Kamada Ltd. |
| Sector: Health Care | |
| SubSector: Biotechnology | |
| MarketCap: 238.685 Millions | |
| Recent Price: 5.10 Market Intelligence Score: 25 | |
| Day Percent Change: 0.39% Day Change: 0.02 | |
| Week Change: -0.78% Year-to-date Change: -16.7% | |
| KMDA Links: Profile News Message Board | |
| Charts:- Daily , Weekly | |
| Add KMDA to Watchlist: View: Get Complete KMDA Trend Analysis ➞ | |
 | ARVN Arvinas, Inc. |
| Sector: Health Care | |
| SubSector: Biotechnology | |
| MarketCap: 3469.85 Millions | |
| Recent Price: 34.29 Market Intelligence Score: 17 | |
| Day Percent Change: 2.51% Day Change: 0.84 | |
| Week Change: -5.51% Year-to-date Change: -16.7% | |
| ARVN Links: Profile News Message Board | |
| Charts:- Daily , Weekly | |
| Add ARVN to Watchlist: View: Get Complete ARVN Trend Analysis ➞ | |
 | RYTM Rhythm Pharmaceuticals, Inc. |
| Sector: Health Care | |
| SubSector: Biotechnology | |
| MarketCap: 643.685 Millions | |
| Recent Price: 38.11 Market Intelligence Score: 0 | |
| Day Percent Change: -0.88% Day Change: -0.34 | |
| Week Change: -5.5% Year-to-date Change: -17.1% | |
| RYTM Links: Profile News Message Board | |
| Charts:- Daily , Weekly | |
| Add RYTM to Watchlist: View: Get Complete RYTM Trend Analysis ➞ | |
 | ABOS Acumen Pharmaceuticals, Inc. |
| Sector: Health Care | |
| SubSector: Biotechnology | |
| MarketCap: 199 Millions | |
| Recent Price: 3.18 Market Intelligence Score: 0 | |
| Day Percent Change: -8.49% Day Change: -0.29 | |
| Week Change: -14.97% Year-to-date Change: -17.2% | |
| ABOS Links: Profile News Message Board | |
| Charts:- Daily , Weekly | |
| Add ABOS to Watchlist: View: Get Complete ABOS Trend Analysis ➞ | |
 | ZNTL Zentalis Pharmaceuticals, Inc. |
| Sector: Health Care | |
| SubSector: Biotechnology | |
| MarketCap: 22187 Millions | |
| Recent Price: 12.55 Market Intelligence Score: 46 | |
| Day Percent Change: -1.26% Day Change: -0.16 | |
| Week Change: -6.41% Year-to-date Change: -17.2% | |
| ZNTL Links: Profile News Message Board | |
| Charts:- Daily , Weekly | |
| Add ZNTL to Watchlist: View: Get Complete ZNTL Trend Analysis ➞ | |
| To view more stocks, click on Next / Previous arrows or select different range: 0 - 25 , 25 - 50 , 50 - 75 , 75 - 100 , 100 - 125 , 125 - 150 , 150 - 175 , 175 - 200 , 200 - 225 , 225 - 250 , 250 - 275 , 275 - 300 , 300 - 325 , 325 - 350 , 350 - 375 , 375 - 400 | ||
| Click To Change The Sort Order: By Market Cap or Company Size Performance: Year-to-date, Week and Day | |
| Select Chart Type: | ||
|
Best Stocks Today 12Stocks.com |
© 2024 12Stocks.com Terms & Conditions Privacy Contact Us
All Information Provided Only For Education And Not To Be Used For Investing or Trading. See Terms & Conditions


One More Thing ... Get Best Stocks Delivered Daily!
Never Ever Miss A Move With Our Top Ten Stocks Lists
Find Best Stocks In Any Market - Bull or Bear Market
Take A Peek At Our Top Ten Stocks Lists: Daily, Weekly, Year-to-Date & Top Trends
Find Best Stocks In Any Market - Bull or Bear Market
Take A Peek At Our Top Ten Stocks Lists: Daily, Weekly, Year-to-Date & Top Trends
Biotech Stocks With Best Up Trends [0-bearish to 100-bullish]: Cullinan Oncology[100], ALX Oncology[100], Zura Bio[93], NuCana [93], Reneo [93], Vanda [93], Acrivon [88], Shattuck Labs[88], United [88], Geron [85], Avadel [83]
Best Biotech Stocks Year-to-Date:
Precision [2836.99%], Inovio [1900%], Assembly [1525.41%], Adverum nologies[1381.14%], NuCana [1269.17%], Affimed N.V[711.2%], Corbus [504.8%], Agenus [500.31%], Mesoblast [364.55%], Janux [348.12%], Addex [294.25%] Best Biotech Stocks This Week:
NuCana [1708.84%], ProKidney [32%], ALX Oncology[20.64%], Vanda [20.63%], Galera [16.43%], Cullinan Oncology[13.89%], Rani [13.15%], Humacyte [12.67%], Bicycle [9.91%], Zura Bio[9.52%], Intra-Cellular Therapies[9.29%] Best Biotech Stocks Daily:
Zura Bio[17.20%], Bicycle [12.33%], Vaxxinity [10.05%], Annovis Bio[9.57%], RedHill Biopharma[9.16%], Cullinan Oncology[6.42%], Longboard [6.07%], Addex [5.31%], Ginkgo Bioworks[5.13%], Century [5.13%], Acrivon [5.08%]