
 Login Sign Up


| |||||
 |  | ||||

| 12Stocks.com Market Intelligence |
Best Biotech Stocks
|
|
| Quick Read: Best Biotech Stocks List By Performances & Trends: Daily, Weekly, Year-to-Date, Market Cap (Size) & Technical Trends | |||
| Best Biotech Stocks Views: Quick Browse View, Summary & Slide Show View | |||
| 12Stocks.com Biotech Stocks Performances & Trends Daily | |||||||||
|
|  The overall market intelligence score is 69 (0-bearish to 100-bullish) which puts Biotech sector in short term neutral to bullish trend. The market intelligence score from previous trading session is 50 and hence an improvement of trend.
| ||||||||
Here are the market intelligence trend scores of the most requested Biotech stocks at 12Stocks.com (click stock name for detailed review):
|


| 12Stocks.com: Investing in Biotech sector with Stocks | |
|
The following table helps investors and traders sort through current performance and trends (as measured by market intelligence score) of various
stocks in the Biotech sector. Quick View: Move mouse or cursor over stock symbol (ticker) to view short-term Technical chart and over stock name to view long term chart. Click on  to add stock symbol to your watchlist and to add stock symbol to your watchlist and  to view watchlist. Click on any ticker or stock name for detailed market intelligence report for that stock. to view watchlist. Click on any ticker or stock name for detailed market intelligence report for that stock. |
12Stocks.com Performance of Stocks in Biotech Sector
| Ticker | Stock Name | Watchlist | Category | Recent Price | Market Intelligence Score | Change % | Weekly Change% |
| CERT | Certara |   | Biotechnology | 17.61 | 100 | -0.11% | 6.28% |
| ATAI | Atai Life | | Biotechnology | 2.05 | 43 | -3.76% | 6.22% |
| IMVT | Immunovant | | Biotechnology | 28.86 | 50 | 0.28% | 6.22% |
| MLTX | MoonLake Immuno | | Biotechnology | 45.06 | 64 | 4.23% | 6.10% |
| NUVL | Nuvalent | | Biotechnology | 70.82 | 52 | -0.66% | 6.02% |
| DERM | Dermira | | Biotechnology | 3.60 | 34 | -0.83% | 5.88% |
| ALLO | Allogene | | Biotechnology | 3.06 | 32 | 3.03% | 5.88% |
| IPHA | Innate Pharma | | Biotechnology | 2.40 | 49 | -1.23% | 5.73% |
| SRRK | Scholar Rock | | Biotechnology | 15.36 | 77 | 1.72% | 5.71% |
| ZNTL | Zentalis | | Biotechnology | 11.69 | 42 | 5.22% | 5.70% |
| TRDA | Entrada | | Biotechnology | 13.16 | 77 | 1.70% | 5.70% |
| AVDL | Avadel | | Biotechnology | 18.81 | 95 | 2.79% | 5.61% |
| MIRM | Mirum | | Biotechnology | 25.83 | 64 | 0.90% | 5.60% |
| BGNE | BeiGene | | Biotechnology | 162.10 | 69 | 0.06% | 5.55% |
| GMAB | Genmab A/S | | Biotechnology | 29.71 | 100 | 7.18% | 5.54% |
| DYN | Dyne | | Biotechnology | 26.08 | 34 | 0.31% | 5.46% |
| VRCA | Verrica | | Biotechnology | 7.25 | 73 | 7.17% | 5.46% |
| VNDA | Vanda | | Biotechnology | 4.87 | 81 | 4.06% | 5.41% |
| VCYT | Veracyte | | Biotechnology | 20.34 | 64 | 0.74% | 5.33% |
| LGND | Ligand | | Biotechnology | 74.05 | 49 | 2.39% | 4.93% |
| KURA | Kura Oncology | | Biotechnology | 20.61 | 64 | 0.10% | 4.89% |
| KROS | Keros | | Biotechnology | 60.65 | 59 | 6.22% | 4.82% |
| APRE | Aprea | | Biotechnology | 5.45 | 32 | 0.00% | 4.81% |
| DVAX | Dynavax Technologies | | Biotechnology | 11.73 | 57 | 0.13% | 4.68% |
| SNDX | Syndax | | Biotechnology | 22.04 | 74 | 0.82% | 4.65% |
| To view more stocks, click on Next / Previous arrows or select different range: 0 - 25 , 25 - 50 , 50 - 75 , 75 - 100 , 100 - 125 , 125 - 150 , 150 - 175 , 175 - 200 , 200 - 225 , 225 - 250 , 250 - 275 , 275 - 300 , 300 - 325 , 325 - 350 , 350 - 375 , 375 - 400 | ||
 | Click To Change The Sort Order: By Market Cap or Company Size Performance: Year-to-date, Week and Day |  |
|
Get the most comprehensive stock market coverage daily at 12Stocks.com ➞ Best Stocks Today ➞ Best Stocks Weekly ➞ Best Stocks Year-to-Date ➞ Best Stocks Trends ➞  Best Stocks Today 12Stocks.com Best Nasdaq Stocks ➞ Best S&P 500 Stocks ➞ Best Tech Stocks ➞ Best Biotech Stocks ➞ |
| Detailed Overview of Biotech Stocks |
| Biotech Technical Overview, Leaders & Laggards, Top Biotech ETF Funds & Detailed Biotech Stocks List, Charts, Trends & More |
| Biotech Sector: Technical Analysis, Trends & YTD Performance | |
| Biotech sector, as represented by XBI, an exchange-traded fund [ETF] that holds basket of Biotech stocks (e.g, Amgen, Celgene) is up by 0.77% and is currently underperforming the overall market by -6.11% year-to-date. Below is a quick view of Technical charts and trends: | |
 XBI Weekly Chart |
|
| Long Term Trend: Not Good | |
| Medium Term Trend: Very Good | |
 XBI Daily Chart |
|
| Short Term Trend: Very Good | |
| Overall Trend Score: 69 | |
| YTD Performance: 0.77% | |
| **Trend Scores & Views Are Only For Educational Purposes And Not For Investing | |
| 12Stocks.com: Top Performing Biotech Sector Stocks | ||||||||||||||||||||||||||||||||||||||||||||||||
 The top performing Biotech sector stocks year to date are
Now, more recently, over last week, the top performing Biotech sector stocks on the move are


|
||||||||||||||||||||||||||||||||||||||||||||||||
| 12Stocks.com: Investing in Biotech Sector using Exchange Traded Funds | |
|
The following table shows list of key exchange traded funds (ETF) that
help investors track Biotech Index. For detailed view, check out our ETF Funds section of our website. Quick View: Move mouse or cursor over ETF symbol (ticker) to view short-term Technical chart and over ETF name to view long term chart. Click on ticker or stock name for detailed view. Click on to add stock symbol to your watchlist and to view watchlist. |
12Stocks.com List of ETFs that track Biotech Index
| Ticker | ETF Name | Watchlist | Recent Price | Market Intelligence Score | Change % | Week % | Year-to-date % |
| LABD | Biotech Bear 3X | | 8.28 | 36 | -5.48 | -21.29 | -14.55% |
| XBI | Biotech | | 89.98 | 69 | 1.86 | 7.77 | 0.77% |
| LABU | Biotech Bull 3X | | 108.99 | 64 | 5.83 | 24.55 | -10.64% |
| IBB | Biotechnology | | 132.97 | 69 | 1.78 | 5.12 | -2.12% |
| IYH | Healthcare | | 59.26 | 32 | 0.24 | 1.11 | 3.51% |
| IHF | Healthcare Providers | | 51.70 | 30 | 0.10 | -0.42 | -1.54% |
| BIB | Biotechnology | | 55.90 | 74 | 3.90 | 12.57 | -2.02% |
| IXJ | Global Healthcare | | 89.66 | 57 | 0.31 | 0.61 | 3.39% |
| CURE | Healthcare Bull 3X | | 106.89 | 57 | 1.02 | 1.51 | 5.06% |
| PBE | Biotech & Genome | | 64.19 | 49 | 0.98 | 6.32 | -2.5% |
| FBT | First NYSE | | 148.03 | 37 | 0.67 | 3.05 | -6.34% |
| PTH | DWA Healthcare Momentum | | 42.38 | 57 | 1.53 | 6.24 | 8.28% |
| BIS | Short Biotech | | 18.59 | 36 | -0.37 | -8.06 | 2.88% |
| BBC | Bio Biotechnology Clinical | | 27.89 | 49 | 2.05 | 9.24 | 14.06% |
| BBH | Biotech | | 164.77 | 100 | 2.65 | 5.86 | -0.33% |
| BTEC | Principal Healthcare Innovators | | 36.49 | 69 | 1.40 | 6.54 | 0.44% |
| BBP | Bio Biotechnology Products | | 55.49 | 52 | 2.10 | 7.78 | -4.48% |
| 12Stocks.com: Charts, Trends, Fundamental Data and Performances of Biotech Stocks | |
|
We now take in-depth look at all Biotech stocks including charts, multi-period performances and overall trends (as measured by market intelligence score). One can sort Biotech stocks (click link to choose) by Daily, Weekly and by Year-to-Date performances. Also, one can sort by size of the company or by market capitalization. |
| Select Your Default Chart Type: | |||||
| |||||
| Click on stock symbol or name for detailed view. Click on to add stock symbol to your watchlist and to view watchlist. Quick View: Move mouse or cursor over "Daily" to quickly view daily Technical stock chart and over "Weekly" to view weekly Technical stock chart. | |||||

 | CERT Certara, Inc. |
| Sector: Health Care | |
| SubSector: Biotechnology | |
| MarketCap: 21487 Millions | |
| Recent Price: 17.61 Market Intelligence Score: 100 | |
| Day Percent Change: -0.11% Day Change: -0.02 | |
| Week Change: 6.28% Year-to-date Change: 0.1% | |
| CERT Links: Profile News Message Board | |
| Charts:- Daily , Weekly | |
| Add CERT to Watchlist: View: Get Complete CERT Trend Analysis ➞ | |
 | ATAI Atai Life Sciences N.V. |
| Sector: Health Care | |
| SubSector: Biotechnology | |
| MarketCap: 287 Millions | |
| Recent Price: 2.05 Market Intelligence Score: 43 | |
| Day Percent Change: -3.76% Day Change: -0.08 | |
| Week Change: 6.22% Year-to-date Change: 45.4% | |
| ATAI Links: Profile News Message Board | |
| Charts:- Daily , Weekly | |
| Add ATAI to Watchlist: View: Get Complete ATAI Trend Analysis ➞ | |
 | IMVT Immunovant, Inc. |
| Sector: Health Care | |
| SubSector: Biotechnology | |
| MarketCap: 552.885 Millions | |
| Recent Price: 28.86 Market Intelligence Score: 50 | |
| Day Percent Change: 0.28% Day Change: 0.08 | |
| Week Change: 6.22% Year-to-date Change: -31.5% | |
| IMVT Links: Profile News Message Board | |
| Charts:- Daily , Weekly | |
| Add IMVT to Watchlist: View: Get Complete IMVT Trend Analysis ➞ | |
 | MLTX MoonLake Immunotherapeutics |
| Sector: Health Care | |
| SubSector: Biotechnology | |
| MarketCap: 2670 Millions | |
| Recent Price: 45.06 Market Intelligence Score: 64 | |
| Day Percent Change: 4.23% Day Change: 1.83 | |
| Week Change: 6.1% Year-to-date Change: -28.2% | |
| MLTX Links: Profile News Message Board | |
| Charts:- Daily , Weekly | |
| Add MLTX to Watchlist: View: Get Complete MLTX Trend Analysis ➞ | |
 | NUVL Nuvalent, Inc. |
| Sector: Health Care | |
| SubSector: Biotechnology | |
| MarketCap: 2400 Millions | |
| Recent Price: 70.82 Market Intelligence Score: 52 | |
| Day Percent Change: -0.66% Day Change: -0.47 | |
| Week Change: 6.02% Year-to-date Change: -3.6% | |
| NUVL Links: Profile News Message Board | |
| Charts:- Daily , Weekly | |
| Add NUVL to Watchlist: View: Get Complete NUVL Trend Analysis ➞ | |
 | DERM Dermira, Inc. |
| Sector: Health Care | |
| SubSector: Biotechnology | |
| MarketCap: 1312.25 Millions | |
| Recent Price: 3.60 Market Intelligence Score: 34 | |
| Day Percent Change: -0.83% Day Change: -0.03 | |
| Week Change: 5.88% Year-to-date Change: -37.5% | |
| DERM Links: Profile News Message Board | |
| Charts:- Daily , Weekly | |
| Add DERM to Watchlist: View: Get Complete DERM Trend Analysis ➞ | |
 | ALLO Allogene Therapeutics, Inc. |
| Sector: Health Care | |
| SubSector: Biotechnology | |
| MarketCap: 2858.65 Millions | |
| Recent Price: 3.06 Market Intelligence Score: 32 | |
| Day Percent Change: 3.03% Day Change: 0.09 | |
| Week Change: 5.88% Year-to-date Change: -4.7% | |
| ALLO Links: Profile News Message Board | |
| Charts:- Daily , Weekly | |
| Add ALLO to Watchlist: View: Get Complete ALLO Trend Analysis ➞ | |
 | IPHA Innate Pharma S.A. |
| Sector: Health Care | |
| SubSector: Biotechnology | |
| MarketCap: 309.485 Millions | |
| Recent Price: 2.40 Market Intelligence Score: 49 | |
| Day Percent Change: -1.23% Day Change: -0.03 | |
| Week Change: 5.73% Year-to-date Change: -14.3% | |
| IPHA Links: Profile News Message Board | |
| Charts:- Daily , Weekly | |
| Add IPHA to Watchlist: View: Get Complete IPHA Trend Analysis ➞ | |
 | SRRK Scholar Rock Holding Corporation |
| Sector: Health Care | |
| SubSector: Biotechnology | |
| MarketCap: 441.385 Millions | |
| Recent Price: 15.36 Market Intelligence Score: 77 | |
| Day Percent Change: 1.72% Day Change: 0.26 | |
| Week Change: 5.71% Year-to-date Change: -18.3% | |
| SRRK Links: Profile News Message Board | |
| Charts:- Daily , Weekly | |
| Add SRRK to Watchlist: View: Get Complete SRRK Trend Analysis ➞ | |
 | ZNTL Zentalis Pharmaceuticals, Inc. |
| Sector: Health Care | |
| SubSector: Biotechnology | |
| MarketCap: 22187 Millions | |
| Recent Price: 11.69 Market Intelligence Score: 42 | |
| Day Percent Change: 5.22% Day Change: 0.58 | |
| Week Change: 5.7% Year-to-date Change: -22.9% | |
| ZNTL Links: Profile News Message Board | |
| Charts:- Daily , Weekly | |
| Add ZNTL to Watchlist: View: Get Complete ZNTL Trend Analysis ➞ | |
 | TRDA Entrada Therapeutics, Inc. |
| Sector: Health Care | |
| SubSector: Biotechnology | |
| MarketCap: 481 Millions | |
| Recent Price: 13.16 Market Intelligence Score: 77 | |
| Day Percent Change: 1.70% Day Change: 0.22 | |
| Week Change: 5.7% Year-to-date Change: -19.8% | |
| TRDA Links: Profile News Message Board | |
| Charts:- Daily , Weekly | |
| Add TRDA to Watchlist: View: Get Complete TRDA Trend Analysis ➞ | |
 | AVDL Avadel Pharmaceuticals plc |
| Sector: Health Care | |
| SubSector: Biotechnology | |
| MarketCap: 354.485 Millions | |
| Recent Price: 18.81 Market Intelligence Score: 95 | |
| Day Percent Change: 2.79% Day Change: 0.51 | |
| Week Change: 5.61% Year-to-date Change: 33.2% | |
| AVDL Links: Profile News Message Board | |
| Charts:- Daily , Weekly | |
| Add AVDL to Watchlist: View: Get Complete AVDL Trend Analysis ➞ | |
 | MIRM Mirum Pharmaceuticals, Inc. |
| Sector: Health Care | |
| SubSector: Biotechnology | |
| MarketCap: 309.585 Millions | |
| Recent Price: 25.83 Market Intelligence Score: 64 | |
| Day Percent Change: 0.90% Day Change: 0.23 | |
| Week Change: 5.6% Year-to-date Change: -12.5% | |
| MIRM Links: Profile News Message Board | |
| Charts:- Daily , Weekly | |
| Add MIRM to Watchlist: View: Get Complete MIRM Trend Analysis ➞ | |
 | BGNE BeiGene, Ltd. |
| Sector: Health Care | |
| SubSector: Biotechnology | |
| MarketCap: 10838.5 Millions | |
| Recent Price: 162.10 Market Intelligence Score: 69 | |
| Day Percent Change: 0.06% Day Change: 0.09 | |
| Week Change: 5.55% Year-to-date Change: -10.1% | |
| BGNE Links: Profile News Message Board | |
| Charts:- Daily , Weekly | |
| Add BGNE to Watchlist: View: Get Complete BGNE Trend Analysis ➞ | |
 | GMAB Genmab A/S |
| Sector: Health Care | |
| SubSector: Biotechnology | |
| MarketCap: 12482.3 Millions | |
| Recent Price: 29.71 Market Intelligence Score: 100 | |
| Day Percent Change: 7.18% Day Change: 1.99 | |
| Week Change: 5.54% Year-to-date Change: -6.7% | |
| GMAB Links: Profile News Message Board | |
| Charts:- Daily , Weekly | |
| Add GMAB to Watchlist: View: Get Complete GMAB Trend Analysis ➞ | |
 | DYN Dyne Therapeutics, Inc. |
| Sector: Health Care | |
| SubSector: Biotechnology | |
| MarketCap: 88487 Millions | |
| Recent Price: 26.08 Market Intelligence Score: 34 | |
| Day Percent Change: 0.31% Day Change: 0.08 | |
| Week Change: 5.46% Year-to-date Change: 96.1% | |
| DYN Links: Profile News Message Board | |
| Charts:- Daily , Weekly | |
| Add DYN to Watchlist: View: Get Complete DYN Trend Analysis ➞ | |
 | VRCA Verrica Pharmaceuticals Inc. |
| Sector: Health Care | |
| SubSector: Biotechnology | |
| MarketCap: 289.585 Millions | |
| Recent Price: 7.25 Market Intelligence Score: 73 | |
| Day Percent Change: 7.17% Day Change: 0.49 | |
| Week Change: 5.46% Year-to-date Change: -1.0% | |
| VRCA Links: Profile News Message Board | |
| Charts:- Daily , Weekly | |
| Add VRCA to Watchlist: View: Get Complete VRCA Trend Analysis ➞ | |
 | VNDA Vanda Pharmaceuticals Inc. |
| Sector: Health Care | |
| SubSector: Biotechnology | |
| MarketCap: 464.585 Millions | |
| Recent Price: 4.87 Market Intelligence Score: 81 | |
| Day Percent Change: 4.06% Day Change: 0.19 | |
| Week Change: 5.41% Year-to-date Change: 15.4% | |
| VNDA Links: Profile News Message Board | |
| Charts:- Daily , Weekly | |
| Add VNDA to Watchlist: View: Get Complete VNDA Trend Analysis ➞ | |
 | VCYT Veracyte, Inc. |
| Sector: Health Care | |
| SubSector: Biotechnology | |
| MarketCap: 1089.05 Millions | |
| Recent Price: 20.34 Market Intelligence Score: 64 | |
| Day Percent Change: 0.74% Day Change: 0.15 | |
| Week Change: 5.33% Year-to-date Change: -26.1% | |
| VCYT Links: Profile News Message Board | |
| Charts:- Daily , Weekly | |
| Add VCYT to Watchlist: View: Get Complete VCYT Trend Analysis ➞ | |
 | LGND Ligand Pharmaceuticals Incorporated |
| Sector: Health Care | |
| SubSector: Biotechnology | |
| MarketCap: 1344.45 Millions | |
| Recent Price: 74.05 Market Intelligence Score: 49 | |
| Day Percent Change: 2.39% Day Change: 1.73 | |
| Week Change: 4.93% Year-to-date Change: 3.7% | |
| LGND Links: Profile News Message Board | |
| Charts:- Daily , Weekly | |
| Add LGND to Watchlist: View: Get Complete LGND Trend Analysis ➞ | |
 | KURA Kura Oncology, Inc. |
| Sector: Health Care | |
| SubSector: Biotechnology | |
| MarketCap: 401.885 Millions | |
| Recent Price: 20.61 Market Intelligence Score: 64 | |
| Day Percent Change: 0.10% Day Change: 0.02 | |
| Week Change: 4.89% Year-to-date Change: 43.3% | |
| KURA Links: Profile News Message Board | |
| Charts:- Daily , Weekly | |
| Add KURA to Watchlist: View: Get Complete KURA Trend Analysis ➞ | |
 | KROS Keros Therapeutics, Inc. |
| Sector: Health Care | |
| SubSector: Biotechnology | |
| MarketCap: 17887 Millions | |
| Recent Price: 60.65 Market Intelligence Score: 59 | |
| Day Percent Change: 6.22% Day Change: 3.55 | |
| Week Change: 4.82% Year-to-date Change: 52.2% | |
| KROS Links: Profile News Message Board | |
| Charts:- Daily , Weekly | |
| Add KROS to Watchlist: View: Get Complete KROS Trend Analysis ➞ | |
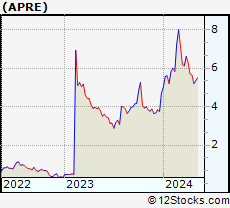 | APRE Aprea Therapeutics, Inc. |
| Sector: Health Care | |
| SubSector: Biotechnology | |
| MarketCap: 699.285 Millions | |
| Recent Price: 5.45 Market Intelligence Score: 32 | |
| Day Percent Change: 0.00% Day Change: 0.00 | |
| Week Change: 4.81% Year-to-date Change: 16.0% | |
| APRE Links: Profile News Message Board | |
| Charts:- Daily , Weekly | |
| Add APRE to Watchlist: View: Get Complete APRE Trend Analysis ➞ | |
 | DVAX Dynavax Technologies Corporation |
| Sector: Health Care | |
| SubSector: Biotechnology | |
| MarketCap: 276.885 Millions | |
| Recent Price: 11.73 Market Intelligence Score: 57 | |
| Day Percent Change: 0.13% Day Change: 0.01 | |
| Week Change: 4.68% Year-to-date Change: -16.1% | |
| DVAX Links: Profile News Message Board | |
| Charts:- Daily , Weekly | |
| Add DVAX to Watchlist: View: Get Complete DVAX Trend Analysis ➞ | |
 | SNDX Syndax Pharmaceuticals, Inc. |
| Sector: Health Care | |
| SubSector: Biotechnology | |
| MarketCap: 365.985 Millions | |
| Recent Price: 22.04 Market Intelligence Score: 74 | |
| Day Percent Change: 0.82% Day Change: 0.18 | |
| Week Change: 4.65% Year-to-date Change: 2.0% | |
| SNDX Links: Profile News Message Board | |
| Charts:- Daily , Weekly | |
| Add SNDX to Watchlist: View: Get Complete SNDX Trend Analysis ➞ | |
| To view more stocks, click on Next / Previous arrows or select different range: 0 - 25 , 25 - 50 , 50 - 75 , 75 - 100 , 100 - 125 , 125 - 150 , 150 - 175 , 175 - 200 , 200 - 225 , 225 - 250 , 250 - 275 , 275 - 300 , 300 - 325 , 325 - 350 , 350 - 375 , 375 - 400 | ||
| Click To Change The Sort Order: By Market Cap or Company Size Performance: Year-to-date, Week and Day | |
| Select Chart Type: | ||
|
Best Stocks Today 12Stocks.com |
© 2024 12Stocks.com Terms & Conditions Privacy Contact Us
All Information Provided Only For Education And Not To Be Used For Investing or Trading. See Terms & Conditions


One More Thing ... Get Best Stocks Delivered Daily!
Never Ever Miss A Move With Our Top Ten Stocks Lists
Find Best Stocks In Any Market - Bull or Bear Market
Take A Peek At Our Top Ten Stocks Lists: Daily, Weekly, Year-to-Date & Top Trends
Find Best Stocks In Any Market - Bull or Bear Market
Take A Peek At Our Top Ten Stocks Lists: Daily, Weekly, Year-to-Date & Top Trends
Biotech Stocks With Best Up Trends [0-bearish to 100-bullish]: Emergent Bio[100], Amgen [100], Quantum-Si [100], Janux [100], SIGA Technologies[100], Genmab A/S[100], Black Diamond[100], PMV [100], Wave Life[100], Voyager [100], Revolution Medicines[100]
Best Biotech Stocks Year-to-Date:
Pieris [5965.93%], Avenue [2952.79%], Precision [2749.32%], Inovio [2276.47%], Assembly [1485.17%], Agenus [1475.07%], Adverum nologies[1289.48%], NuCana [1255.65%], Affimed N.V[772%], Mesoblast [582.73%], Corbus [543.46%] Best Biotech Stocks This Week:
CytomX [180.19%], Emergent Bio[102.6%], Deciphera [73.14%], Cue Biopharma[56.04%], Codexis [47.37%], Abeona [41.56%], Seres [38.18%], Ardelyx [35.51%], Poseida [35.21%], CureVac N.V[33.91%], Wave Life[32.08%] Best Biotech Stocks Daily:
Ardelyx [28.13%], Emergent Bio[17.88%], Codexis [17.37%], Vaxxinity [17.27%], Abeona [13.39%], Cue Biopharma[13.30%], Lantern Pharma[13.11%], Vir nology[13.07%], CureVac N.V[12.64%], Ginkgo Bioworks[12.33%], Rani [12.13%]