
 Login Sign Up


| |||||
 |  | ||||

| 12Stocks.com Market Intelligence |
Best Biotech Stocks
|
|
| Quick Read: Best Biotech Stocks List By Performances & Trends: Daily, Weekly, Year-to-Date, Market Cap (Size) & Technical Trends | |||
| Best Biotech Stocks Views: Quick Browse View, Summary & Slide Show View | |||
| 12Stocks.com Biotech Stocks Performances & Trends Daily | |||||||||
|
|  The overall market intelligence score is 69 (0-bearish to 100-bullish) which puts Biotech sector in short term neutral to bullish trend. The market intelligence score from previous trading session is 50 and hence an improvement of trend.
| ||||||||
Here are the market intelligence trend scores of the most requested Biotech stocks at 12Stocks.com (click stock name for detailed review):
|


| 12Stocks.com: Investing in Biotech sector with Stocks | |
|
The following table helps investors and traders sort through current performance and trends (as measured by market intelligence score) of various
stocks in the Biotech sector. Quick View: Move mouse or cursor over stock symbol (ticker) to view short-term Technical chart and over stock name to view long term chart. Click on  to add stock symbol to your watchlist and to add stock symbol to your watchlist and  to view watchlist. Click on any ticker or stock name for detailed market intelligence report for that stock. to view watchlist. Click on any ticker or stock name for detailed market intelligence report for that stock. |
12Stocks.com Performance of Stocks in Biotech Sector
| Ticker | Stock Name | Watchlist | Category | Recent Price | Market Intelligence Score | Change % | Weekly Change% |
| RNA | Avidity |   | Biotechnology | 26.44 | 90 | 3.36% | 8.54% |
| FULC | Fulcrum | | Biotechnology | 7.75 | 49 | 1.31% | 8.54% |
| DERM | Dermira | | Biotechnology | 3.69 | 34 | 1.65% | 8.53% |
| REGN | Regeneron | | Biotechnology | 957.00 | 69 | 2.07% | 8.36% |
| IRON | Disc Medicine | | Biotechnology | 29.80 | 49 | 3.29% | 8.34% |
| REPL | Replimune | | Biotechnology | 6.95 | 54 | 5.95% | 8.26% |
| BEAM | Beam | | Biotechnology | 23.13 | 32 | 1.80% | 8.19% |
| BCYC | Bicycle | | Biotechnology | 24.58 | 62 | -0.45% | 8.14% |
| RPTX | Repare | | Biotechnology | 3.46 | 49 | 3.28% | 8.13% |
| XENE | Xenon | | Biotechnology | 43.75 | 64 | 1.74% | 8.02% |
| TSHA | Taysha Gene | | Biotechnology | 2.58 | 44 | 0.00% | 7.95% |
| RLYB | Rallybio | | Biotechnology | 1.84 | 22 | -0.27% | 7.94% |
| ANIK | Anika | | Biotechnology | 27.59 | 100 | 0.00% | 7.90% |
| XBIT | X | | Biotechnology | 8.49 | 75 | 5.86% | 7.88% |
| THRD | Third Harmonic | | Biotechnology | 11.68 | 93 | 0.78% | 7.85% |
| ITOS | iTeos | | Biotechnology | 11.65 | 93 | 1.35% | 7.82% |
| AFMD | Affimed N.V | | Biotechnology | 5.42 | 68 | 2.26% | 7.75% |
| NKTX | Nkarta | | Biotechnology | 7.40 | 39 | -1.73% | 7.71% |
| VOR | Vor Biopharma | | Biotechnology | 1.82 | 37 | 4.00% | 7.69% |
| MGNX | MacroGenics | | Biotechnology | 15.67 | 37 | 2.96% | 7.62% |
| CORT | Corcept | | Biotechnology | 24.52 | 93 | -2.15% | 7.54% |
| HRMY | Harmony | | Biotechnology | 31.52 | 74 | -0.54% | 7.50% |
| OCS | Oculis Holding | | Biotechnology | 12.92 | 65 | 0.86% | 7.49% |
| MRNS | Marinus | | Biotechnology | 1.51 | 39 | 4.14% | 7.47% |
| MRUS | Merus N.V | | Biotechnology | 48.36 | 82 | 1.81% | 7.37% |
| To view more stocks, click on Next / Previous arrows or select different range: 0 - 25 , 25 - 50 , 50 - 75 , 75 - 100 , 100 - 125 , 125 - 150 , 150 - 175 , 175 - 200 , 200 - 225 , 225 - 250 , 250 - 275 , 275 - 300 , 300 - 325 , 325 - 350 , 350 - 375 , 375 - 400 | ||
 | Click To Change The Sort Order: By Market Cap or Company Size Performance: Year-to-date, Week and Day |  |
|
Get the most comprehensive stock market coverage daily at 12Stocks.com ➞ Best Stocks Today ➞ Best Stocks Weekly ➞ Best Stocks Year-to-Date ➞ Best Stocks Trends ➞  Best Stocks Today 12Stocks.com Best Nasdaq Stocks ➞ Best S&P 500 Stocks ➞ Best Tech Stocks ➞ Best Biotech Stocks ➞ |
| Detailed Overview of Biotech Stocks |
| Biotech Technical Overview, Leaders & Laggards, Top Biotech ETF Funds & Detailed Biotech Stocks List, Charts, Trends & More |
| Biotech Sector: Technical Analysis, Trends & YTD Performance | |
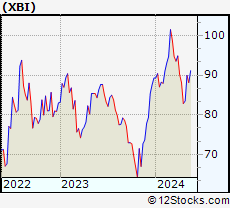
| Biotech sector, as represented by XBI, an exchange-traded fund [ETF] that holds basket of Biotech stocks (e.g, Amgen, Celgene) is up by 0.77% and is currently underperforming the overall market by -6.11% year-to-date. Below is a quick view of Technical charts and trends: | |
 XBI Weekly Chart |
|
| Long Term Trend: Not Good | |
| Medium Term Trend: Very Good | |
 XBI Daily Chart |
|
| Short Term Trend: Very Good | |
| Overall Trend Score: 69 | |
| YTD Performance: 0.77% | |
| **Trend Scores & Views Are Only For Educational Purposes And Not For Investing | |
| 12Stocks.com: Top Performing Biotech Sector Stocks | ||||||||||||||||||||||||||||||||||||||||||||||||
 The top performing Biotech sector stocks year to date are
Now, more recently, over last week, the top performing Biotech sector stocks on the move are


|
||||||||||||||||||||||||||||||||||||||||||||||||
| 12Stocks.com: Investing in Biotech Sector using Exchange Traded Funds | |
|
The following table shows list of key exchange traded funds (ETF) that
help investors track Biotech Index. For detailed view, check out our ETF Funds section of our website. Quick View: Move mouse or cursor over ETF symbol (ticker) to view short-term Technical chart and over ETF name to view long term chart. Click on ticker or stock name for detailed view. Click on to add stock symbol to your watchlist and to view watchlist. |
12Stocks.com List of ETFs that track Biotech Index
| Ticker | ETF Name | Watchlist | Recent Price | Market Intelligence Score | Change % | Week % | Year-to-date % |
| LABD | Biotech Bear 3X | | 8.28 | 36 | -5.48 | -21.29 | -14.55% |
| XBI | Biotech | | 89.98 | 69 | 1.86 | 7.77 | 0.77% |
| LABU | Biotech Bull 3X | | 108.99 | 64 | 5.83 | 24.55 | -10.64% |
| IBB | Biotechnology | | 132.96 | 69 | 1.77 | 5.12 | -2.13% |
| IYH | Healthcare | | 59.26 | 32 | 0.24 | 1.11 | 3.51% |
| IHF | Healthcare Providers | | 51.69 | 30 | 0.08 | -0.44 | -1.56% |
| BIB | Biotechnology | | 55.63 | 74 | 3.40 | 12.02 | -2.49% |
| IXJ | Global Healthcare | | 89.66 | 52 | 0.31 | 0.61 | 3.39% |
| CURE | Healthcare Bull 3X | | 106.89 | 57 | 1.02 | 1.51 | 5.06% |
| PBE | Biotech & Genome | | 64.11 | 49 | 0.85 | 6.18 | -2.63% |
| FBT | First NYSE | | 148.20 | 37 | 0.79 | 3.17 | -6.24% |
| PTH | DWA Healthcare Momentum | | 42.05 | 69 | 0.74 | 5.41 | 7.43% |
| BIS | Short Biotech | | 17.99 | 36 | -3.59 | -11.03 | -0.44% |
| BBC | Bio Biotechnology Clinical | | 27.89 | 49 | 2.05 | 9.24 | 14.06% |
| BBH | Biotech | | 164.15 | 100 | 2.27 | 5.46 | -0.7% |
| BTEC | Principal Healthcare Innovators | | 36.97 | 69 | 2.74 | 7.94 | 1.76% |
| BBP | Bio Biotechnology Products | | 55.49 | 64 | 2.10 | 7.78 | -4.48% |
| 12Stocks.com: Charts, Trends, Fundamental Data and Performances of Biotech Stocks | |
|
We now take in-depth look at all Biotech stocks including charts, multi-period performances and overall trends (as measured by market intelligence score). One can sort Biotech stocks (click link to choose) by Daily, Weekly and by Year-to-Date performances. Also, one can sort by size of the company or by market capitalization. |
| Select Your Default Chart Type: | |||||
| |||||
| Click on stock symbol or name for detailed view. Click on to add stock symbol to your watchlist and to view watchlist. Quick View: Move mouse or cursor over "Daily" to quickly view daily Technical stock chart and over "Weekly" to view weekly Technical stock chart. | |||||

 | RNA Avidity Biosciences, Inc. |
| Sector: Health Care | |
| SubSector: Biotechnology | |
| MarketCap: 12287 Millions | |
| Recent Price: 26.44 Market Intelligence Score: 90 | |
| Day Percent Change: 3.36% Day Change: 0.86 | |
| Week Change: 8.54% Year-to-date Change: 192.5% | |
| RNA Links: Profile News Message Board | |
| Charts:- Daily , Weekly | |
| Add RNA to Watchlist: View: Get Complete RNA Trend Analysis ➞ | |
 | FULC Fulcrum Therapeutics, Inc. |
| Sector: Health Care | |
| SubSector: Biotechnology | |
| MarketCap: 274.785 Millions | |
| Recent Price: 7.75 Market Intelligence Score: 49 | |
| Day Percent Change: 1.31% Day Change: 0.10 | |
| Week Change: 8.54% Year-to-date Change: 14.8% | |
| FULC Links: Profile News Message Board | |
| Charts:- Daily , Weekly | |
| Add FULC to Watchlist: View: Get Complete FULC Trend Analysis ➞ | |
 | DERM Dermira, Inc. |
| Sector: Health Care | |
| SubSector: Biotechnology | |
| MarketCap: 1312.25 Millions | |
| Recent Price: 3.69 Market Intelligence Score: 34 | |
| Day Percent Change: 1.65% Day Change: 0.06 | |
| Week Change: 8.53% Year-to-date Change: -35.9% | |
| DERM Links: Profile News Message Board | |
| Charts:- Daily , Weekly | |
| Add DERM to Watchlist: View: Get Complete DERM Trend Analysis ➞ | |
 | REGN Regeneron Pharmaceuticals, Inc. |
| Sector: Health Care | |
| SubSector: Biotechnology | |
| MarketCap: 51903.7 Millions | |
| Recent Price: 957.00 Market Intelligence Score: 69 | |
| Day Percent Change: 2.07% Day Change: 19.39 | |
| Week Change: 8.36% Year-to-date Change: 9.0% | |
| REGN Links: Profile News Message Board | |
| Charts:- Daily , Weekly | |
| Add REGN to Watchlist: View: Get Complete REGN Trend Analysis ➞ | |
 | IRON Disc Medicine Opco Inc |
| Sector: Health Care | |
| SubSector: Biotechnology | |
| MarketCap: 1100 Millions | |
| Recent Price: 29.80 Market Intelligence Score: 49 | |
| Day Percent Change: 3.29% Day Change: 0.95 | |
| Week Change: 8.34% Year-to-date Change: -48.6% | |
| IRON Links: Profile News Message Board | |
| Charts:- Daily , Weekly | |
| Add IRON to Watchlist: View: Get Complete IRON Trend Analysis ➞ | |
 | REPL Replimune Group, Inc. |
| Sector: Health Care | |
| SubSector: Biotechnology | |
| MarketCap: 367.885 Millions | |
| Recent Price: 6.95 Market Intelligence Score: 54 | |
| Day Percent Change: 5.95% Day Change: 0.39 | |
| Week Change: 8.26% Year-to-date Change: -17.6% | |
| REPL Links: Profile News Message Board | |
| Charts:- Daily , Weekly | |
| Add REPL to Watchlist: View: Get Complete REPL Trend Analysis ➞ | |
 | BEAM Beam Therapeutics Inc. |
| Sector: Health Care | |
| SubSector: Biotechnology | |
| MarketCap: 44987 Millions | |
| Recent Price: 23.13 Market Intelligence Score: 32 | |
| Day Percent Change: 1.80% Day Change: 0.41 | |
| Week Change: 8.19% Year-to-date Change: -15.0% | |
| BEAM Links: Profile News Message Board | |
| Charts:- Daily , Weekly | |
| Add BEAM to Watchlist: View: Get Complete BEAM Trend Analysis ➞ | |
 | BCYC Bicycle Therapeutics plc |
| Sector: Health Care | |
| SubSector: Biotechnology | |
| MarketCap: 214.485 Millions | |
| Recent Price: 24.58 Market Intelligence Score: 62 | |
| Day Percent Change: -0.45% Day Change: -0.11 | |
| Week Change: 8.14% Year-to-date Change: 36.0% | |
| BCYC Links: Profile News Message Board | |
| Charts:- Daily , Weekly | |
| Add BCYC to Watchlist: View: Get Complete BCYC Trend Analysis ➞ | |
 | RPTX Repare Therapeutics Inc. |
| Sector: Health Care | |
| SubSector: Biotechnology | |
| MarketCap: 13687 Millions | |
| Recent Price: 3.46 Market Intelligence Score: 49 | |
| Day Percent Change: 3.28% Day Change: 0.11 | |
| Week Change: 8.13% Year-to-date Change: -52.6% | |
| RPTX Links: Profile News Message Board | |
| Charts:- Daily , Weekly | |
| Add RPTX to Watchlist: View: Get Complete RPTX Trend Analysis ➞ | |
 | XENE Xenon Pharmaceuticals Inc. |
| Sector: Health Care | |
| SubSector: Biotechnology | |
| MarketCap: 388.585 Millions | |
| Recent Price: 43.75 Market Intelligence Score: 64 | |
| Day Percent Change: 1.74% Day Change: 0.75 | |
| Week Change: 8.02% Year-to-date Change: -5.0% | |
| XENE Links: Profile News Message Board | |
| Charts:- Daily , Weekly | |
| Add XENE to Watchlist: View: Get Complete XENE Trend Analysis ➞ | |
 | TSHA Taysha Gene Therapies, Inc. |
| Sector: Health Care | |
| SubSector: Biotechnology | |
| MarketCap: 76487 Millions | |
| Recent Price: 2.58 Market Intelligence Score: 44 | |
| Day Percent Change: 0.00% Day Change: 0.00 | |
| Week Change: 7.95% Year-to-date Change: 44.9% | |
| TSHA Links: Profile News Message Board | |
| Charts:- Daily , Weekly | |
| Add TSHA to Watchlist: View: Get Complete TSHA Trend Analysis ➞ | |
 | RLYB Rallybio Corporation |
| Sector: Health Care | |
| SubSector: Biotechnology | |
| MarketCap: 226 Millions | |
| Recent Price: 1.84 Market Intelligence Score: 22 | |
| Day Percent Change: -0.27% Day Change: -0.01 | |
| Week Change: 7.94% Year-to-date Change: -22.3% | |
| RLYB Links: Profile News Message Board | |
| Charts:- Daily , Weekly | |
| Add RLYB to Watchlist: View: Get Complete RLYB Trend Analysis ➞ | |
 | ANIK Anika Therapeutics, Inc. |
| Sector: Health Care | |
| SubSector: Biotechnology | |
| MarketCap: 438.385 Millions | |
| Recent Price: 27.59 Market Intelligence Score: 100 | |
| Day Percent Change: 0.00% Day Change: 0.00 | |
| Week Change: 7.9% Year-to-date Change: 21.8% | |
| ANIK Links: Profile News Message Board | |
| Charts:- Daily , Weekly | |
| Add ANIK to Watchlist: View: Get Complete ANIK Trend Analysis ➞ | |
 | XBIT XBiotech Inc. |
| Sector: Health Care | |
| SubSector: Biotechnology | |
| MarketCap: 420.385 Millions | |
| Recent Price: 8.49 Market Intelligence Score: 75 | |
| Day Percent Change: 5.86% Day Change: 0.47 | |
| Week Change: 7.88% Year-to-date Change: 112.3% | |
| XBIT Links: Profile News Message Board | |
| Charts:- Daily , Weekly | |
| Add XBIT to Watchlist: View: Get Complete XBIT Trend Analysis ➞ | |
 | THRD Third Harmonic Bio, Inc. |
| Sector: Health Care | |
| SubSector: Biotechnology | |
| MarketCap: 190 Millions | |
| Recent Price: 11.68 Market Intelligence Score: 93 | |
| Day Percent Change: 0.78% Day Change: 0.09 | |
| Week Change: 7.85% Year-to-date Change: 6.0% | |
| THRD Links: Profile News Message Board | |
| Charts:- Daily , Weekly | |
| Add THRD to Watchlist: View: Get Complete THRD Trend Analysis ➞ | |
 | ITOS iTeos Therapeutics, Inc. |
| Sector: Health Care | |
| SubSector: Biotechnology | |
| MarketCap: 10487 Millions | |
| Recent Price: 11.65 Market Intelligence Score: 93 | |
| Day Percent Change: 1.35% Day Change: 0.15 | |
| Week Change: 7.82% Year-to-date Change: 6.4% | |
| ITOS Links: Profile News Message Board | |
| Charts:- Daily , Weekly | |
| Add ITOS to Watchlist: View: Get Complete ITOS Trend Analysis ➞ | |
 | AFMD Affimed N.V. |
| Sector: Health Care | |
| SubSector: Biotechnology | |
| MarketCap: 161.385 Millions | |
| Recent Price: 5.42 Market Intelligence Score: 68 | |
| Day Percent Change: 2.26% Day Change: 0.12 | |
| Week Change: 7.75% Year-to-date Change: 767.2% | |
| AFMD Links: Profile News Message Board | |
| Charts:- Daily , Weekly | |
| Add AFMD to Watchlist: View: Get Complete AFMD Trend Analysis ➞ | |
 | NKTX Nkarta, Inc. |
| Sector: Health Care | |
| SubSector: Biotechnology | |
| MarketCap: 23487 Millions | |
| Recent Price: 7.40 Market Intelligence Score: 39 | |
| Day Percent Change: -1.73% Day Change: -0.13 | |
| Week Change: 7.71% Year-to-date Change: 12.2% | |
| NKTX Links: Profile News Message Board | |
| Charts:- Daily , Weekly | |
| Add NKTX to Watchlist: View: Get Complete NKTX Trend Analysis ➞ | |
 | VOR Vor Biopharma Inc. |
| Sector: Health Care | |
| SubSector: Biotechnology | |
| MarketCap: 224 Millions | |
| Recent Price: 1.82 Market Intelligence Score: 37 | |
| Day Percent Change: 4.00% Day Change: 0.07 | |
| Week Change: 7.69% Year-to-date Change: -18.0% | |
| VOR Links: Profile News Message Board | |
| Charts:- Daily , Weekly | |
| Add VOR to Watchlist: View: Get Complete VOR Trend Analysis ➞ | |
 | MGNX MacroGenics, Inc. |
| Sector: Health Care | |
| SubSector: Biotechnology | |
| MarketCap: 262.785 Millions | |
| Recent Price: 15.67 Market Intelligence Score: 37 | |
| Day Percent Change: 2.96% Day Change: 0.45 | |
| Week Change: 7.62% Year-to-date Change: 62.9% | |
| MGNX Links: Profile News Message Board | |
| Charts:- Daily , Weekly | |
| Add MGNX to Watchlist: View: Get Complete MGNX Trend Analysis ➞ | |
 | CORT Corcept Therapeutics Incorporated |
| Sector: Health Care | |
| SubSector: Biotechnology | |
| MarketCap: 1228.45 Millions | |
| Recent Price: 24.52 Market Intelligence Score: 93 | |
| Day Percent Change: -2.15% Day Change: -0.54 | |
| Week Change: 7.54% Year-to-date Change: -24.5% | |
| CORT Links: Profile News Message Board | |
| Charts:- Daily , Weekly | |
| Add CORT to Watchlist: View: Get Complete CORT Trend Analysis ➞ | |
 | HRMY Harmony Biosciences Holdings, Inc. |
| Sector: Health Care | |
| SubSector: Biotechnology | |
| MarketCap: 24487 Millions | |
| Recent Price: 31.52 Market Intelligence Score: 74 | |
| Day Percent Change: -0.54% Day Change: -0.17 | |
| Week Change: 7.5% Year-to-date Change: -2.4% | |
| HRMY Links: Profile News Message Board | |
| Charts:- Daily , Weekly | |
| Add HRMY to Watchlist: View: Get Complete HRMY Trend Analysis ➞ | |
 | OCS Oculis Holding AG |
| Sector: Health Care | |
| SubSector: Biotechnology | |
| MarketCap: 460 Millions | |
| Recent Price: 12.92 Market Intelligence Score: 65 | |
| Day Percent Change: 0.86% Day Change: 0.11 | |
| Week Change: 7.49% Year-to-date Change: 16.4% | |
| OCS Links: Profile News Message Board | |
| Charts:- Daily , Weekly | |
| Add OCS to Watchlist: View: Get Complete OCS Trend Analysis ➞ | |
 | MRNS Marinus Pharmaceuticals, Inc. |
| Sector: Health Care | |
| SubSector: Biotechnology | |
| MarketCap: 222.885 Millions | |
| Recent Price: 1.51 Market Intelligence Score: 39 | |
| Day Percent Change: 4.14% Day Change: 0.06 | |
| Week Change: 7.47% Year-to-date Change: -86.1% | |
| MRNS Links: Profile News Message Board | |
| Charts:- Daily , Weekly | |
| Add MRNS to Watchlist: View: Get Complete MRNS Trend Analysis ➞ | |
 | MRUS Merus N.V. |
| Sector: Health Care | |
| SubSector: Biotechnology | |
| MarketCap: 417.385 Millions | |
| Recent Price: 48.36 Market Intelligence Score: 82 | |
| Day Percent Change: 1.81% Day Change: 0.86 | |
| Week Change: 7.37% Year-to-date Change: 75.9% | |
| MRUS Links: Profile News Message Board | |
| Charts:- Daily , Weekly | |
| Add MRUS to Watchlist: View: Get Complete MRUS Trend Analysis ➞ | |
| To view more stocks, click on Next / Previous arrows or select different range: 0 - 25 , 25 - 50 , 50 - 75 , 75 - 100 , 100 - 125 , 125 - 150 , 150 - 175 , 175 - 200 , 200 - 225 , 225 - 250 , 250 - 275 , 275 - 300 , 300 - 325 , 325 - 350 , 350 - 375 , 375 - 400 | ||
| Click To Change The Sort Order: By Market Cap or Company Size Performance: Year-to-date, Week and Day | |
| Select Chart Type: | ||
|
Best Stocks Today 12Stocks.com |
© 2024 12Stocks.com Terms & Conditions Privacy Contact Us
All Information Provided Only For Education And Not To Be Used For Investing or Trading. See Terms & Conditions


One More Thing ... Get Best Stocks Delivered Daily!
Never Ever Miss A Move With Our Top Ten Stocks Lists
Find Best Stocks In Any Market - Bull or Bear Market
Take A Peek At Our Top Ten Stocks Lists: Daily, Weekly, Year-to-Date & Top Trends
Find Best Stocks In Any Market - Bull or Bear Market
Take A Peek At Our Top Ten Stocks Lists: Daily, Weekly, Year-to-Date & Top Trends
Biotech Stocks With Best Up Trends [0-bearish to 100-bullish]: Emergent Bio[100], Amgen [100], Quantum-Si [100], Janux [100], SIGA Technologies[100], Verrica [100], Genmab A/S[100], Black Diamond[100], PMV [100], Wave Life[100], Voyager [100]
Best Biotech Stocks Year-to-Date:
Pieris [5987.91%], Avenue [2868.94%], Precision [2782.19%], Inovio [2272.55%], Assembly [1503.46%], Agenus [1478.69%], Adverum nologies[1285.49%], NuCana [1252.27%], Affimed N.V[767.2%], Mesoblast [581.82%], Corbus [541.89%] Best Biotech Stocks This Week:
CytomX [178.62%], Emergent Bio[102.6%], Deciphera [73.24%], Cue Biopharma[56.04%], Codexis [47.37%], Abeona [41.1%], Seres [40.61%], Ardelyx [35.83%], Poseida [35.21%], CureVac N.V[33.91%], Janux [31.95%] Best Biotech Stocks Daily:
Ardelyx [28.42%], Emergent Bio[17.88%], Codexis [17.37%], Vaxxinity [17.27%], Cue Biopharma[13.30%], Vir nology[13.18%], Lantern Pharma[13.11%], Abeona [13.02%], CureVac N.V[12.64%], Ginkgo Bioworks[12.33%], Rani [12.13%]