
 Login Sign Up


| |||||
 |  | ||||

| 12Stocks.com Market Intelligence |
Best Biotech Stocks
|
|
| Quick Read: Best Biotech Stocks List By Performances & Trends: Daily, Weekly, Year-to-Date, Market Cap (Size) & Technical Trends | |||
| Best Biotech Stocks Views: Quick Browse View, Summary & Slide Show View | |||
| 12Stocks.com Biotech Stocks Performances & Trends Daily | |||||||||
|
|  The overall market intelligence score is 32 (0-bearish to 100-bullish) which puts Biotech sector in short term bearish to neutral trend. The market intelligence score from previous trading session is 10 and hence an improvement of trend.
| ||||||||
Here are the market intelligence trend scores of the most requested Biotech stocks at 12Stocks.com (click stock name for detailed review):
|


| 12Stocks.com: Investing in Biotech sector with Stocks | |
|
The following table helps investors and traders sort through current performance and trends (as measured by market intelligence score) of various
stocks in the Biotech sector. Quick View: Move mouse or cursor over stock symbol (ticker) to view short-term Technical chart and over stock name to view long term chart. Click on  to add stock symbol to your watchlist and to add stock symbol to your watchlist and  to view watchlist. Click on any ticker or stock name for detailed market intelligence report for that stock. to view watchlist. Click on any ticker or stock name for detailed market intelligence report for that stock. |
12Stocks.com Performance of Stocks in Biotech Sector
| Ticker | Stock Name | Watchlist | Category | Recent Price | Market Intelligence Score | Change % | Weekly Change% |
| LYEL | Lyell Immunopharma |   | Biotechnology | 2.45 | 83 | 1.66% | 9.87% |
| SWTX | SpringWorks | | Biotechnology | 44.00 | 52 | 2.59% | 9.79% |
| RNA | Avidity | | Biotechnology | 25.14 | 90 | 4.06% | 9.64% |
| TYRA | Tyra | | Biotechnology | 16.36 | 75 | 5.52% | 9.18% |
| RGEN | Repligen | | Biotechnology | 171.28 | 42 | 8.76% | 9.00% |
| ATRA | Atara Bio | | Biotechnology | 0.72 | 73 | 3.04% | 8.71% |
| ARWR | Arrowhead | | Biotechnology | 24.26 | 49 | 1.34% | 8.64% |
| FULC | Fulcrum | | Biotechnology | 7.44 | 58 | 2.62% | 8.45% |
| PRLD | Prelude | | Biotechnology | 3.87 | 63 | 0.52% | 8.40% |
| TSHA | Taysha Gene | | Biotechnology | 2.53 | 63 | 2.85% | 8.35% |
| CVAC | CureVac N.V | | Biotechnology | 2.60 | 47 | 2.77% | 8.33% |
| QSI | Quantum-Si | | Biotechnology | 1.70 | 63 | 4.94% | 8.28% |
| NAMS | NewAmsterdam Pharma | | Biotechnology | 21.50 | 85 | 6.28% | 7.88% |
| ERAS | Erasca | | Biotechnology | 1.93 | 68 | 4.32% | 7.82% |
| AGIO | Agios | | Biotechnology | 31.81 | 100 | 5.30% | 7.72% |
| NUVL | Nuvalent | | Biotechnology | 67.56 | 49 | 4.76% | 7.65% |
| AXSM | Axsome | | Biotechnology | 73.08 | 64 | 2.70% | 7.63% |
| ADPT | Adaptive nologies | | Biotechnology | 2.58 | 47 | 2.38% | 7.50% |
| ARCT | Arcturus | | Biotechnology | 27.93 | 32 | 3.22% | 7.44% |
| ZLAB | Zai Lab | | Biotechnology | 15.12 | 49 | 0.87% | 7.39% |
| BGNE | BeiGene | | Biotechnology | 138.99 | 42 | 6.15% | 7.31% |
| ITOS | iTeos | | Biotechnology | 10.99 | 61 | 1.85% | 7.27% |
| BTAI | BioXcel | | Biotechnology | 2.97 | 69 | 4.21% | 7.22% |
| ESPR | Esperion | | Biotechnology | 2.09 | 37 | 9.42% | 7.18% |
| INO | Inovio | | Biotechnology | 10.37 | 68 | 3.49% | 7.13% |
| To view more stocks, click on Next / Previous arrows or select different range: 0 - 25 , 25 - 50 , 50 - 75 , 75 - 100 , 100 - 125 , 125 - 150 , 150 - 175 , 175 - 200 , 200 - 225 , 225 - 250 , 250 - 275 , 275 - 300 , 300 - 325 , 325 - 350 , 350 - 375 , 375 - 400 | ||
 | Click To Change The Sort Order: By Market Cap or Company Size Performance: Year-to-date, Week and Day |  |
|
Get the most comprehensive stock market coverage daily at 12Stocks.com ➞ Best Stocks Today ➞ Best Stocks Weekly ➞ Best Stocks Year-to-Date ➞ Best Stocks Trends ➞  Best Stocks Today 12Stocks.com Best Nasdaq Stocks ➞ Best S&P 500 Stocks ➞ Best Tech Stocks ➞ Best Biotech Stocks ➞ |
| Detailed Overview of Biotech Stocks |
| Biotech Technical Overview, Leaders & Laggards, Top Biotech ETF Funds & Detailed Biotech Stocks List, Charts, Trends & More |
| Biotech Sector: Technical Analysis, Trends & YTD Performance | |
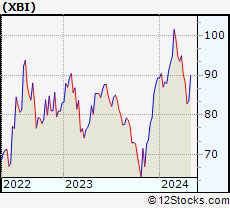
| Biotech sector, as represented by XBI, an exchange-traded fund [ETF] that holds basket of Biotech stocks (e.g, Amgen, Celgene) is down by -5.15% and is currently underperforming the overall market by -10.79% year-to-date. Below is a quick view of Technical charts and trends: | |
 XBI Weekly Chart |
|
| Long Term Trend: Not Good | |
| Medium Term Trend: Not Good | |
 XBI Daily Chart |
|
| Short Term Trend: Very Good | |
| Overall Trend Score: 32 | |
| YTD Performance: -5.15% | |
| **Trend Scores & Views Are Only For Educational Purposes And Not For Investing | |
| 12Stocks.com: Top Performing Biotech Sector Stocks | ||||||||||||||||||||||||||||||||||||||||||||||||
 The top performing Biotech sector stocks year to date are
Now, more recently, over last week, the top performing Biotech sector stocks on the move are


|
||||||||||||||||||||||||||||||||||||||||||||||||
| 12Stocks.com: Investing in Biotech Sector using Exchange Traded Funds | |
|
The following table shows list of key exchange traded funds (ETF) that
help investors track Biotech Index. For detailed view, check out our ETF Funds section of our website. Quick View: Move mouse or cursor over ETF symbol (ticker) to view short-term Technical chart and over ETF name to view long term chart. Click on ticker or stock name for detailed view. Click on to add stock symbol to your watchlist and to view watchlist. |
12Stocks.com List of ETFs that track Biotech Index
| Ticker | ETF Name | Watchlist | Recent Price | Market Intelligence Score | Change % | Week % | Year-to-date % |
| LABD | Biotech Bear 3X | | 10.07 | 55 | -6.33 | -6.76 | 3.92% |
| XBI | Biotech | | 84.69 | 32 | 2.28 | 2.25 | -5.15% |
| LABU | Biotech Bull 3X | | 91.98 | 32 | 6.42 | 6.89 | -24.59% |
| IBB | Biotechnology | | 128.02 | 32 | 1.51 | 2.65 | -5.76% |
| PBE | Biotech & Genome | | 61.14 | 39 | 0.82 | 2.16 | -7.14% |
| IXJ | Global Healthcare | | 89.62 | 65 | 1.37 | 2.13 | 3.34% |
| IYH | Healthcare | | 59.21 | 52 | 1.33 | 1.81 | 3.43% |
| IHF | Healthcare Providers | | 52.32 | 70 | 0.47 | 0.21 | -0.36% |
| CURE | Healthcare Bull 3X | | 108.12 | 39 | 3.52 | 4.64 | 6.27% |
| BIB | Biotechnology | | 50.33 | 39 | 2.51 | 4.42 | -11.78% |
| FBT | First NYSE | | 145.32 | 32 | 1.68 | 2.57 | -8.05% |
| BBH | Biotech | | 157.29 | 49 | 1.77 | 3.24 | -4.85% |
| BIS | Short Biotech | | 19.94 | 68 | -2.59 | -4.57 | 10.35% |
| PTH | DWA Healthcare Momentum | | 40.17 | 68 | 2.11 | 1.62 | 2.63% |
| BBP | Bio Biotechnology Products | | 52.39 | 42 | 1.87 | 3.89 | -9.81% |
| BTEC | Principal Healthcare Innovators | | 34.81 | 32 | 3.10 | 2.79 | -4.2% |
| BBC | Bio Biotechnology Clinical | | 25.67 | 51 | 3.26 | 3.89 | 4.98% |
| 12Stocks.com: Charts, Trends, Fundamental Data and Performances of Biotech Stocks | |
|
We now take in-depth look at all Biotech stocks including charts, multi-period performances and overall trends (as measured by market intelligence score). One can sort Biotech stocks (click link to choose) by Daily, Weekly and by Year-to-Date performances. Also, one can sort by size of the company or by market capitalization. |
| Select Your Default Chart Type: | |||||
| |||||
| Click on stock symbol or name for detailed view. Click on to add stock symbol to your watchlist and to view watchlist. Quick View: Move mouse or cursor over "Daily" to quickly view daily Technical stock chart and over "Weekly" to view weekly Technical stock chart. | |||||

 | LYEL Lyell Immunopharma, Inc. |
| Sector: Health Care | |
| SubSector: Biotechnology | |
| MarketCap: 809 Millions | |
| Recent Price: 2.45 Market Intelligence Score: 83 | |
| Day Percent Change: 1.66% Day Change: 0.04 | |
| Week Change: 9.87% Year-to-date Change: 24.7% | |
| LYEL Links: Profile News Message Board | |
| Charts:- Daily , Weekly | |
| Add LYEL to Watchlist: View: Get Complete LYEL Trend Analysis ➞ | |
 | SWTX SpringWorks Therapeutics, Inc. |
| Sector: Health Care | |
| SubSector: Biotechnology | |
| MarketCap: 1311.85 Millions | |
| Recent Price: 44.00 Market Intelligence Score: 52 | |
| Day Percent Change: 2.59% Day Change: 1.11 | |
| Week Change: 9.79% Year-to-date Change: 20.6% | |
| SWTX Links: Profile News Message Board | |
| Charts:- Daily , Weekly | |
| Add SWTX to Watchlist: View: Get Complete SWTX Trend Analysis ➞ | |
 | RNA Avidity Biosciences, Inc. |
| Sector: Health Care | |
| SubSector: Biotechnology | |
| MarketCap: 12287 Millions | |
| Recent Price: 25.14 Market Intelligence Score: 90 | |
| Day Percent Change: 4.06% Day Change: 0.98 | |
| Week Change: 9.64% Year-to-date Change: 178.1% | |
| RNA Links: Profile News Message Board | |
| Charts:- Daily , Weekly | |
| Add RNA to Watchlist: View: Get Complete RNA Trend Analysis ➞ | |
 | TYRA Tyra Biosciences, Inc. |
| Sector: Health Care | |
| SubSector: Biotechnology | |
| MarketCap: 732 Millions | |
| Recent Price: 16.36 Market Intelligence Score: 75 | |
| Day Percent Change: 5.52% Day Change: 0.86 | |
| Week Change: 9.18% Year-to-date Change: 22.7% | |
| TYRA Links: Profile News Message Board | |
| Charts:- Daily , Weekly | |
| Add TYRA to Watchlist: View: Get Complete TYRA Trend Analysis ➞ | |
 | RGEN Repligen Corporation |
| Sector: Health Care | |
| SubSector: Biotechnology | |
| MarketCap: 4711.75 Millions | |
| Recent Price: 171.28 Market Intelligence Score: 42 | |
| Day Percent Change: 8.76% Day Change: 13.80 | |
| Week Change: 9% Year-to-date Change: -4.7% | |
| RGEN Links: Profile News Message Board | |
| Charts:- Daily , Weekly | |
| Add RGEN to Watchlist: View: Get Complete RGEN Trend Analysis ➞ | |
 | ATRA Atara Biotherapeutics, Inc. |
| Sector: Health Care | |
| SubSector: Biotechnology | |
| MarketCap: 579.185 Millions | |
| Recent Price: 0.72 Market Intelligence Score: 73 | |
| Day Percent Change: 3.04% Day Change: 0.02 | |
| Week Change: 8.71% Year-to-date Change: 40.1% | |
| ATRA Links: Profile News Message Board | |
| Charts:- Daily , Weekly | |
| Add ATRA to Watchlist: View: Get Complete ATRA Trend Analysis ➞ | |
 | ARWR Arrowhead Pharmaceuticals, Inc. |
| Sector: Health Care | |
| SubSector: Biotechnology | |
| MarketCap: 3226.15 Millions | |
| Recent Price: 24.26 Market Intelligence Score: 49 | |
| Day Percent Change: 1.34% Day Change: 0.32 | |
| Week Change: 8.64% Year-to-date Change: -20.7% | |
| ARWR Links: Profile News Message Board | |
| Charts:- Daily , Weekly | |
| Add ARWR to Watchlist: View: Get Complete ARWR Trend Analysis ➞ | |
 | FULC Fulcrum Therapeutics, Inc. |
| Sector: Health Care | |
| SubSector: Biotechnology | |
| MarketCap: 274.785 Millions | |
| Recent Price: 7.44 Market Intelligence Score: 58 | |
| Day Percent Change: 2.62% Day Change: 0.19 | |
| Week Change: 8.45% Year-to-date Change: 10.2% | |
| FULC Links: Profile News Message Board | |
| Charts:- Daily , Weekly | |
| Add FULC to Watchlist: View: Get Complete FULC Trend Analysis ➞ | |
 | PRLD Prelude Therapeutics Incorporated |
| Sector: Health Care | |
| SubSector: Biotechnology | |
| MarketCap: 26087 Millions | |
| Recent Price: 3.87 Market Intelligence Score: 63 | |
| Day Percent Change: 0.52% Day Change: 0.02 | |
| Week Change: 8.4% Year-to-date Change: -11.0% | |
| PRLD Links: Profile News Message Board | |
| Charts:- Daily , Weekly | |
| Add PRLD to Watchlist: View: Get Complete PRLD Trend Analysis ➞ | |
 | TSHA Taysha Gene Therapies, Inc. |
| Sector: Health Care | |
| SubSector: Biotechnology | |
| MarketCap: 76487 Millions | |
| Recent Price: 2.53 Market Intelligence Score: 63 | |
| Day Percent Change: 2.85% Day Change: 0.07 | |
| Week Change: 8.35% Year-to-date Change: 42.1% | |
| TSHA Links: Profile News Message Board | |
| Charts:- Daily , Weekly | |
| Add TSHA to Watchlist: View: Get Complete TSHA Trend Analysis ➞ | |
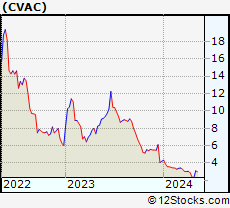 | CVAC CureVac N.V. |
| Sector: Health Care | |
| SubSector: Biotechnology | |
| MarketCap: 22957 Millions | |
| Recent Price: 2.60 Market Intelligence Score: 47 | |
| Day Percent Change: 2.77% Day Change: 0.07 | |
| Week Change: 8.33% Year-to-date Change: -38.3% | |
| CVAC Links: Profile News Message Board | |
| Charts:- Daily , Weekly | |
| Add CVAC to Watchlist: View: Get Complete CVAC Trend Analysis ➞ | |
 | QSI Quantum-Si incorporated |
| Sector: Health Care | |
| SubSector: Biotechnology | |
| MarketCap: 256 Millions | |
| Recent Price: 1.70 Market Intelligence Score: 63 | |
| Day Percent Change: 4.94% Day Change: 0.08 | |
| Week Change: 8.28% Year-to-date Change: -15.4% | |
| QSI Links: Profile News Message Board | |
| Charts:- Daily , Weekly | |
| Add QSI to Watchlist: View: Get Complete QSI Trend Analysis ➞ | |
 | NAMS NewAmsterdam Pharma Company N.V. |
| Sector: Health Care | |
| SubSector: Biotechnology | |
| MarketCap: 979 Millions | |
| Recent Price: 21.50 Market Intelligence Score: 85 | |
| Day Percent Change: 6.28% Day Change: 1.27 | |
| Week Change: 7.88% Year-to-date Change: 91.3% | |
| NAMS Links: Profile News Message Board | |
| Charts:- Daily , Weekly | |
| Add NAMS to Watchlist: View: Get Complete NAMS Trend Analysis ➞ | |
 | ERAS Erasca, Inc. |
| Sector: Health Care | |
| SubSector: Biotechnology | |
| MarketCap: 419 Millions | |
| Recent Price: 1.93 Market Intelligence Score: 68 | |
| Day Percent Change: 4.32% Day Change: 0.08 | |
| Week Change: 7.82% Year-to-date Change: -9.4% | |
| ERAS Links: Profile News Message Board | |
| Charts:- Daily , Weekly | |
| Add ERAS to Watchlist: View: Get Complete ERAS Trend Analysis ➞ | |
 | AGIO Agios Pharmaceuticals, Inc. |
| Sector: Health Care | |
| SubSector: Biotechnology | |
| MarketCap: 2613.35 Millions | |
| Recent Price: 31.81 Market Intelligence Score: 100 | |
| Day Percent Change: 5.30% Day Change: 1.60 | |
| Week Change: 7.72% Year-to-date Change: 42.8% | |
| AGIO Links: Profile News Message Board | |
| Charts:- Daily , Weekly | |
| Add AGIO to Watchlist: View: Get Complete AGIO Trend Analysis ➞ | |
 | NUVL Nuvalent, Inc. |
| Sector: Health Care | |
| SubSector: Biotechnology | |
| MarketCap: 2400 Millions | |
| Recent Price: 67.56 Market Intelligence Score: 49 | |
| Day Percent Change: 4.76% Day Change: 3.07 | |
| Week Change: 7.65% Year-to-date Change: -8.1% | |
| NUVL Links: Profile News Message Board | |
| Charts:- Daily , Weekly | |
| Add NUVL to Watchlist: View: Get Complete NUVL Trend Analysis ➞ | |
 | AXSM Axsome Therapeutics, Inc. |
| Sector: Health Care | |
| SubSector: Biotechnology | |
| MarketCap: 2284.25 Millions | |
| Recent Price: 73.08 Market Intelligence Score: 64 | |
| Day Percent Change: 2.70% Day Change: 1.92 | |
| Week Change: 7.63% Year-to-date Change: -8.2% | |
| AXSM Links: Profile News Message Board | |
| Charts:- Daily , Weekly | |
| Add AXSM to Watchlist: View: Get Complete AXSM Trend Analysis ➞ | |
 | ADPT Adaptive Biotechnologies Corporation |
| Sector: Health Care | |
| SubSector: Biotechnology | |
| MarketCap: 3525.75 Millions | |
| Recent Price: 2.58 Market Intelligence Score: 47 | |
| Day Percent Change: 2.38% Day Change: 0.06 | |
| Week Change: 7.5% Year-to-date Change: -47.4% | |
| ADPT Links: Profile News Message Board | |
| Charts:- Daily , Weekly | |
| Add ADPT to Watchlist: View: Get Complete ADPT Trend Analysis ➞ | |
 | ARCT Arcturus Therapeutics Holdings Inc. |
| Sector: Health Care | |
| SubSector: Biotechnology | |
| MarketCap: 241.385 Millions | |
| Recent Price: 27.93 Market Intelligence Score: 32 | |
| Day Percent Change: 3.22% Day Change: 0.87 | |
| Week Change: 7.44% Year-to-date Change: -11.4% | |
| ARCT Links: Profile News Message Board | |
| Charts:- Daily , Weekly | |
| Add ARCT to Watchlist: View: Get Complete ARCT Trend Analysis ➞ | |
 | ZLAB Zai Lab Limited |
| Sector: Health Care | |
| SubSector: Biotechnology | |
| MarketCap: 3970.35 Millions | |
| Recent Price: 15.12 Market Intelligence Score: 49 | |
| Day Percent Change: 0.87% Day Change: 0.13 | |
| Week Change: 7.39% Year-to-date Change: -44.7% | |
| ZLAB Links: Profile News Message Board | |
| Charts:- Daily , Weekly | |
| Add ZLAB to Watchlist: View: Get Complete ZLAB Trend Analysis ➞ | |
 | BGNE BeiGene, Ltd. |
| Sector: Health Care | |
| SubSector: Biotechnology | |
| MarketCap: 10838.5 Millions | |
| Recent Price: 138.99 Market Intelligence Score: 42 | |
| Day Percent Change: 6.15% Day Change: 8.05 | |
| Week Change: 7.31% Year-to-date Change: -22.9% | |
| BGNE Links: Profile News Message Board | |
| Charts:- Daily , Weekly | |
| Add BGNE to Watchlist: View: Get Complete BGNE Trend Analysis ➞ | |
 | ITOS iTeos Therapeutics, Inc. |
| Sector: Health Care | |
| SubSector: Biotechnology | |
| MarketCap: 10487 Millions | |
| Recent Price: 10.99 Market Intelligence Score: 61 | |
| Day Percent Change: 1.85% Day Change: 0.20 | |
| Week Change: 7.27% Year-to-date Change: 0.5% | |
| ITOS Links: Profile News Message Board | |
| Charts:- Daily , Weekly | |
| Add ITOS to Watchlist: View: Get Complete ITOS Trend Analysis ➞ | |
 | BTAI BioXcel Therapeutics, Inc. |
| Sector: Health Care | |
| SubSector: Biotechnology | |
| MarketCap: 487.485 Millions | |
| Recent Price: 2.97 Market Intelligence Score: 69 | |
| Day Percent Change: 4.21% Day Change: 0.12 | |
| Week Change: 7.22% Year-to-date Change: 0.7% | |
| BTAI Links: Profile News Message Board | |
| Charts:- Daily , Weekly | |
| Add BTAI to Watchlist: View: Get Complete BTAI Trend Analysis ➞ | |
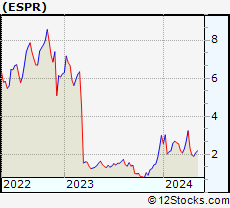 | ESPR Esperion Therapeutics, Inc. |
| Sector: Health Care | |
| SubSector: Biotechnology | |
| MarketCap: 1153.55 Millions | |
| Recent Price: 2.09 Market Intelligence Score: 37 | |
| Day Percent Change: 9.42% Day Change: 0.18 | |
| Week Change: 7.18% Year-to-date Change: -30.1% | |
| ESPR Links: Profile News Message Board | |
| Charts:- Daily , Weekly | |
| Add ESPR to Watchlist: View: Get Complete ESPR Trend Analysis ➞ | |
 | INO Inovio Pharmaceuticals, Inc. |
| Sector: Health Care | |
| SubSector: Biotechnology | |
| MarketCap: 876.385 Millions | |
| Recent Price: 10.37 Market Intelligence Score: 68 | |
| Day Percent Change: 3.49% Day Change: 0.35 | |
| Week Change: 7.13% Year-to-date Change: 1,933.3% | |
| INO Links: Profile News Message Board | |
| Charts:- Daily , Weekly | |
| Add INO to Watchlist: View: Get Complete INO Trend Analysis ➞ | |
| To view more stocks, click on Next / Previous arrows or select different range: 0 - 25 , 25 - 50 , 50 - 75 , 75 - 100 , 100 - 125 , 125 - 150 , 150 - 175 , 175 - 200 , 200 - 225 , 225 - 250 , 250 - 275 , 275 - 300 , 300 - 325 , 325 - 350 , 350 - 375 , 375 - 400 | ||
| Click To Change The Sort Order: By Market Cap or Company Size Performance: Year-to-date, Week and Day | |
| Select Chart Type: | ||
|
Best Stocks Today 12Stocks.com |
© 2024 12Stocks.com Terms & Conditions Privacy Contact Us
All Information Provided Only For Education And Not To Be Used For Investing or Trading. See Terms & Conditions


One More Thing ... Get Best Stocks Delivered Daily!
Never Ever Miss A Move With Our Top Ten Stocks Lists
Find Best Stocks In Any Market - Bull or Bear Market
Take A Peek At Our Top Ten Stocks Lists: Daily, Weekly, Year-to-Date & Top Trends
Find Best Stocks In Any Market - Bull or Bear Market
Take A Peek At Our Top Ten Stocks Lists: Daily, Weekly, Year-to-Date & Top Trends
Biotech Stocks With Best Up Trends [0-bearish to 100-bullish]: Pieris [100], PureTech Health[100], Day One[100], Agios [100], Avadel [100], PMV [100], Annovis Bio[100], BioMarin [100], Mesoblast [95], Nektar [95], Moderna [95]
Best Biotech Stocks Year-to-Date:
Pieris [6493.41%], Precision [2702.74%], Inovio [1933.33%], Assembly [1518.1%], Adverum nologies[1361.21%], NuCana [1252.27%], Affimed N.V[756%], Agenus [680.29%], Corbus [524.83%], Mesoblast [445.45%], Janux [364.03%] Best Biotech Stocks This Week:
Pieris [8175.86%], Seres [35.74%], BeyondSpring [27.22%], ProKidney [24.75%], Agenus [21.66%], Annovis Bio[18.8%], Generation Bio[17.69%], Molecular Partners[16.87%], Adaptimmune [16.72%], Longboard [16.23%], Mesoblast [15.16%] Best Biotech Stocks Daily:
Pieris [8113.55%], Seres [21.68%], Generation Bio[16.01%], ChromaDex [14.86%], IGM [14.07%], Adaptimmune [12.87%], Agenus [11.96%], Galectin [10.64%], PureTech Health[10.55%], Personalis [9.52%], Esperion [9.42%]