
 Login Sign Up


| |||||
 |  | ||||

| 12Stocks.com Market Intelligence |
Best Biotech Stocks
|
|
| Quick Read: Best Biotech Stocks List By Performances & Trends: Daily, Weekly, Year-to-Date, Market Cap (Size) & Technical Trends | |||
| Best Biotech Stocks Views: Quick Browse View, Summary & Slide Show View | |||
| 12Stocks.com Biotech Stocks Performances & Trends Daily | |||||||||
|
|  The overall market intelligence score is 25 (0-bearish to 100-bullish) which puts Biotech sector in short term bearish to neutral trend. The market intelligence score from previous trading session is 32 and a deterioration of trend continues.
| ||||||||
Here are the market intelligence trend scores of the most requested Biotech stocks at 12Stocks.com (click stock name for detailed review):
|


| 12Stocks.com: Investing in Biotech sector with Stocks | |
|
The following table helps investors and traders sort through current performance and trends (as measured by market intelligence score) of various
stocks in the Biotech sector. Quick View: Move mouse or cursor over stock symbol (ticker) to view short-term Technical chart and over stock name to view long term chart. Click on  to add stock symbol to your watchlist and to add stock symbol to your watchlist and  to view watchlist. Click on any ticker or stock name for detailed market intelligence report for that stock. to view watchlist. Click on any ticker or stock name for detailed market intelligence report for that stock. |
12Stocks.com Performance of Stocks in Biotech Sector
| Ticker | Stock Name | Watchlist | Category | Recent Price | Market Intelligence Score | Change % | YTD Change% |
| YMAB | Y-mAbs |   | Biotechnology | 14.86 | 58 | -2.81% | 117.89% |
| GALT | Galectin | | Biotechnology | 3.50 | 46 | 6.38% | 110.84% |
| SANA | Sana nology | | Biotechnology | 8.50 | 63 | 4.68% | 105.56% |
| XBIT | X | | Biotechnology | 8.21 | 69 | 1.73% | 105.25% |
| RANI | Rani | | Biotechnology | 6.58 | 61 | -4.22% | 99.39% |
| OCEA | Ocean Biomedical | | Biotechnology | 1.32 | 46 | -6.71% | 98.41% |
| BCLI | Brainstorm Cell | | Biotechnology | 0.53 | 54 | -2.39% | 94.87% |
| GHRS | GH Research | | Biotechnology | 10.50 | 44 | -4.37% | 91.61% |
| NAMS | NewAmsterdam Pharma | | Biotechnology | 21.44 | 93 | -3.34% | 90.75% |
| CGEM | Cullinan Oncology | | Biotechnology | 19.25 | 93 | 1.85% | 88.82% |
| MNPR | Monopar | | Biotechnology | 0.63 | 83 | 0.16% | 83.43% |
| MOR | MorphoSys AG | | Biotechnology | 18.13 | 63 | 0.42% | 83.08% |
| BDTX | Black Diamond | | Biotechnology | 5.11 | 41 | 0.99% | 81.85% |
| DYN | Dyne | | Biotechnology | 23.70 | 20 | -5.14% | 78.16% |
| GBIO | Generation Bio | | Biotechnology | 2.92 | 61 | -2.34% | 77.27% |
| NUVB | Nuvation Bio | | Biotechnology | 2.62 | 61 | -1.13% | 72.94% |
| ACRV | Acrivon | | Biotechnology | 8.47 | 78 | -10.47% | 70.42% |
| GERN | Geron | | Biotechnology | 3.56 | 61 | -0.56% | 68.72% |
| VTYX | Ventyx | | Biotechnology | 4.06 | 46 | -6.88% | 64.04% |
| MRUS | Merus N.V | | Biotechnology | 44.93 | 65 | 7.05% | 63.38% |
| PEPG | PepGen | | Biotechnology | 11.03 | 61 | -5.73% | 61.26% |
| TARS | Tarsus | | Biotechnology | 32.17 | 49 | -1.83% | 58.63% |
| PROK | ProKidney | | Biotechnology | 2.71 | 68 | 7.75% | 55.30% |
| SIGA | SIGA Technologies | | Biotechnology | 8.64 | 61 | -0.23% | 54.29% |
| TARA | ArTara | | Biotechnology | 2.89 | 58 | 2.48% | 54.13% |
| To view more stocks, click on Next / Previous arrows or select different range: 0 - 25 , 25 - 50 , 50 - 75 , 75 - 100 , 100 - 125 , 125 - 150 , 150 - 175 , 175 - 200 , 200 - 225 , 225 - 250 , 250 - 275 , 275 - 300 , 300 - 325 , 325 - 350 , 350 - 375 , 375 - 400 | ||
 | Click To Change The Sort Order: By Market Cap or Company Size Performance: Year-to-date, Week and Day |  |
|
Get the most comprehensive stock market coverage daily at 12Stocks.com ➞ Best Stocks Today ➞ Best Stocks Weekly ➞ Best Stocks Year-to-Date ➞ Best Stocks Trends ➞  Best Stocks Today 12Stocks.com Best Nasdaq Stocks ➞ Best S&P 500 Stocks ➞ Best Tech Stocks ➞ Best Biotech Stocks ➞ |
| Detailed Overview of Biotech Stocks |
| Biotech Technical Overview, Leaders & Laggards, Top Biotech ETF Funds & Detailed Biotech Stocks List, Charts, Trends & More |
| Biotech Sector: Technical Analysis, Trends & YTD Performance | |
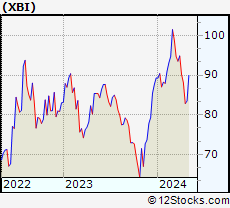
| Biotech sector, as represented by XBI, an exchange-traded fund [ETF] that holds basket of Biotech stocks (e.g, Amgen, Celgene) is down by -7.92% and is currently underperforming the overall market by -13.08% year-to-date. Below is a quick view of Technical charts and trends: | |
 XBI Weekly Chart |
|
| Long Term Trend: Not Good | |
| Medium Term Trend: Not Good | |
 XBI Daily Chart |
|
| Short Term Trend: Very Good | |
| Overall Trend Score: 25 | |
| YTD Performance: -7.92% | |
| **Trend Scores & Views Are Only For Educational Purposes And Not For Investing | |
| 12Stocks.com: Top Performing Biotech Sector Stocks | ||||||||||||||||||||||||||||||||||||||||||||||||
 The top performing Biotech sector stocks year to date are
Now, more recently, over last week, the top performing Biotech sector stocks on the move are


|
||||||||||||||||||||||||||||||||||||||||||||||||
| 12Stocks.com: Investing in Biotech Sector using Exchange Traded Funds | |
|
The following table shows list of key exchange traded funds (ETF) that
help investors track Biotech Index. For detailed view, check out our ETF Funds section of our website. Quick View: Move mouse or cursor over ETF symbol (ticker) to view short-term Technical chart and over ETF name to view long term chart. Click on ticker or stock name for detailed view. Click on to add stock symbol to your watchlist and to view watchlist. |
12Stocks.com List of ETFs that track Biotech Index
| Ticker | ETF Name | Watchlist | Recent Price | Market Intelligence Score | Change % | Week % | Year-to-date % |
| LABD | Biotech Bear 3X | | 11.03 | 75 | 6.36 | 2.13 | 13.83% |
| XBI | Biotech | | 82.22 | 25 | -2.05 | -0.74 | -7.92% |
| LABU | Biotech Bull 3X | | 83.72 | 25 | -6.35 | -2.71 | -31.36% |
| IBB | Biotechnology | | 125.67 | 18 | -1.64 | 0.76 | -7.49% |
| IYH | Healthcare | | 58.68 | 45 | -0.69 | 0.89 | 2.5% |
| IHF | Healthcare Providers | | 52.11 | 55 | -0.29 | -0.19 | -0.76% |
| IXJ | Global Healthcare | | 88.91 | 25 | -0.45 | 1.32 | 2.53% |
| BBH | Biotech | | 154.61 | 49 | -1.73 | 1.48 | -6.47% |
| FBT | First NYSE | | 142.59 | 25 | -1.93 | 0.64 | -9.78% |
| CURE | Healthcare Bull 3X | | 105.32 | 25 | -2.35 | 1.92 | 3.52% |
| BIB | Biotechnology | | 48.83 | 32 | -2.69 | 1.31 | -14.41% |
| BIS | Short Biotech | | 20.59 | 61 | 2.49 | -1.46 | 13.95% |
| PTH | DWA Healthcare Momentum | | 39.60 | 46 | -0.08 | 0.18 | 1.18% |
| PBE | Biotech & Genome | | 59.85 | 32 | -1.69 | 0 | -9.1% |
| BBC | Bio Biotechnology Clinical | | 24.70 | 36 | -3.62 | -0.04 | 1.01% |
| BTEC | Principal Healthcare Innovators | | 34.21 | 32 | 0.02 | 1.04 | -5.83% |
| BBP | Bio Biotechnology Products | | 51.14 | 35 | -2.40 | 1.41 | -11.96% |
| 12Stocks.com: Charts, Trends, Fundamental Data and Performances of Biotech Stocks | |
|
We now take in-depth look at all Biotech stocks including charts, multi-period performances and overall trends (as measured by market intelligence score). One can sort Biotech stocks (click link to choose) by Daily, Weekly and by Year-to-Date performances. Also, one can sort by size of the company or by market capitalization. |
| Select Your Default Chart Type: | |||||
| |||||
| Click on stock symbol or name for detailed view. Click on to add stock symbol to your watchlist and to view watchlist. Quick View: Move mouse or cursor over "Daily" to quickly view daily Technical stock chart and over "Weekly" to view weekly Technical stock chart. | |||||

 | YMAB Y-mAbs Therapeutics, Inc. |
| Sector: Health Care | |
| SubSector: Biotechnology | |
| MarketCap: 899.585 Millions | |
| Recent Price: 14.86 Market Intelligence Score: 58 | |
| Day Percent Change: -2.81% Day Change: -0.43 | |
| Week Change: -1.91% Year-to-date Change: 117.9% | |
| YMAB Links: Profile News Message Board | |
| Charts:- Daily , Weekly | |
| Add YMAB to Watchlist: View: Get Complete YMAB Trend Analysis ➞ | |
 | GALT Galectin Therapeutics, Inc. |
| Sector: Health Care | |
| SubSector: Biotechnology | |
| MarketCap: 114.185 Millions | |
| Recent Price: 3.50 Market Intelligence Score: 46 | |
| Day Percent Change: 6.38% Day Change: 0.21 | |
| Week Change: 3.86% Year-to-date Change: 110.8% | |
| GALT Links: Profile News Message Board | |
| Charts:- Daily , Weekly | |
| Add GALT to Watchlist: View: Get Complete GALT Trend Analysis ➞ | |
 | SANA Sana Biotechnology, Inc. |
| Sector: Health Care | |
| SubSector: Biotechnology | |
| MarketCap: 1210 Millions | |
| Recent Price: 8.50 Market Intelligence Score: 63 | |
| Day Percent Change: 4.68% Day Change: 0.38 | |
| Week Change: 11.7% Year-to-date Change: 105.6% | |
| SANA Links: Profile News Message Board | |
| Charts:- Daily , Weekly | |
| Add SANA to Watchlist: View: Get Complete SANA Trend Analysis ➞ | |
 | XBIT XBiotech Inc. |
| Sector: Health Care | |
| SubSector: Biotechnology | |
| MarketCap: 420.385 Millions | |
| Recent Price: 8.21 Market Intelligence Score: 69 | |
| Day Percent Change: 1.73% Day Change: 0.14 | |
| Week Change: 2.11% Year-to-date Change: 105.3% | |
| XBIT Links: Profile News Message Board | |
| Charts:- Daily , Weekly | |
| Add XBIT to Watchlist: View: Get Complete XBIT Trend Analysis ➞ | |
 | RANI Rani Therapeutics Holdings, Inc. |
| Sector: Health Care | |
| SubSector: Biotechnology | |
| MarketCap: 202 Millions | |
| Recent Price: 6.58 Market Intelligence Score: 61 | |
| Day Percent Change: -4.22% Day Change: -0.29 | |
| Week Change: -6.93% Year-to-date Change: 99.4% | |
| RANI Links: Profile News Message Board | |
| Charts:- Daily , Weekly | |
| Add RANI to Watchlist: View: Get Complete RANI Trend Analysis ➞ | |
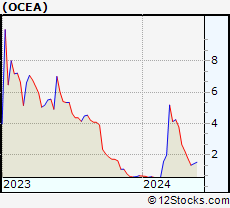 | OCEA Ocean Biomedical, Inc. |
| Sector: Health Care | |
| SubSector: Biotechnology | |
| MarketCap: 203 Millions | |
| Recent Price: 1.32 Market Intelligence Score: 46 | |
| Day Percent Change: -6.71% Day Change: -0.09 | |
| Week Change: -25% Year-to-date Change: 98.4% | |
| OCEA Links: Profile News Message Board | |
| Charts:- Daily , Weekly | |
| Add OCEA to Watchlist: View: Get Complete OCEA Trend Analysis ➞ | |
 | BCLI Brainstorm Cell Therapeutics Inc. |
| Sector: Health Care | |
| SubSector: Biotechnology | |
| MarketCap: 141.285 Millions | |
| Recent Price: 0.53 Market Intelligence Score: 54 | |
| Day Percent Change: -2.39% Day Change: -0.01 | |
| Week Change: 0% Year-to-date Change: 94.9% | |
| BCLI Links: Profile News Message Board | |
| Charts:- Daily , Weekly | |
| Add BCLI to Watchlist: View: Get Complete BCLI Trend Analysis ➞ | |
 | GHRS GH Research PLC |
| Sector: Health Care | |
| SubSector: Biotechnology | |
| MarketCap: 614 Millions | |
| Recent Price: 10.50 Market Intelligence Score: 44 | |
| Day Percent Change: -4.37% Day Change: -0.48 | |
| Week Change: -4.81% Year-to-date Change: 91.6% | |
| GHRS Links: Profile News Message Board | |
| Charts:- Daily , Weekly | |
| Add GHRS to Watchlist: View: Get Complete GHRS Trend Analysis ➞ | |
 | NAMS NewAmsterdam Pharma Company N.V. |
| Sector: Health Care | |
| SubSector: Biotechnology | |
| MarketCap: 979 Millions | |
| Recent Price: 21.44 Market Intelligence Score: 93 | |
| Day Percent Change: -3.34% Day Change: -0.74 | |
| Week Change: 7.58% Year-to-date Change: 90.8% | |
| NAMS Links: Profile News Message Board | |
| Charts:- Daily , Weekly | |
| Add NAMS to Watchlist: View: Get Complete NAMS Trend Analysis ➞ | |
 | CGEM Cullinan Oncology, Inc. |
| Sector: Health Care | |
| SubSector: Biotechnology | |
| MarketCap: 433 Millions | |
| Recent Price: 19.25 Market Intelligence Score: 93 | |
| Day Percent Change: 1.85% Day Change: 0.35 | |
| Week Change: 22.92% Year-to-date Change: 88.8% | |
| CGEM Links: Profile News Message Board | |
| Charts:- Daily , Weekly | |
| Add CGEM to Watchlist: View: Get Complete CGEM Trend Analysis ➞ | |
 | MNPR Monopar Therapeutics Inc. |
| Sector: Health Care | |
| SubSector: Biotechnology | |
| MarketCap: 71487 Millions | |
| Recent Price: 0.63 Market Intelligence Score: 83 | |
| Day Percent Change: 0.16% Day Change: 0.00 | |
| Week Change: -0.79% Year-to-date Change: 83.4% | |
| MNPR Links: Profile News Message Board | |
| Charts:- Daily , Weekly | |
| Add MNPR to Watchlist: View: Get Complete MNPR Trend Analysis ➞ | |
 | MOR MorphoSys AG |
| Sector: Health Care | |
| SubSector: Biotechnology | |
| MarketCap: 2636.85 Millions | |
| Recent Price: 18.13 Market Intelligence Score: 63 | |
| Day Percent Change: 0.42% Day Change: 0.07 | |
| Week Change: 0.92% Year-to-date Change: 83.1% | |
| MOR Links: Profile News Message Board | |
| Charts:- Daily , Weekly | |
| Add MOR to Watchlist: View: Get Complete MOR Trend Analysis ➞ | |
 | BDTX Black Diamond Therapeutics, Inc. |
| Sector: Health Care | |
| SubSector: Biotechnology | |
| MarketCap: 12587 Millions | |
| Recent Price: 5.11 Market Intelligence Score: 41 | |
| Day Percent Change: 0.99% Day Change: 0.05 | |
| Week Change: -2.85% Year-to-date Change: 81.9% | |
| BDTX Links: Profile News Message Board | |
| Charts:- Daily , Weekly | |
| Add BDTX to Watchlist: View: Get Complete BDTX Trend Analysis ➞ | |
 | DYN Dyne Therapeutics, Inc. |
| Sector: Health Care | |
| SubSector: Biotechnology | |
| MarketCap: 88487 Millions | |
| Recent Price: 23.70 Market Intelligence Score: 20 | |
| Day Percent Change: -5.14% Day Change: -1.29 | |
| Week Change: -0.69% Year-to-date Change: 78.2% | |
| DYN Links: Profile News Message Board | |
| Charts:- Daily , Weekly | |
| Add DYN to Watchlist: View: Get Complete DYN Trend Analysis ➞ | |
 | GBIO Generation Bio Co. |
| Sector: Health Care | |
| SubSector: Biotechnology | |
| MarketCap: 17487 Millions | |
| Recent Price: 2.92 Market Intelligence Score: 61 | |
| Day Percent Change: -2.34% Day Change: -0.07 | |
| Week Change: 5.6% Year-to-date Change: 77.3% | |
| GBIO Links: Profile News Message Board | |
| Charts:- Daily , Weekly | |
| Add GBIO to Watchlist: View: Get Complete GBIO Trend Analysis ➞ | |
 | NUVB Nuvation Bio Inc. |
| Sector: Health Care | |
| SubSector: Biotechnology | |
| MarketCap: 381 Millions | |
| Recent Price: 2.62 Market Intelligence Score: 61 | |
| Day Percent Change: -1.13% Day Change: -0.03 | |
| Week Change: 0.77% Year-to-date Change: 72.9% | |
| NUVB Links: Profile News Message Board | |
| Charts:- Daily , Weekly | |
| Add NUVB to Watchlist: View: Get Complete NUVB Trend Analysis ➞ | |
 | ACRV Acrivon Therapeutics, Inc. |
| Sector: Health Care | |
| SubSector: Biotechnology | |
| MarketCap: 286 Millions | |
| Recent Price: 8.47 Market Intelligence Score: 78 | |
| Day Percent Change: -10.47% Day Change: -0.99 | |
| Week Change: -9.8% Year-to-date Change: 70.4% | |
| ACRV Links: Profile News Message Board | |
| Charts:- Daily , Weekly | |
| Add ACRV to Watchlist: View: Get Complete ACRV Trend Analysis ➞ | |
 | GERN Geron Corporation |
| Sector: Health Care | |
| SubSector: Biotechnology | |
| MarketCap: 228.685 Millions | |
| Recent Price: 3.56 Market Intelligence Score: 61 | |
| Day Percent Change: -0.56% Day Change: -0.02 | |
| Week Change: -3.52% Year-to-date Change: 68.7% | |
| GERN Links: Profile News Message Board | |
| Charts:- Daily , Weekly | |
| Add GERN to Watchlist: View: Get Complete GERN Trend Analysis ➞ | |
 | VTYX Ventyx Biosciences, Inc. |
| Sector: Health Care | |
| SubSector: Biotechnology | |
| MarketCap: 1950 Millions | |
| Recent Price: 4.06 Market Intelligence Score: 46 | |
| Day Percent Change: -6.88% Day Change: -0.30 | |
| Week Change: -9.17% Year-to-date Change: 64.0% | |
| VTYX Links: Profile News Message Board | |
| Charts:- Daily , Weekly | |
| Add VTYX to Watchlist: View: Get Complete VTYX Trend Analysis ➞ | |
 | MRUS Merus N.V. |
| Sector: Health Care | |
| SubSector: Biotechnology | |
| MarketCap: 417.385 Millions | |
| Recent Price: 44.93 Market Intelligence Score: 65 | |
| Day Percent Change: 7.05% Day Change: 2.96 | |
| Week Change: 12.86% Year-to-date Change: 63.4% | |
| MRUS Links: Profile News Message Board | |
| Charts:- Daily , Weekly | |
| Add MRUS to Watchlist: View: Get Complete MRUS Trend Analysis ➞ | |
 | PEPG PepGen Inc. |
| Sector: Health Care | |
| SubSector: Biotechnology | |
| MarketCap: 216 Millions | |
| Recent Price: 11.03 Market Intelligence Score: 61 | |
| Day Percent Change: -5.73% Day Change: -0.67 | |
| Week Change: 4.7% Year-to-date Change: 61.3% | |
| PEPG Links: Profile News Message Board | |
| Charts:- Daily , Weekly | |
| Add PEPG to Watchlist: View: Get Complete PEPG Trend Analysis ➞ | |
 | TARS Tarsus Pharmaceuticals, Inc. |
| Sector: Health Care | |
| SubSector: Biotechnology | |
| MarketCap: 74487 Millions | |
| Recent Price: 32.17 Market Intelligence Score: 49 | |
| Day Percent Change: -1.83% Day Change: -0.60 | |
| Week Change: -2.19% Year-to-date Change: 58.6% | |
| TARS Links: Profile News Message Board | |
| Charts:- Daily , Weekly | |
| Add TARS to Watchlist: View: Get Complete TARS Trend Analysis ➞ | |
 | PROK ProKidney Corp. |
| Sector: Health Care | |
| SubSector: Biotechnology | |
| MarketCap: 2470 Millions | |
| Recent Price: 2.71 Market Intelligence Score: 68 | |
| Day Percent Change: 7.75% Day Change: 0.19 | |
| Week Change: 32.84% Year-to-date Change: 55.3% | |
| PROK Links: Profile News Message Board | |
| Charts:- Daily , Weekly | |
| Add PROK to Watchlist: View: Get Complete PROK Trend Analysis ➞ | |
 | SIGA SIGA Technologies, Inc. |
| Sector: Health Care | |
| SubSector: Biotechnology | |
| MarketCap: 424.285 Millions | |
| Recent Price: 8.64 Market Intelligence Score: 61 | |
| Day Percent Change: -0.23% Day Change: -0.02 | |
| Week Change: 3.6% Year-to-date Change: 54.3% | |
| SIGA Links: Profile News Message Board | |
| Charts:- Daily , Weekly | |
| Add SIGA to Watchlist: View: Get Complete SIGA Trend Analysis ➞ | |
 | TARA ArTara Therapeutics, Inc. |
| Sector: Health Care | |
| SubSector: Biotechnology | |
| MarketCap: 140.685 Millions | |
| Recent Price: 2.89 Market Intelligence Score: 58 | |
| Day Percent Change: 2.48% Day Change: 0.07 | |
| Week Change: 10.31% Year-to-date Change: 54.1% | |
| TARA Links: Profile News Message Board | |
| Charts:- Daily , Weekly | |
| Add TARA to Watchlist: View: Get Complete TARA Trend Analysis ➞ | |
| To view more stocks, click on Next / Previous arrows or select different range: 0 - 25 , 25 - 50 , 50 - 75 , 75 - 100 , 100 - 125 , 125 - 150 , 150 - 175 , 175 - 200 , 200 - 225 , 225 - 250 , 250 - 275 , 275 - 300 , 300 - 325 , 325 - 350 , 350 - 375 , 375 - 400 | ||
| Click To Change The Sort Order: By Market Cap or Company Size Performance: Year-to-date, Week and Day | |
| Select Chart Type: | ||
|
Best Stocks Today 12Stocks.com |
© 2024 12Stocks.com Terms & Conditions Privacy Contact Us
All Information Provided Only For Education And Not To Be Used For Investing or Trading. See Terms & Conditions


One More Thing ... Get Best Stocks Delivered Daily!
Never Ever Miss A Move With Our Top Ten Stocks Lists
Find Best Stocks In Any Market - Bull or Bear Market
Take A Peek At Our Top Ten Stocks Lists: Daily, Weekly, Year-to-Date & Top Trends
Find Best Stocks In Any Market - Bull or Bear Market
Take A Peek At Our Top Ten Stocks Lists: Daily, Weekly, Year-to-Date & Top Trends
Biotech Stocks With Best Up Trends [0-bearish to 100-bullish]: Annovis Bio[100], Agios [100], Agenus [95], Mesoblast [95], Cullinan Oncology[93], Avadel [93], Pieris [93], NewAmsterdam Pharma[93], PureTech Health[93], Exelixis [90], ALX Oncology[88]
Best Biotech Stocks Year-to-Date:
Pieris [6273.63%], Precision [2590.41%], Inovio [1885.29%], Assembly [1529.07%], NuCana [1198.17%], Adverum nologies[1147.34%], Agenus [902.54%], Affimed N.V[680.8%], Mesoblast [459.09%], Corbus [454.64%], Janux [338.34%] Best Biotech Stocks This Week:
Pieris [7900%], Agenus [56.31%], ProKidney [32.84%], Seres [32.65%], Annovis Bio[30%], BeyondSpring [26.11%], Cullinan Oncology[22.92%], Pharvaris N.V[18.84%], Mesoblast [18.04%], BeiGene [14.7%], Avid Bioservices[14.2%] Best Biotech Stocks Daily:
Galera [13.74%], Agenus [11.86%], ADiTx [10.57%], Apollomics [9.94%], Pharming [9.06%], Structure [8.13%], Pharvaris N.V[7.91%], ProKidney [7.75%], Avid Bioservices[7.17%], Merus N.V[7.05%], Zura Bio[6.75%]