
 Login Sign Up


| |||||
 |  | ||||

| 12Stocks.com Market Intelligence |
Best Biotech Stocks
|
|
| Quick Read: Best Biotech Stocks List By Performances & Trends: Daily, Weekly, Year-to-Date, Market Cap (Size) & Technical Trends | |||
| Best Biotech Stocks Views: Quick Browse View, Summary & Slide Show View | |||
| 12Stocks.com Biotech Stocks Performances & Trends Daily | |||||||||
|
|  The overall market intelligence score is 10 (0-bearish to 100-bullish) which puts Biotech sector in short term bearish trend. The market intelligence score from previous trading session is 0 and hence an improvement of trend.
| ||||||||
Here are the market intelligence trend scores of the most requested Biotech stocks at 12Stocks.com (click stock name for detailed review):
|


| 12Stocks.com: Investing in Biotech sector with Stocks | |
|
The following table helps investors and traders sort through current performance and trends (as measured by market intelligence score) of various
stocks in the Biotech sector. Quick View: Move mouse or cursor over stock symbol (ticker) to view short-term Technical chart and over stock name to view long term chart. Click on  to add stock symbol to your watchlist and to add stock symbol to your watchlist and  to view watchlist. Click on any ticker or stock name for detailed market intelligence report for that stock. to view watchlist. Click on any ticker or stock name for detailed market intelligence report for that stock. |
12Stocks.com Performance of Stocks in Biotech Sector
| Ticker | Stock Name | Watchlist | Category | Recent Price | Market Intelligence Score | Change % | YTD Change% |
| KNSA | Kiniksa |   | Biotechnology | 16.88 | 10 | -0.41% | -3.76% |
| MDGL | Madrigal | | Biotechnology | 222.26 | 46 | -2.66% | -3.94% |
| MORF | Morphic Holding | | Biotechnology | 27.51 | 10 | -1.29% | -4.74% |
| URGN | UroGen Pharma | | Biotechnology | 14.26 | 12 | 0.14% | -4.93% |
| WVE | Wave Life | | Biotechnology | 4.80 | 26 | 0.21% | -4.95% |
| CGEN | Compugen | | Biotechnology | 1.88 | 10 | -1.05% | -5.05% |
| AVTE | Aerovate | | Biotechnology | 21.43 | 36 | -4.03% | -5.05% |
| SNDX | Syndax | | Biotechnology | 20.49 | 46 | -1.21% | -5.18% |
| IMAB | I Mab | | Biotechnology | 1.80 | 48 | -0.55% | -5.26% |
| ITOS | iTeos | | Biotechnology | 10.34 | 36 | -3.23% | -5.53% |
| HOOK | HOOKIPA Pharma | | Biotechnology | 0.76 | 41 | 0.31% | -5.57% |
| VRCA | Verrica | | Biotechnology | 6.91 | 66 | -2.12% | -5.60% |
| ARGX | argenx SE | | Biotechnology | 358.41 | 10 | -2.13% | -5.79% |
| ROIV | Roivant | | Biotechnology | 10.45 | 26 | 0.00% | -5.90% |
| PRQR | ProQR | | Biotechnology | 1.86 | 10 | -2.11% | -6.06% |
| KALV | KalVista | | Biotechnology | 11.50 | 25 | -1.29% | -6.12% |
| EXEL | Exelixis | | Biotechnology | 22.49 | 51 | -1.66% | -6.25% |
| RFL | Rafael | | Biotechnology | 1.71 | 37 | -3.93% | -6.56% |
| BMRN | BioMarin | | Biotechnology | 90.07 | 68 | -0.44% | -6.59% |
| MNOV | MediciNova | | Biotechnology | 1.40 | 54 | -2.10% | -6.67% |
| GNFT | Genfit SA | | Biotechnology | 3.59 | 10 | -1.10% | -6.75% |
| CARA | Cara | | Biotechnology | 0.69 | 46 | -5.72% | -7.13% |
| ANAB | AnaptysBio | | Biotechnology | 19.83 | 5 | -7.64% | -7.42% |
| CERT | Certara | | Biotechnology | 16.19 | 36 | -4.51% | -8.01% |
| CDXS | Codexis | | Biotechnology | 2.80 | 63 | 1.45% | -8.20% |
| To view more stocks, click on Next / Previous arrows or select different range: 0 - 25 , 25 - 50 , 50 - 75 , 75 - 100 , 100 - 125 , 125 - 150 , 150 - 175 , 175 - 200 , 200 - 225 , 225 - 250 , 250 - 275 , 275 - 300 , 300 - 325 , 325 - 350 , 350 - 375 , 375 - 400 | ||
 | Click To Change The Sort Order: By Market Cap or Company Size Performance: Year-to-date, Week and Day |  |
|
Get the most comprehensive stock market coverage daily at 12Stocks.com ➞ Best Stocks Today ➞ Best Stocks Weekly ➞ Best Stocks Year-to-Date ➞ Best Stocks Trends ➞  Best Stocks Today 12Stocks.com Best Nasdaq Stocks ➞ Best S&P 500 Stocks ➞ Best Tech Stocks ➞ Best Biotech Stocks ➞ |
| Detailed Overview of Biotech Stocks |
| Biotech Technical Overview, Leaders & Laggards, Top Biotech ETF Funds & Detailed Biotech Stocks List, Charts, Trends & More |
| Biotech Sector: Technical Analysis, Trends & YTD Performance | |
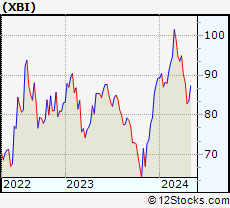
| Biotech sector, as represented by XBI, an exchange-traded fund [ETF] that holds basket of Biotech stocks (e.g, Amgen, Celgene) is down by -6.51% and is currently underperforming the overall market by -10.7% year-to-date. Below is a quick view of Technical charts and trends: | |
 XBI Weekly Chart |
|
| Long Term Trend: Not Good | |
| Medium Term Trend: Not Good | |
 XBI Daily Chart |
|
| Short Term Trend: Deteriorating | |
| Overall Trend Score: 10 | |
| YTD Performance: -6.51% | |
| **Trend Scores & Views Are Only For Educational Purposes And Not For Investing | |
| 12Stocks.com: Top Performing Biotech Sector Stocks | ||||||||||||||||||||||||||||||||||||||||||||||||
 The top performing Biotech sector stocks year to date are
Now, more recently, over last week, the top performing Biotech sector stocks on the move are


|
||||||||||||||||||||||||||||||||||||||||||||||||
| 12Stocks.com: Investing in Biotech Sector using Exchange Traded Funds | |
|
The following table shows list of key exchange traded funds (ETF) that
help investors track Biotech Index. For detailed view, check out our ETF Funds section of our website. Quick View: Move mouse or cursor over ETF symbol (ticker) to view short-term Technical chart and over ETF name to view long term chart. Click on ticker or stock name for detailed view. Click on to add stock symbol to your watchlist and to view watchlist. |
12Stocks.com List of ETFs that track Biotech Index
| Ticker | ETF Name | Watchlist | Recent Price | Market Intelligence Score | Change % | Week % | Year-to-date % |
| LABD | Biotech Bear 3X | | 10.52 | 82 | 4.37 | 17.15 | 8.57% |
| XBI | Biotech | | 83.48 | 10 | -1.38 | -5.3 | -6.51% |
| LABU | Biotech Bull 3X | | 88.04 | 10 | -4.33 | -15.63 | -27.82% |
| IBB | Biotechnology | | 124.64 | 0 | -0.99 | -3.81 | -8.25% |
| IYH | Healthcare | | 58.05 | 10 | -0.02 | -0.6 | 1.4% |
| IXJ | Global Healthcare | | 87.41 | 18 | -0.26 | -0.65 | 0.8% |
| BTEC | Principal Healthcare Innovators | | 34.09 | 10 | -1.51 | -5.29 | -6.17% |
| IHF | Healthcare Providers | | 51.55 | 45 | 0.93 | 1.99 | -1.84% |
| CURE | Healthcare Bull 3X | | 102.22 | 18 | -0.44 | -1.14 | 0.47% |
| FBT | First NYSE | | 141.52 | 10 | -1.52 | -3.94 | -10.46% |
| BIB | Biotechnology | | 47.94 | 0 | -2.02 | -6.71 | -15.97% |
| BIS | Short Biotech | | 20.87 | 95 | 1.69 | 6.46 | 15.47% |
| PTH | DWA Healthcare Momentum | | 39.57 | 46 | -2.18 | -5.4 | 1.1% |
| PBE | Biotech & Genome | | 59.62 | 18 | -1.75 | -2.66 | -9.45% |
| BBH | Biotech | | 152.35 | 10 | -0.43 | -3.33 | -7.84% |
| BBP | Bio Biotechnology Products | | 50.60 | 18 | -2.76 | -4.7 | -12.9% |
| BBC | Bio Biotechnology Clinical | | 25.48 | 36 | -1.32 | -6.06 | 4.2% |
| 12Stocks.com: Charts, Trends, Fundamental Data and Performances of Biotech Stocks | |
|
We now take in-depth look at all Biotech stocks including charts, multi-period performances and overall trends (as measured by market intelligence score). One can sort Biotech stocks (click link to choose) by Daily, Weekly and by Year-to-Date performances. Also, one can sort by size of the company or by market capitalization. |
| Select Your Default Chart Type: | |||||
| |||||
| Click on stock symbol or name for detailed view. Click on to add stock symbol to your watchlist and to view watchlist. Quick View: Move mouse or cursor over "Daily" to quickly view daily Technical stock chart and over "Weekly" to view weekly Technical stock chart. | |||||

 | KNSA Kiniksa Pharmaceuticals, Ltd. |
| Sector: Health Care | |
| SubSector: Biotechnology | |
| MarketCap: 780.285 Millions | |
| Recent Price: 16.88 Market Intelligence Score: 10 | |
| Day Percent Change: -0.41% Day Change: -0.07 | |
| Week Change: -2.37% Year-to-date Change: -3.8% | |
| KNSA Links: Profile News Message Board | |
| Charts:- Daily , Weekly | |
| Add KNSA to Watchlist: View: Get Complete KNSA Trend Analysis ➞ | |
 | MDGL Madrigal Pharmaceuticals, Inc. |
| Sector: Health Care | |
| SubSector: Biotechnology | |
| MarketCap: 1104.35 Millions | |
| Recent Price: 222.26 Market Intelligence Score: 46 | |
| Day Percent Change: -2.66% Day Change: -6.08 | |
| Week Change: -6.06% Year-to-date Change: -3.9% | |
| MDGL Links: Profile News Message Board | |
| Charts:- Daily , Weekly | |
| Add MDGL to Watchlist: View: Get Complete MDGL Trend Analysis ➞ | |
 | MORF Morphic Holding, Inc. |
| Sector: Health Care | |
| SubSector: Biotechnology | |
| MarketCap: 484.885 Millions | |
| Recent Price: 27.51 Market Intelligence Score: 10 | |
| Day Percent Change: -1.29% Day Change: -0.36 | |
| Week Change: -4.01% Year-to-date Change: -4.7% | |
| MORF Links: Profile News Message Board | |
| Charts:- Daily , Weekly | |
| Add MORF to Watchlist: View: Get Complete MORF Trend Analysis ➞ | |
 | URGN UroGen Pharma Ltd. |
| Sector: Health Care | |
| SubSector: Biotechnology | |
| MarketCap: 373.485 Millions | |
| Recent Price: 14.26 Market Intelligence Score: 12 | |
| Day Percent Change: 0.14% Day Change: 0.02 | |
| Week Change: -5.56% Year-to-date Change: -4.9% | |
| URGN Links: Profile News Message Board | |
| Charts:- Daily , Weekly | |
| Add URGN to Watchlist: View: Get Complete URGN Trend Analysis ➞ | |
 | WVE Wave Life Sciences Ltd. |
| Sector: Health Care | |
| SubSector: Biotechnology | |
| MarketCap: 452.785 Millions | |
| Recent Price: 4.80 Market Intelligence Score: 26 | |
| Day Percent Change: 0.21% Day Change: 0.01 | |
| Week Change: -17.24% Year-to-date Change: -5.0% | |
| WVE Links: Profile News Message Board | |
| Charts:- Daily , Weekly | |
| Add WVE to Watchlist: View: Get Complete WVE Trend Analysis ➞ | |
 | CGEN Compugen Ltd. |
| Sector: Health Care | |
| SubSector: Biotechnology | |
| MarketCap: 634.285 Millions | |
| Recent Price: 1.88 Market Intelligence Score: 10 | |
| Day Percent Change: -1.05% Day Change: -0.02 | |
| Week Change: -11.74% Year-to-date Change: -5.1% | |
| CGEN Links: Profile News Message Board | |
| Charts:- Daily , Weekly | |
| Add CGEN to Watchlist: View: Get Complete CGEN Trend Analysis ➞ | |
 | AVTE Aerovate Therapeutics, Inc. |
| Sector: Health Care | |
| SubSector: Biotechnology | |
| MarketCap: 478 Millions | |
| Recent Price: 21.43 Market Intelligence Score: 36 | |
| Day Percent Change: -4.03% Day Change: -0.90 | |
| Week Change: -15.1% Year-to-date Change: -5.1% | |
| AVTE Links: Profile News Message Board | |
| Charts:- Daily , Weekly | |
| Add AVTE to Watchlist: View: Get Complete AVTE Trend Analysis ➞ | |
 | SNDX Syndax Pharmaceuticals, Inc. |
| Sector: Health Care | |
| SubSector: Biotechnology | |
| MarketCap: 365.985 Millions | |
| Recent Price: 20.49 Market Intelligence Score: 46 | |
| Day Percent Change: -1.21% Day Change: -0.25 | |
| Week Change: -5.66% Year-to-date Change: -5.2% | |
| SNDX Links: Profile News Message Board | |
| Charts:- Daily , Weekly | |
| Add SNDX to Watchlist: View: Get Complete SNDX Trend Analysis ➞ | |
 | IMAB I Mab |
| Sector: Health Care | |
| SubSector: Biotechnology | |
| MarketCap: 26187 Millions | |
| Recent Price: 1.80 Market Intelligence Score: 48 | |
| Day Percent Change: -0.55% Day Change: -0.01 | |
| Week Change: -0.55% Year-to-date Change: -5.3% | |
| IMAB Links: Profile News Message Board | |
| Charts:- Daily , Weekly | |
| Add IMAB to Watchlist: View: Get Complete IMAB Trend Analysis ➞ | |
 | ITOS iTeos Therapeutics, Inc. |
| Sector: Health Care | |
| SubSector: Biotechnology | |
| MarketCap: 10487 Millions | |
| Recent Price: 10.34 Market Intelligence Score: 36 | |
| Day Percent Change: -3.23% Day Change: -0.34 | |
| Week Change: -11.82% Year-to-date Change: -5.5% | |
| ITOS Links: Profile News Message Board | |
| Charts:- Daily , Weekly | |
| Add ITOS to Watchlist: View: Get Complete ITOS Trend Analysis ➞ | |
 | HOOK HOOKIPA Pharma Inc. |
| Sector: Health Care | |
| SubSector: Biotechnology | |
| MarketCap: 294.785 Millions | |
| Recent Price: 0.76 Market Intelligence Score: 41 | |
| Day Percent Change: 0.31% Day Change: 0.00 | |
| Week Change: -2.75% Year-to-date Change: -5.6% | |
| HOOK Links: Profile News Message Board | |
| Charts:- Daily , Weekly | |
| Add HOOK to Watchlist: View: Get Complete HOOK Trend Analysis ➞ | |
 | VRCA Verrica Pharmaceuticals Inc. |
| Sector: Health Care | |
| SubSector: Biotechnology | |
| MarketCap: 289.585 Millions | |
| Recent Price: 6.91 Market Intelligence Score: 66 | |
| Day Percent Change: -2.12% Day Change: -0.15 | |
| Week Change: 0.58% Year-to-date Change: -5.6% | |
| VRCA Links: Profile News Message Board | |
| Charts:- Daily , Weekly | |
| Add VRCA to Watchlist: View: Get Complete VRCA Trend Analysis ➞ | |
 | ARGX argenx SE |
| Sector: Health Care | |
| SubSector: Biotechnology | |
| MarketCap: 5077.05 Millions | |
| Recent Price: 358.41 Market Intelligence Score: 10 | |
| Day Percent Change: -2.13% Day Change: -7.79 | |
| Week Change: -5.19% Year-to-date Change: -5.8% | |
| ARGX Links: Profile News Message Board | |
| Charts:- Daily , Weekly | |
| Add ARGX to Watchlist: View: Get Complete ARGX Trend Analysis ➞ | |
 | ROIV Roivant Sciences Ltd. |
| Sector: Health Care | |
| SubSector: Biotechnology | |
| MarketCap: 7780 Millions | |
| Recent Price: 10.45 Market Intelligence Score: 26 | |
| Day Percent Change: 0.00% Day Change: 0.00 | |
| Week Change: -4.48% Year-to-date Change: -5.9% | |
| ROIV Links: Profile News Message Board | |
| Charts:- Daily , Weekly | |
| Add ROIV to Watchlist: View: Get Complete ROIV Trend Analysis ➞ | |
 | PRQR ProQR Therapeutics N.V. |
| Sector: Health Care | |
| SubSector: Biotechnology | |
| MarketCap: 324.385 Millions | |
| Recent Price: 1.86 Market Intelligence Score: 10 | |
| Day Percent Change: -2.11% Day Change: -0.04 | |
| Week Change: -15.45% Year-to-date Change: -6.1% | |
| PRQR Links: Profile News Message Board | |
| Charts:- Daily , Weekly | |
| Add PRQR to Watchlist: View: Get Complete PRQR Trend Analysis ➞ | |
 | KALV KalVista Pharmaceuticals, Inc. |
| Sector: Health Care | |
| SubSector: Biotechnology | |
| MarketCap: 138.385 Millions | |
| Recent Price: 11.50 Market Intelligence Score: 25 | |
| Day Percent Change: -1.29% Day Change: -0.15 | |
| Week Change: -3.28% Year-to-date Change: -6.1% | |
| KALV Links: Profile News Message Board | |
| Charts:- Daily , Weekly | |
| Add KALV to Watchlist: View: Get Complete KALV Trend Analysis ➞ | |
 | EXEL Exelixis, Inc. |
| Sector: Health Care | |
| SubSector: Biotechnology | |
| MarketCap: 5254.75 Millions | |
| Recent Price: 22.49 Market Intelligence Score: 51 | |
| Day Percent Change: -1.66% Day Change: -0.38 | |
| Week Change: -0.71% Year-to-date Change: -6.3% | |
| EXEL Links: Profile News Message Board | |
| Charts:- Daily , Weekly | |
| Add EXEL to Watchlist: View: Get Complete EXEL Trend Analysis ➞ | |
 | RFL Rafael Holdings, Inc. |
| Sector: Health Care | |
| SubSector: Biotechnology | |
| MarketCap: 203.685 Millions | |
| Recent Price: 1.71 Market Intelligence Score: 37 | |
| Day Percent Change: -3.93% Day Change: -0.07 | |
| Week Change: 3.01% Year-to-date Change: -6.6% | |
| RFL Links: Profile News Message Board | |
| Charts:- Daily , Weekly | |
| Add RFL to Watchlist: View: Get Complete RFL Trend Analysis ➞ | |
 | BMRN BioMarin Pharmaceutical Inc. |
| Sector: Health Care | |
| SubSector: Biotechnology | |
| MarketCap: 14887.5 Millions | |
| Recent Price: 90.07 Market Intelligence Score: 68 | |
| Day Percent Change: -0.44% Day Change: -0.40 | |
| Week Change: -2.33% Year-to-date Change: -6.6% | |
| BMRN Links: Profile News Message Board | |
| Charts:- Daily , Weekly | |
| Add BMRN to Watchlist: View: Get Complete BMRN Trend Analysis ➞ | |
 | MNOV MediciNova, Inc. |
| Sector: Health Care | |
| SubSector: Biotechnology | |
| MarketCap: 137.685 Millions | |
| Recent Price: 1.40 Market Intelligence Score: 54 | |
| Day Percent Change: -2.10% Day Change: -0.03 | |
| Week Change: -10.83% Year-to-date Change: -6.7% | |
| MNOV Links: Profile News Message Board | |
| Charts:- Daily , Weekly | |
| Add MNOV to Watchlist: View: Get Complete MNOV Trend Analysis ➞ | |
 | GNFT Genfit SA |
| Sector: Health Care | |
| SubSector: Biotechnology | |
| MarketCap: 529.285 Millions | |
| Recent Price: 3.59 Market Intelligence Score: 10 | |
| Day Percent Change: -1.10% Day Change: -0.04 | |
| Week Change: 0.27% Year-to-date Change: -6.8% | |
| GNFT Links: Profile News Message Board | |
| Charts:- Daily , Weekly | |
| Add GNFT to Watchlist: View: Get Complete GNFT Trend Analysis ➞ | |
 | CARA Cara Therapeutics, Inc. |
| Sector: Health Care | |
| SubSector: Biotechnology | |
| MarketCap: 597.985 Millions | |
| Recent Price: 0.69 Market Intelligence Score: 46 | |
| Day Percent Change: -5.72% Day Change: -0.04 | |
| Week Change: -9.7% Year-to-date Change: -7.1% | |
| CARA Links: Profile News Message Board | |
| Charts:- Daily , Weekly | |
| Add CARA to Watchlist: View: Get Complete CARA Trend Analysis ➞ | |
 | ANAB AnaptysBio, Inc. |
| Sector: Health Care | |
| SubSector: Biotechnology | |
| MarketCap: 405.985 Millions | |
| Recent Price: 19.83 Market Intelligence Score: 5 | |
| Day Percent Change: -7.64% Day Change: -1.64 | |
| Week Change: -12.68% Year-to-date Change: -7.4% | |
| ANAB Links: Profile News Message Board | |
| Charts:- Daily , Weekly | |
| Add ANAB to Watchlist: View: Get Complete ANAB Trend Analysis ➞ | |
 | CERT Certara, Inc. |
| Sector: Health Care | |
| SubSector: Biotechnology | |
| MarketCap: 21487 Millions | |
| Recent Price: 16.19 Market Intelligence Score: 36 | |
| Day Percent Change: -4.51% Day Change: -0.76 | |
| Week Change: -8.38% Year-to-date Change: -8.0% | |
| CERT Links: Profile News Message Board | |
| Charts:- Daily , Weekly | |
| Add CERT to Watchlist: View: Get Complete CERT Trend Analysis ➞ | |
 | CDXS Codexis, Inc. |
| Sector: Health Care | |
| SubSector: Biotechnology | |
| MarketCap: 592.185 Millions | |
| Recent Price: 2.80 Market Intelligence Score: 63 | |
| Day Percent Change: 1.45% Day Change: 0.04 | |
| Week Change: -2.44% Year-to-date Change: -8.2% | |
| CDXS Links: Profile News Message Board | |
| Charts:- Daily , Weekly | |
| Add CDXS to Watchlist: View: Get Complete CDXS Trend Analysis ➞ | |
| To view more stocks, click on Next / Previous arrows or select different range: 0 - 25 , 25 - 50 , 50 - 75 , 75 - 100 , 100 - 125 , 125 - 150 , 150 - 175 , 175 - 200 , 200 - 225 , 225 - 250 , 250 - 275 , 275 - 300 , 300 - 325 , 325 - 350 , 350 - 375 , 375 - 400 | ||
| Click To Change The Sort Order: By Market Cap or Company Size Performance: Year-to-date, Week and Day | |
| Select Chart Type: | ||
|
Best Stocks Today 12Stocks.com |
© 2024 12Stocks.com Terms & Conditions Privacy Contact Us
All Information Provided Only For Education And Not To Be Used For Investing or Trading. See Terms & Conditions


One More Thing ... Get Best Stocks Delivered Daily!
Never Ever Miss A Move With Our Top Ten Stocks Lists
Find Best Stocks In Any Market - Bull or Bear Market
Take A Peek At Our Top Ten Stocks Lists: Daily, Weekly, Year-to-Date & Top Trends
Find Best Stocks In Any Market - Bull or Bear Market
Take A Peek At Our Top Ten Stocks Lists: Daily, Weekly, Year-to-Date & Top Trends
Biotech Stocks With Best Up Trends [0-bearish to 100-bullish]: Cullinan Oncology[100], Geron [100], ALX Oncology[100], Zura Bio[93], NuCana [93], Reneo [93], Avadel [93], Vanda [93], Acrivon [88], Shattuck Labs[88], Galera [88]
Best Biotech Stocks Year-to-Date:
Precision [2836.99%], Inovio [1900%], Assembly [1525.41%], Adverum nologies[1381.14%], NuCana [1269.17%], Affimed N.V[711.2%], Corbus [504.8%], Agenus [500.31%], Mesoblast [364.55%], Janux [348.12%], Addex [294.25%] Best Biotech Stocks This Week:
NuCana [1708.84%], ProKidney [32%], ALX Oncology[20.64%], Vanda [20.63%], Galera [16.43%], Cullinan Oncology[13.89%], Rani [13.15%], Humacyte [12.67%], Bicycle [9.91%], Zura Bio[9.52%], Intra-Cellular Therapies[9.29%] Best Biotech Stocks Daily:
Zura Bio[17.20%], Bicycle [12.33%], Vaxxinity [10.05%], Annovis Bio[9.57%], RedHill Biopharma[9.16%], Cullinan Oncology[6.42%], Longboard [6.07%], Addex [5.31%], Ginkgo Bioworks[5.13%], Century [5.13%], Acrivon [5.08%]