
 Login Sign Up


| |||||
 |  | ||||

| 12Stocks.com Market Intelligence |
Best Biotech Stocks
|
|
| Quick Read: Best Biotech Stocks List By Performances & Trends: Daily, Weekly, Year-to-Date, Market Cap (Size) & Technical Trends | |||
| Best Biotech Stocks Views: Quick Browse View, Summary & Slide Show View | |||
| 12Stocks.com Biotech Stocks Performances & Trends Daily | |||||||||
|
|  The overall market intelligence score is 10 (0-bearish to 100-bullish) which puts Biotech sector in short term bearish trend. The market intelligence score from previous trading session is 0 and hence an improvement of trend.
| ||||||||
Here are the market intelligence trend scores of the most requested Biotech stocks at 12Stocks.com (click stock name for detailed review):
|


| 12Stocks.com: Investing in Biotech sector with Stocks | |
|
The following table helps investors and traders sort through current performance and trends (as measured by market intelligence score) of various
stocks in the Biotech sector. Quick View: Move mouse or cursor over stock symbol (ticker) to view short-term Technical chart and over stock name to view long term chart. Click on  to add stock symbol to your watchlist and to add stock symbol to your watchlist and  to view watchlist. Click on any ticker or stock name for detailed market intelligence report for that stock. to view watchlist. Click on any ticker or stock name for detailed market intelligence report for that stock. |
12Stocks.com Performance of Stocks in Biotech Sector
| Ticker | Stock Name | Watchlist | Category | Recent Price | Market Intelligence Score | Change % | YTD Change% |
| URGN | UroGen Pharma |   | Biotechnology | 13.78 | 7 | -3.37% | -8.13% |
| MDGL | Madrigal | | Biotechnology | 212.33 | 0 | -4.47% | -8.23% |
| BHVN | Biohaven | | Biotechnology | 38.99 | 0 | -7.52% | -8.90% |
| DCPH | Deciphera | | Biotechnology | 14.69 | 41 | 3.23% | -8.93% |
| INBX | Inhibrx | | Biotechnology | 34.46 | 8 | -0.03% | -9.34% |
| CERT | Certara | | Biotechnology | 15.93 | 10 | -1.61% | -9.49% |
| FHTX | Foghorn | | Biotechnology | 5.80 | 53 | 4.03% | -9.51% |
| HOOK | HOOKIPA Pharma | | Biotechnology | 0.73 | 46 | -4.34% | -9.67% |
| HRMY | Harmony | | Biotechnology | 29.13 | 27 | 0.28% | -9.79% |
| GMAB | Genmab A/S | | Biotechnology | 28.72 | 53 | 1.38% | -9.80% |
| CPRX | Catalyst | | Biotechnology | 15.13 | 26 | -1.37% | -9.99% |
| JAZZ | Jazz | | Biotechnology | 109.94 | 32 | 0.61% | -10.62% |
| CARA | Cara | | Biotechnology | 0.66 | 36 | -4.20% | -11.04% |
| AKRO | Akero | | Biotechnology | 20.76 | 20 | 1.22% | -11.09% |
| VYGR | Voyager | | Biotechnology | 7.50 | 36 | -0.66% | -11.14% |
| RARE | Ultragenyx | | Biotechnology | 42.37 | 8 | -2.33% | -11.40% |
| AVRO | AVROBIO | | Biotechnology | 1.21 | 0 | -2.82% | -11.40% |
| IPHA | Innate Pharma | | Biotechnology | 2.48 | 37 | 3.33% | -11.43% |
| CRSP | CRISPR | | Biotechnology | 55.05 | 10 | -1.98% | -12.06% |
| BEAM | Beam | | Biotechnology | 23.90 | 10 | -1.69% | -12.20% |
| ATHA | Athira Pharma | | Biotechnology | 2.14 | 32 | 3.38% | -12.30% |
| SEER | Seer | | Biotechnology | 1.71 | 15 | -2.56% | -12.31% |
| PHAR | Pharming | | Biotechnology | 10.00 | 0 | -1.67% | -12.51% |
| RGNX | REGENXBIO | | Biotechnology | 15.69 | 36 | -2.61% | -12.59% |
| RGEN | Repligen | | Biotechnology | 157.14 | 17 | 0.05% | -12.60% |
| To view more stocks, click on Next / Previous arrows or select different range: 0 - 25 , 25 - 50 , 50 - 75 , 75 - 100 , 100 - 125 , 125 - 150 , 150 - 175 , 175 - 200 , 200 - 225 , 225 - 250 , 250 - 275 , 275 - 300 , 300 - 325 , 325 - 350 , 350 - 375 , 375 - 400 | ||
 | Click To Change The Sort Order: By Market Cap or Company Size Performance: Year-to-date, Week and Day |  |
|
Get the most comprehensive stock market coverage daily at 12Stocks.com ➞ Best Stocks Today ➞ Best Stocks Weekly ➞ Best Stocks Year-to-Date ➞ Best Stocks Trends ➞  Best Stocks Today 12Stocks.com Best Nasdaq Stocks ➞ Best S&P 500 Stocks ➞ Best Tech Stocks ➞ Best Biotech Stocks ➞ |
| Detailed Overview of Biotech Stocks |
| Biotech Technical Overview, Leaders & Laggards, Top Biotech ETF Funds & Detailed Biotech Stocks List, Charts, Trends & More |
| Biotech Sector: Technical Analysis, Trends & YTD Performance | |
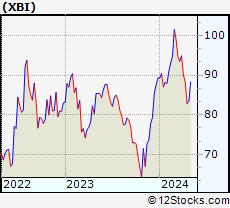
| Biotech sector, as represented by XBI, an exchange-traded fund [ETF] that holds basket of Biotech stocks (e.g, Amgen, Celgene) is down by -7.23% and is currently underperforming the overall market by -10.61% year-to-date. Below is a quick view of Technical charts and trends: | |
 XBI Weekly Chart |
|
| Long Term Trend: Not Good | |
| Medium Term Trend: Not Good | |
 XBI Daily Chart |
|
| Short Term Trend: Not Good | |
| Overall Trend Score: 10 | |
| YTD Performance: -7.23% | |
| **Trend Scores & Views Are Only For Educational Purposes And Not For Investing | |
| 12Stocks.com: Top Performing Biotech Sector Stocks | ||||||||||||||||||||||||||||||||||||||||||||||||
 The top performing Biotech sector stocks year to date are
Now, more recently, over last week, the top performing Biotech sector stocks on the move are


|
||||||||||||||||||||||||||||||||||||||||||||||||
| 12Stocks.com: Investing in Biotech Sector using Exchange Traded Funds | |
|
The following table shows list of key exchange traded funds (ETF) that
help investors track Biotech Index. For detailed view, check out our ETF Funds section of our website. Quick View: Move mouse or cursor over ETF symbol (ticker) to view short-term Technical chart and over ETF name to view long term chart. Click on ticker or stock name for detailed view. Click on to add stock symbol to your watchlist and to view watchlist. |
12Stocks.com List of ETFs that track Biotech Index
| Ticker | ETF Name | Watchlist | Recent Price | Market Intelligence Score | Change % | Week % | Year-to-date % |
| LABD | Biotech Bear 3X | | 10.80 | 100 | 2.66 | 20.27 | 11.46% |
| XBI | Biotech | | 82.83 | 10 | -0.78 | -6.04 | -7.23% |
| LABU | Biotech Bull 3X | | 86.05 | 10 | -2.26 | -17.54 | -29.45% |
| IBB | Biotechnology | | 124.72 | 10 | 0.06 | -3.75 | -8.19% |
| IYH | Healthcare | | 58.16 | 18 | 0.19 | -0.41 | 1.59% |
| IXJ | Global Healthcare | | 87.75 | 25 | 0.39 | -0.26 | 1.19% |
| IHF | Healthcare Providers | | 52.21 | 62 | 1.29 | 3.3 | -0.57% |
| CURE | Healthcare Bull 3X | | 103.33 | 25 | 1.09 | -0.06 | 1.56% |
| FBT | First NYSE | | 141.68 | 10 | 0.11 | -3.83 | -10.36% |
| BIB | Biotechnology | | 48.20 | 10 | 0.54 | -6.21 | -15.51% |
| BIS | Short Biotech | | 20.90 | 95 | 0.14 | 6.61 | 15.63% |
| PTH | DWA Healthcare Momentum | | 39.53 | 23 | -0.10 | -5.5 | 1% |
| BBH | Biotech | | 152.36 | 10 | 0.01 | -3.32 | -7.83% |
| PBE | Biotech & Genome | | 59.85 | 10 | 0.39 | -2.29 | -9.1% |
| BBC | Bio Biotechnology Clinical | | 24.71 | 0 | -3.02 | -8.9 | 1.05% |
| BBP | Bio Biotechnology Products | | 50.43 | 0 | -0.34 | -5.02 | -13.19% |
| BTEC | Principal Healthcare Innovators | | 33.86 | 0 | -0.67 | -5.92 | -6.8% |
| 12Stocks.com: Charts, Trends, Fundamental Data and Performances of Biotech Stocks | |
|
We now take in-depth look at all Biotech stocks including charts, multi-period performances and overall trends (as measured by market intelligence score). One can sort Biotech stocks (click link to choose) by Daily, Weekly and by Year-to-Date performances. Also, one can sort by size of the company or by market capitalization. |
| Select Your Default Chart Type: | |||||
| |||||
| Click on stock symbol or name for detailed view. Click on to add stock symbol to your watchlist and to view watchlist. Quick View: Move mouse or cursor over "Daily" to quickly view daily Technical stock chart and over "Weekly" to view weekly Technical stock chart. | |||||

 | URGN UroGen Pharma Ltd. |
| Sector: Health Care | |
| SubSector: Biotechnology | |
| MarketCap: 373.485 Millions | |
| Recent Price: 13.78 Market Intelligence Score: 7 | |
| Day Percent Change: -3.37% Day Change: -0.48 | |
| Week Change: -8.74% Year-to-date Change: -8.1% | |
| URGN Links: Profile News Message Board | |
| Charts:- Daily , Weekly | |
| Add URGN to Watchlist: View: Get Complete URGN Trend Analysis ➞ | |
 | MDGL Madrigal Pharmaceuticals, Inc. |
| Sector: Health Care | |
| SubSector: Biotechnology | |
| MarketCap: 1104.35 Millions | |
| Recent Price: 212.33 Market Intelligence Score: 0 | |
| Day Percent Change: -4.47% Day Change: -9.93 | |
| Week Change: -10.25% Year-to-date Change: -8.2% | |
| MDGL Links: Profile News Message Board | |
| Charts:- Daily , Weekly | |
| Add MDGL to Watchlist: View: Get Complete MDGL Trend Analysis ➞ | |
 | BHVN Biohaven Pharmaceutical Holding Company Ltd. |
| Sector: Health Care | |
| SubSector: Biotechnology | |
| MarketCap: 2024.25 Millions | |
| Recent Price: 38.99 Market Intelligence Score: 0 | |
| Day Percent Change: -7.52% Day Change: -3.17 | |
| Week Change: -26.54% Year-to-date Change: -8.9% | |
| BHVN Links: Profile News Message Board | |
| Charts:- Daily , Weekly | |
| Add BHVN to Watchlist: View: Get Complete BHVN Trend Analysis ➞ | |
 | DCPH Deciphera Pharmaceuticals, Inc. |
| Sector: Health Care | |
| SubSector: Biotechnology | |
| MarketCap: 2329.95 Millions | |
| Recent Price: 14.69 Market Intelligence Score: 41 | |
| Day Percent Change: 3.23% Day Change: 0.46 | |
| Week Change: -2.39% Year-to-date Change: -8.9% | |
| DCPH Links: Profile News Message Board | |
| Charts:- Daily , Weekly | |
| Add DCPH to Watchlist: View: Get Complete DCPH Trend Analysis ➞ | |
 | INBX Inhibrx, Inc. |
| Sector: Health Care | |
| SubSector: Biotechnology | |
| MarketCap: 14187 Millions | |
| Recent Price: 34.46 Market Intelligence Score: 8 | |
| Day Percent Change: -0.03% Day Change: -0.01 | |
| Week Change: -1.49% Year-to-date Change: -9.3% | |
| INBX Links: Profile News Message Board | |
| Charts:- Daily , Weekly | |
| Add INBX to Watchlist: View: Get Complete INBX Trend Analysis ➞ | |
 | CERT Certara, Inc. |
| Sector: Health Care | |
| SubSector: Biotechnology | |
| MarketCap: 21487 Millions | |
| Recent Price: 15.93 Market Intelligence Score: 10 | |
| Day Percent Change: -1.61% Day Change: -0.26 | |
| Week Change: -9.85% Year-to-date Change: -9.5% | |
| CERT Links: Profile News Message Board | |
| Charts:- Daily , Weekly | |
| Add CERT to Watchlist: View: Get Complete CERT Trend Analysis ➞ | |
 | FHTX Foghorn Therapeutics Inc. |
| Sector: Health Care | |
| SubSector: Biotechnology | |
| MarketCap: 74487 Millions | |
| Recent Price: 5.80 Market Intelligence Score: 53 | |
| Day Percent Change: 4.03% Day Change: 0.22 | |
| Week Change: -27.44% Year-to-date Change: -9.5% | |
| FHTX Links: Profile News Message Board | |
| Charts:- Daily , Weekly | |
| Add FHTX to Watchlist: View: Get Complete FHTX Trend Analysis ➞ | |
 | HOOK HOOKIPA Pharma Inc. |
| Sector: Health Care | |
| SubSector: Biotechnology | |
| MarketCap: 294.785 Millions | |
| Recent Price: 0.73 Market Intelligence Score: 46 | |
| Day Percent Change: -4.34% Day Change: -0.03 | |
| Week Change: -6.97% Year-to-date Change: -9.7% | |
| HOOK Links: Profile News Message Board | |
| Charts:- Daily , Weekly | |
| Add HOOK to Watchlist: View: Get Complete HOOK Trend Analysis ➞ | |
 | HRMY Harmony Biosciences Holdings, Inc. |
| Sector: Health Care | |
| SubSector: Biotechnology | |
| MarketCap: 24487 Millions | |
| Recent Price: 29.13 Market Intelligence Score: 27 | |
| Day Percent Change: 0.28% Day Change: 0.08 | |
| Week Change: -1.25% Year-to-date Change: -9.8% | |
| HRMY Links: Profile News Message Board | |
| Charts:- Daily , Weekly | |
| Add HRMY to Watchlist: View: Get Complete HRMY Trend Analysis ➞ | |
 | GMAB Genmab A/S |
| Sector: Health Care | |
| SubSector: Biotechnology | |
| MarketCap: 12482.3 Millions | |
| Recent Price: 28.72 Market Intelligence Score: 53 | |
| Day Percent Change: 1.38% Day Change: 0.39 | |
| Week Change: -1.85% Year-to-date Change: -9.8% | |
| GMAB Links: Profile News Message Board | |
| Charts:- Daily , Weekly | |
| Add GMAB to Watchlist: View: Get Complete GMAB Trend Analysis ➞ | |
 | CPRX Catalyst Pharmaceuticals, Inc. |
| Sector: Health Care | |
| SubSector: Biotechnology | |
| MarketCap: 365.185 Millions | |
| Recent Price: 15.13 Market Intelligence Score: 26 | |
| Day Percent Change: -1.37% Day Change: -0.21 | |
| Week Change: -0.59% Year-to-date Change: -10.0% | |
| CPRX Links: Profile News Message Board | |
| Charts:- Daily , Weekly | |
| Add CPRX to Watchlist: View: Get Complete CPRX Trend Analysis ➞ | |
 | JAZZ Jazz Pharmaceuticals plc |
| Sector: Health Care | |
| SubSector: Biotechnology | |
| MarketCap: 5576.05 Millions | |
| Recent Price: 109.94 Market Intelligence Score: 32 | |
| Day Percent Change: 0.61% Day Change: 0.67 | |
| Week Change: -0.58% Year-to-date Change: -10.6% | |
| JAZZ Links: Profile News Message Board | |
| Charts:- Daily , Weekly | |
| Add JAZZ to Watchlist: View: Get Complete JAZZ Trend Analysis ➞ | |
 | CARA Cara Therapeutics, Inc. |
| Sector: Health Care | |
| SubSector: Biotechnology | |
| MarketCap: 597.985 Millions | |
| Recent Price: 0.66 Market Intelligence Score: 36 | |
| Day Percent Change: -4.20% Day Change: -0.03 | |
| Week Change: -13.49% Year-to-date Change: -11.0% | |
| CARA Links: Profile News Message Board | |
| Charts:- Daily , Weekly | |
| Add CARA to Watchlist: View: Get Complete CARA Trend Analysis ➞ | |
 | AKRO Akero Therapeutics, Inc. |
| Sector: Health Care | |
| SubSector: Biotechnology | |
| MarketCap: 675.085 Millions | |
| Recent Price: 20.76 Market Intelligence Score: 20 | |
| Day Percent Change: 1.22% Day Change: 0.25 | |
| Week Change: -6.4% Year-to-date Change: -11.1% | |
| AKRO Links: Profile News Message Board | |
| Charts:- Daily , Weekly | |
| Add AKRO to Watchlist: View: Get Complete AKRO Trend Analysis ➞ | |
 | VYGR Voyager Therapeutics, Inc. |
| Sector: Health Care | |
| SubSector: Biotechnology | |
| MarketCap: 321.085 Millions | |
| Recent Price: 7.50 Market Intelligence Score: 36 | |
| Day Percent Change: -0.66% Day Change: -0.05 | |
| Week Change: -11.03% Year-to-date Change: -11.1% | |
| VYGR Links: Profile News Message Board | |
| Charts:- Daily , Weekly | |
| Add VYGR to Watchlist: View: Get Complete VYGR Trend Analysis ➞ | |
 | RARE Ultragenyx Pharmaceutical Inc. |
| Sector: Health Care | |
| SubSector: Biotechnology | |
| MarketCap: 2373.35 Millions | |
| Recent Price: 42.37 Market Intelligence Score: 8 | |
| Day Percent Change: -2.33% Day Change: -1.01 | |
| Week Change: -9.85% Year-to-date Change: -11.4% | |
| RARE Links: Profile News Message Board | |
| Charts:- Daily , Weekly | |
| Add RARE to Watchlist: View: Get Complete RARE Trend Analysis ➞ | |
 | AVRO AVROBIO, Inc. |
| Sector: Health Care | |
| SubSector: Biotechnology | |
| MarketCap: 626.185 Millions | |
| Recent Price: 1.21 Market Intelligence Score: 0 | |
| Day Percent Change: -2.82% Day Change: -0.03 | |
| Week Change: -5.12% Year-to-date Change: -11.4% | |
| AVRO Links: Profile News Message Board | |
| Charts:- Daily , Weekly | |
| Add AVRO to Watchlist: View: Get Complete AVRO Trend Analysis ➞ | |
 | IPHA Innate Pharma S.A. |
| Sector: Health Care | |
| SubSector: Biotechnology | |
| MarketCap: 309.485 Millions | |
| Recent Price: 2.48 Market Intelligence Score: 37 | |
| Day Percent Change: 3.33% Day Change: 0.08 | |
| Week Change: 0% Year-to-date Change: -11.4% | |
| IPHA Links: Profile News Message Board | |
| Charts:- Daily , Weekly | |
| Add IPHA to Watchlist: View: Get Complete IPHA Trend Analysis ➞ | |
 | CRSP CRISPR Therapeutics AG |
| Sector: Health Care | |
| SubSector: Biotechnology | |
| MarketCap: 2691.35 Millions | |
| Recent Price: 55.05 Market Intelligence Score: 10 | |
| Day Percent Change: -1.98% Day Change: -1.11 | |
| Week Change: -9.26% Year-to-date Change: -12.1% | |
| CRSP Links: Profile News Message Board | |
| Charts:- Daily , Weekly | |
| Add CRSP to Watchlist: View: Get Complete CRSP Trend Analysis ➞ | |
 | BEAM Beam Therapeutics Inc. |
| Sector: Health Care | |
| SubSector: Biotechnology | |
| MarketCap: 44987 Millions | |
| Recent Price: 23.90 Market Intelligence Score: 10 | |
| Day Percent Change: -1.69% Day Change: -0.41 | |
| Week Change: -7.83% Year-to-date Change: -12.2% | |
| BEAM Links: Profile News Message Board | |
| Charts:- Daily , Weekly | |
| Add BEAM to Watchlist: View: Get Complete BEAM Trend Analysis ➞ | |
 | ATHA Athira Pharma, Inc. |
| Sector: Health Care | |
| SubSector: Biotechnology | |
| MarketCap: 92487 Millions | |
| Recent Price: 2.14 Market Intelligence Score: 32 | |
| Day Percent Change: 3.38% Day Change: 0.07 | |
| Week Change: -12.3% Year-to-date Change: -12.3% | |
| ATHA Links: Profile News Message Board | |
| Charts:- Daily , Weekly | |
| Add ATHA to Watchlist: View: Get Complete ATHA Trend Analysis ➞ | |
 | SEER Seer, Inc. |
| Sector: Health Care | |
| SubSector: Biotechnology | |
| MarketCap: 48287 Millions | |
| Recent Price: 1.71 Market Intelligence Score: 15 | |
| Day Percent Change: -2.56% Day Change: -0.04 | |
| Week Change: -7.07% Year-to-date Change: -12.3% | |
| SEER Links: Profile News Message Board | |
| Charts:- Daily , Weekly | |
| Add SEER to Watchlist: View: Get Complete SEER Trend Analysis ➞ | |
 | PHAR Pharming Group N.V. |
| Sector: Health Care | |
| SubSector: Biotechnology | |
| MarketCap: 808 Millions | |
| Recent Price: 10.00 Market Intelligence Score: 0 | |
| Day Percent Change: -1.67% Day Change: -0.17 | |
| Week Change: -5.03% Year-to-date Change: -12.5% | |
| PHAR Links: Profile News Message Board | |
| Charts:- Daily , Weekly | |
| Add PHAR to Watchlist: View: Get Complete PHAR Trend Analysis ➞ | |
 | RGNX REGENXBIO Inc. |
| Sector: Health Care | |
| SubSector: Biotechnology | |
| MarketCap: 1232.85 Millions | |
| Recent Price: 15.69 Market Intelligence Score: 36 | |
| Day Percent Change: -2.61% Day Change: -0.42 | |
| Week Change: -13.27% Year-to-date Change: -12.6% | |
| RGNX Links: Profile News Message Board | |
| Charts:- Daily , Weekly | |
| Add RGNX to Watchlist: View: Get Complete RGNX Trend Analysis ➞ | |
 | RGEN Repligen Corporation |
| Sector: Health Care | |
| SubSector: Biotechnology | |
| MarketCap: 4711.75 Millions | |
| Recent Price: 157.14 Market Intelligence Score: 17 | |
| Day Percent Change: 0.05% Day Change: 0.08 | |
| Week Change: -8.39% Year-to-date Change: -12.6% | |
| RGEN Links: Profile News Message Board | |
| Charts:- Daily , Weekly | |
| Add RGEN to Watchlist: View: Get Complete RGEN Trend Analysis ➞ | |
| To view more stocks, click on Next / Previous arrows or select different range: 0 - 25 , 25 - 50 , 50 - 75 , 75 - 100 , 100 - 125 , 125 - 150 , 150 - 175 , 175 - 200 , 200 - 225 , 225 - 250 , 250 - 275 , 275 - 300 , 300 - 325 , 325 - 350 , 350 - 375 , 375 - 400 | ||
| Click To Change The Sort Order: By Market Cap or Company Size Performance: Year-to-date, Week and Day | |
| Select Chart Type: | ||
|
Best Stocks Today 12Stocks.com |
© 2024 12Stocks.com Terms & Conditions Privacy Contact Us
All Information Provided Only For Education And Not To Be Used For Investing or Trading. See Terms & Conditions


One More Thing ... Get Best Stocks Delivered Daily!
Never Ever Miss A Move With Our Top Ten Stocks Lists
Find Best Stocks In Any Market - Bull or Bear Market
Take A Peek At Our Top Ten Stocks Lists: Daily, Weekly, Year-to-Date & Top Trends
Find Best Stocks In Any Market - Bull or Bear Market
Take A Peek At Our Top Ten Stocks Lists: Daily, Weekly, Year-to-Date & Top Trends
Biotech Stocks With Best Up Trends [0-bearish to 100-bullish]: Vanda [100], Rani [95], Humacyte [95], ALX Oncology[95], United [93], Mesoblast [88], OPKO Health[88], Reneo [86], Silence [85], XOMA [83], Third Harmonic[83]
Best Biotech Stocks Year-to-Date:
Precision [2571.23%], Inovio [1798.04%], Assembly [1535.17%], Adverum nologies[1406.38%], NuCana [1188.03%], Affimed N.V[724%], Corbus [549.67%], Agenus [541.38%], Mesoblast [373.64%], Janux [353.14%], Addex [244.17%] Best Biotech Stocks This Week:
NuCana [1601.65%], Rani [30.93%], Humacyte [28.47%], Vanda [24.03%], ALX Oncology[22.49%], ProKidney [16.57%], Galera [15.36%], ADC [10.93%], Intra-Cellular Therapies[9.85%], VBI Vaccines[9.26%], Day One[8.64%] Best Biotech Stocks Daily:
Rani [15.71%], Genelux [14.25%], Humacyte [14.02%], Emergent Bio[9.68%], Adaptimmune [8.72%], BioXcel [8.63%], Corbus [7.42%], RedHill Biopharma[7.41%], bluebird bio[7.03%], ProQR [6.99%], Agenus [6.84%]