
 Login Sign Up


| |||||
 |  | ||||

| 12Stocks.com Market Intelligence |
Best Asia Stocks
|
|
| Quick Read: Top Asia Stocks By Performances & Trends: Daily, Weekly, Year-to-Date, Market Cap (Size) & Technical Trends | |||
| Best Asia Views: Quick Browse View, Summary & Slide Show | |||
| 12Stocks.com Asia Stocks Performances & Trends Daily | |||||||||
|
|  The overall market intelligence score is 100 (0-bearish to 100-bullish) which puts Asia index in short term bullish trend. The market intelligence score from previous trading session is 60 and hence an improvement of trend.
| ||||||||
Here are the market intelligence trend scores of the most requested Asia stocks at 12Stocks.com (click stock name for detailed review):
|


| Consider signing up for our daily 12Stocks.com "Best Stocks Newsletter". You will never ever miss a big stock move again! |
| 12Stocks.com: Top Performing Asia Index Stocks | |||||||||||||||||||||||||||||||||||||||||||||||
 The top performing Asia Index stocks year to date are
Now, more recently, over last week, the top performing Asia Index stocks on the move are


|
|||||||||||||||||||||||||||||||||||||||||||||||
| 12Stocks.com: Investing in Asia Index with Stocks | |
|
The following table helps investors and traders sort through current performance and trends (as measured by market intelligence score) of various
stocks in the Asia Index. Quick View: Move mouse or cursor over stock symbol (ticker) to view short-term technical chart and over stock name to view long term chart. Click on  to add stock symbol to your watchlist and to add stock symbol to your watchlist and  to view watchlist. Click on any ticker or stock name for detailed market intelligence report for that stock. to view watchlist. Click on any ticker or stock name for detailed market intelligence report for that stock. |
12Stocks.com Performance of Stocks in Asia Index
| Ticker | Stock Name | Watchlist | Category | Recent Price | Market Intelligence Score | Change % | YTD Change% |
| MMYT | MakeMyTrip |   | Services & Goods | 100.86 | 80 | -1.39% | -10.17% |
| MSC | Studio City | | Services & Goods | 4.81 | 40 | -4.75% | -14.87% |
| HSAI | Hesai | | Services & Goods | 23.06 | 61 | -11.00% | 66.86% |
| HKD | AMTD Digital | | Technology | 1.59 | 26 | 0.00% | -46.28% |
| GHG | GreenTree Hospitality | | Services & Goods | 2.13 | 30 | 0.00% | -16.80% |
| SIMO | Silicon Motion | | Technology | 74.20 | 80 | 0.08% | 40.79% |
| TSL | Trina Solar | | Technology | 12.55 | 80 | -1.34% | -30.55% |
| TUYA | Tuya | | Technology | 2.39 | 80 | 3.02% | 35.17% |
| SY | So-Young | | Technology | 3.89 | 30 | -4.19% | 384.74% |
| QFIN | 360 Finance | | Financials | 30.67 | 40 | 3.34% | -18.59% |
| CANG | Cango | | Technology | 4.69 | 70 | 2.18% | 6.59% |
| WDH | Waterdrop | | Financials | 1.77 | 80 | -0.56% | 51.92% |
| GGR | Gogoro | | Services & Goods | 0.33 | 80 | -0.78% | -33.48% |
| BEDU | Bright Scholar | | Services & Goods | 1.74 | 90 | 0.00% | 0.87% |
| DUO | Fangdd Network | | Financials | 1.36 | 50 | 3.41% | -85.79% |
| YJ | Yunji | | Services & Goods | 1.71 | 20 | 0.00% | 6.21% |
| SFWL | Shengfeng Development | | Industrials | 1.04 | 59 | 2.94% | -3.73% |
| ZH | Zhihu | | Services & Goods | 4.96 | 60 | 1.43% | 40.11% |
| LANV | Lanvin | | Services & Goods | 2.08 | 10 | -5.02% | 3.48% |
| DDL | Dingdong (Cayman) | | Consumer Staples | 2.21 | 50 | -4.74% | -32.62% |
| RERE | ATRenew | | Services & Goods | 4.65 | 60 | 1.97% | 61.46% |
| DQ | Daqo New | | Technology | 22.47 | 70 | -1.58% | 15.59% |
| IMOS | ChipMOS | | Technology | 15.25 | 40 | 0.59% | -15.45% |
| COE | China Online | | Services & Goods | 35.36 | 70 | 0.65% | 72.50% |
| JKS | JinkoSolar Holding | | Technology | 22.60 | 80 | -4.12% | -3.42% |
| To view more stocks, click on Next / Previous arrows or select different range: 0 - 25 , 25 - 50 , 50 - 75 , 75 - 100 , 100 - 125 , 125 - 150 , 150 - 175 , 175 - 200 | ||
 | Click To Change The Sort Order: By Market Cap or Company Size Performance: Year-to-date, Week and Day |  |
|
Get the most comprehensive stock market coverage daily at 12Stocks.com ➞ Best Stocks Today ➞ Best Stocks Weekly ➞ Best Stocks Year-to-Date ➞ Best Stocks Trends ➞  Best Stocks Today 12Stocks.com Best Nasdaq Stocks ➞ Best S&P 500 Stocks ➞ Best Tech Stocks ➞ Best Biotech Stocks ➞ |
| Detailed Overview of Asia Stocks |
| Asia Technical Overview, Leaders & Laggards, Top Asia ETF Funds & Detailed Asia Stocks List, Charts, Trends & More |
| Asia: Technical Analysis, Trends & YTD Performance | |
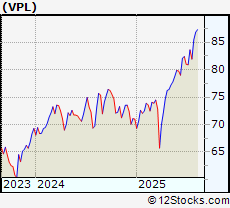
 VPL Weekly Chart |
|
| Long Term Trend: Very Good | |
| Medium Term Trend: Very Good | |
 VPL Daily Chart |
|
| Short Term Trend: Very Good | |
| Overall Trend Score: 100 | |
| YTD Performance: 21.07% | |
| **Trend Scores & Views Are Only For Educational Purposes And Not For Investing | |
| 12Stocks.com: Investing in Asia Index using Exchange Traded Funds | |
|
The following table shows list of key exchange traded funds (ETF) that
help investors play Asia stock market. For detailed view, check out our ETF Funds section of our website. Quick View: Move mouse or cursor over ETF symbol (ticker) to view short-term technical chart and over ETF name to view long term chart. Click on ticker or stock name for detailed view. Click on to add stock symbol to your watchlist and to view watchlist. |
12Stocks.com List of ETFs that track Asia Index
| Ticker | ETF Name | Watchlist | Recent Price | Market Intelligence Score | Change % | Week % | Year-to-date % |
| VPL | Pacific | | 87.25 | 100 | 1.78 | 0.48 | 21.07% |
| EEMA | Emerging Markets Asia | | 85.21 | 90 | -0.18 | -0.32 | 19.2% |
| AIA | Asia 50 | | 83.96 | 90 | -0.29 | -1.9 | 25.07% |
| AAXJ | All Country Asia | | 85.59 | 90 | -0.07 | -0.35 | 19.41% |
| GMF | Emerging Asia Pacific | | 130.85 | 100 | -0.14 | 0.09 | 13.23% |
| EPP | Pacific ex Japan | | 51.11 | 100 | 0.33 | 0.06 | 18.73% |
| ASEA | Southeast Asia | | 17.31 | 90 | -0.17 | -0.63 | 10.91% |
| DVYA | Asia/Pacific Dividend | | 41.78 | 100 | 0.69 | 0.36 | 19.96% |
| IPAC | Core Pacific | | 72.13 | 100 | -0.66 | 0.19 | 19.54% |
| FXI | China Large-Cap | | 39.24 | 100 | 2.27 | 2.35 | 23.05% |
| EWY | South Korea | | 73.5 | 70 | 3.2 | 0.15 | 36.19% |
| EWT | Taiwan | | 59.65 | 50 | 1.84 | -1.27 | 15.94% |
| EWJ | Japan | | 79.98 | 80 | 1.63 | -0.21 | 18.03% |
| EWH | Hong Kong | | 21.48 | 90 | 1.46 | 1.37 | 33% |
| EWS | Singapore | | 28.27 | 100 | 2.13 | 1.91 | 27.47% |
| EWM | Malaysia | | 25.72 | 100 | 2.1 | 2.96 | 9.82% |
| EPHE | Philippines | | 26.15 | 60 | -0.76 | -0.49 | 5.72% |
| EIDO | Indonesia | | 18.44 | 90 | -0.86 | -1.02 | 2.45% |
| THD | Thailand | | 57.19 | 90 | -0.49 | -1.09 | -3.2% |
| VNM | Vietnam | | 17.60 | 50 | -0.51 | -0.9 | 53.31% |
| 12Stocks.com: Charts, Trends, Fundamental Data and Performances of Asia Stocks | |
|
We now take in-depth look at all Asia stocks including charts, multi-period performances and overall trends (as measured by market intelligence score). One can sort Asia stocks (click link to choose) by Daily, Weekly and by Year-to-Date performances. Also, one can sort by size of the company or by market capitalization. |
| Select Your Default Chart Type: | |||||
| |||||
| Click on stock symbol or name for detailed view. Click on to add stock symbol to your watchlist and to view watchlist. Quick View: Move mouse or cursor over "Daily" to quickly view daily technical stock chart and over "Weekly" to view weekly technical stock chart. | |||||

 | MMYT MakeMyTrip Limited |
| Sector: Services & Goods | |
| SubSector: General Entertainment | |
| MarketCap: 1429.59 Millions | |
| Recent Price: 100.86 Market Intelligence Score: 80 | |
| Day Percent Change: -1.39% Day Change: -1.42 | |
| Week Change: 6.93% Year-to-date Change: -10.2% | |
| MMYT Links: Profile News Message Board | |
| Charts:- Daily , Weekly | |
| Add MMYT to Watchlist: View: Get Complete MMYT Trend Analysis ➞ | |
 | MSC Studio City International Holdings Limited |
| Sector: Services & Goods | |
| SubSector: Resorts & Casinos | |
| MarketCap: 1420.54 Millions | |
| Recent Price: 4.81 Market Intelligence Score: 40 | |
| Day Percent Change: -4.75% Day Change: -0.24 | |
| Week Change: 3.44% Year-to-date Change: -14.9% | |
| MSC Links: Profile News Message Board | |
| Charts:- Daily , Weekly | |
| Add MSC to Watchlist: View: Get Complete MSC Trend Analysis ➞ | |
 | HSAI Hesai Group |
| Sector: Services & Goods | |
| SubSector: Auto Parts | |
| MarketCap: 1330 Millions | |
| Recent Price: 23.06 Market Intelligence Score: 61 | |
| Day Percent Change: -11% Day Change: -2.85 | |
| Week Change: -1.11% Year-to-date Change: 66.9% | |
| HSAI Links: Profile News Message Board | |
| Charts:- Daily , Weekly | |
| Add HSAI to Watchlist: View: Get Complete HSAI Trend Analysis ➞ | |
 | HKD AMTD Digital Inc. |
| Sector: Technology | |
| SubSector: Software - Application | |
| MarketCap: 1200 Millions | |
| Recent Price: 1.59 Market Intelligence Score: 26 | |
| Day Percent Change: 0% Day Change: 0 | |
| Week Change: -3.05% Year-to-date Change: -46.3% | |
| HKD Links: Profile News Message Board | |
| Charts:- Daily , Weekly | |
| Add HKD to Watchlist: View: Get Complete HKD Trend Analysis ➞ | |
 | GHG GreenTree Hospitality Group Ltd. |
| Sector: Services & Goods | |
| SubSector: Lodging | |
| MarketCap: 1195.36 Millions | |
| Recent Price: 2.13 Market Intelligence Score: 30 | |
| Day Percent Change: 0% Day Change: 0 | |
| Week Change: -4.05% Year-to-date Change: -16.8% | |
| GHG Links: Profile News Message Board | |
| Charts:- Daily , Weekly | |
| Add GHG to Watchlist: View: Get Complete GHG Trend Analysis ➞ | |
 | SIMO Silicon Motion Technology Corporation |
| Sector: Technology | |
| SubSector: Diversified Electronics | |
| MarketCap: 1186.66 Millions | |
| Recent Price: 74.20 Market Intelligence Score: 80 | |
| Day Percent Change: 0.08% Day Change: 0.06 | |
| Week Change: -1.7% Year-to-date Change: 40.8% | |
| SIMO Links: Profile News Message Board | |
| Charts:- Daily , Weekly | |
| Add SIMO to Watchlist: View: Get Complete SIMO Trend Analysis ➞ | |
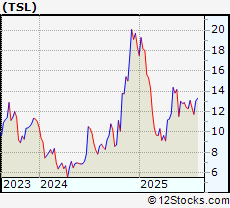 | TSL Trina Solar Limited |
| Sector: Technology | |
| SubSector: Semiconductor - Specialized | |
| MarketCap: 1066.99 Millions | |
| Recent Price: 12.55 Market Intelligence Score: 80 | |
| Day Percent Change: -1.34% Day Change: -0.17 | |
| Week Change: -5.78% Year-to-date Change: -30.6% | |
| TSL Links: Profile News Message Board | |
| Charts:- Daily , Weekly | |
| Add TSL to Watchlist: View: Get Complete TSL Trend Analysis ➞ | |
 | TUYA Tuya Inc. |
| Sector: Technology | |
| SubSector: Software - Infrastructure | |
| MarketCap: 1050 Millions | |
| Recent Price: 2.39 Market Intelligence Score: 80 | |
| Day Percent Change: 3.02% Day Change: 0.07 | |
| Week Change: -1.24% Year-to-date Change: 35.2% | |
| TUYA Links: Profile News Message Board | |
| Charts:- Daily , Weekly | |
| Add TUYA to Watchlist: View: Get Complete TUYA Trend Analysis ➞ | |
 | SY So-Young International Inc. |
| Sector: Technology | |
| SubSector: Healthcare Information Services | |
| MarketCap: 1000.55 Millions | |
| Recent Price: 3.89 Market Intelligence Score: 30 | |
| Day Percent Change: -4.19% Day Change: -0.17 | |
| Week Change: -19.63% Year-to-date Change: 384.7% | |
| SY Links: Profile News Message Board | |
| Charts:- Daily , Weekly | |
| Add SY to Watchlist: View: Get Complete SY Trend Analysis ➞ | |
 | QFIN 360 Finance, Inc. |
| Sector: Financials | |
| SubSector: Credit Services | |
| MarketCap: 956.208 Millions | |
| Recent Price: 30.67 Market Intelligence Score: 40 | |
| Day Percent Change: 3.34% Day Change: 0.99 | |
| Week Change: -7.9% Year-to-date Change: -18.6% | |
| QFIN Links: Profile News Message Board | |
| Charts:- Daily , Weekly | |
| Add QFIN to Watchlist: View: Get Complete QFIN Trend Analysis ➞ | |
 | CANG Cango Inc. |
| Sector: Technology | |
| SubSector: Internet Information Providers | |
| MarketCap: 947.48 Millions | |
| Recent Price: 4.69 Market Intelligence Score: 70 | |
| Day Percent Change: 2.18% Day Change: 0.1 | |
| Week Change: -2.9% Year-to-date Change: 6.6% | |
| CANG Links: Profile News Message Board | |
| Charts:- Daily , Weekly | |
| Add CANG to Watchlist: View: Get Complete CANG Trend Analysis ➞ | |
 | WDH Waterdrop Inc. |
| Sector: Financials | |
| SubSector: Insurance - Diversified | |
| MarketCap: 874 Millions | |
| Recent Price: 1.77 Market Intelligence Score: 80 | |
| Day Percent Change: -0.56% Day Change: -0.01 | |
| Week Change: -1.67% Year-to-date Change: 51.9% | |
| WDH Links: Profile News Message Board | |
| Charts:- Daily , Weekly | |
| Add WDH to Watchlist: View: Get Complete WDH Trend Analysis ➞ | |
 | GGR Gogoro Inc. |
| Sector: Services & Goods | |
| SubSector: Auto Parts | |
| MarketCap: 856 Millions | |
| Recent Price: 0.33 Market Intelligence Score: 80 | |
| Day Percent Change: -0.78% Day Change: 0 | |
| Week Change: -5.03% Year-to-date Change: -33.5% | |
| GGR Links: Profile News Message Board | |
| Charts:- Daily , Weekly | |
| Add GGR to Watchlist: View: Get Complete GGR Trend Analysis ➞ | |
 | BEDU Bright Scholar Education Holdings Limited |
| Sector: Services & Goods | |
| SubSector: Education & Training Services | |
| MarketCap: 792.406 Millions | |
| Recent Price: 1.74 Market Intelligence Score: 90 | |
| Day Percent Change: 0% Day Change: -9997.26 | |
| Week Change: -0.29% Year-to-date Change: 0.9% | |
| BEDU Links: Profile News Message Board | |
| Charts:- Daily , Weekly | |
| Add BEDU to Watchlist: View: Get Complete BEDU Trend Analysis ➞ | |
 | DUO Fangdd Network Group Ltd. |
| Sector: Financials | |
| SubSector: Property Management | |
| MarketCap: 783.142 Millions | |
| Recent Price: 1.36 Market Intelligence Score: 50 | |
| Day Percent Change: 3.41% Day Change: 0.04 | |
| Week Change: -17.58% Year-to-date Change: -85.8% | |
| DUO Links: Profile News Message Board | |
| Charts:- Daily , Weekly | |
| Add DUO to Watchlist: View: Get Complete DUO Trend Analysis ➞ | |
 | YJ Yunji Inc. |
| Sector: Services & Goods | |
| SubSector: Specialty Retail, Other | |
| MarketCap: 770.644 Millions | |
| Recent Price: 1.71 Market Intelligence Score: 20 | |
| Day Percent Change: 0% Day Change: 0 | |
| Week Change: -2.29% Year-to-date Change: 6.2% | |
| YJ Links: Profile News Message Board | |
| Charts:- Daily , Weekly | |
| Add YJ to Watchlist: View: Get Complete YJ Trend Analysis ➞ | |
 | SFWL Shengfeng Development Limited |
| Sector: Industrials | |
| SubSector: Integrated Freight & Logistics | |
| MarketCap: 747 Millions | |
| Recent Price: 1.04 Market Intelligence Score: 59 | |
| Day Percent Change: 2.94% Day Change: 0.03 | |
| Week Change: 0.94% Year-to-date Change: -3.7% | |
| SFWL Links: Profile News Message Board | |
| Charts:- Daily , Weekly | |
| Add SFWL to Watchlist: View: Get Complete SFWL Trend Analysis ➞ | |
 | ZH Zhihu Inc. |
| Sector: Services & Goods | |
| SubSector: Internet Content & Information | |
| MarketCap: 741 Millions | |
| Recent Price: 4.96 Market Intelligence Score: 60 | |
| Day Percent Change: 1.43% Day Change: 0.07 | |
| Week Change: 18.1% Year-to-date Change: 40.1% | |
| ZH Links: Profile News Message Board | |
| Charts:- Daily , Weekly | |
| Add ZH to Watchlist: View: Get Complete ZH Trend Analysis ➞ | |
 | LANV Lanvin Group Holdings Limited |
| Sector: Services & Goods | |
| SubSector: Luxury Goods | |
| MarketCap: 712 Millions | |
| Recent Price: 2.08 Market Intelligence Score: 10 | |
| Day Percent Change: -5.02% Day Change: -0.11 | |
| Week Change: -10.73% Year-to-date Change: 3.5% | |
| LANV Links: Profile News Message Board | |
| Charts:- Daily , Weekly | |
| Add LANV to Watchlist: View: Get Complete LANV Trend Analysis ➞ | |
 | DDL Dingdong (Cayman) Limited |
| Sector: Consumer Staples | |
| SubSector: Grocery Stores | |
| MarketCap: 708 Millions | |
| Recent Price: 2.21 Market Intelligence Score: 50 | |
| Day Percent Change: -4.74% Day Change: -0.11 | |
| Week Change: -3.07% Year-to-date Change: -32.6% | |
| DDL Links: Profile News Message Board | |
| Charts:- Daily , Weekly | |
| Add DDL to Watchlist: View: Get Complete DDL Trend Analysis ➞ | |
 | RERE ATRenew Inc. |
| Sector: Services & Goods | |
| SubSector: Internet Retail | |
| MarketCap: 672 Millions | |
| Recent Price: 4.65 Market Intelligence Score: 60 | |
| Day Percent Change: 1.97% Day Change: 0.09 | |
| Week Change: 9.67% Year-to-date Change: 61.5% | |
| RERE Links: Profile News Message Board | |
| Charts:- Daily , Weekly | |
| Add RERE to Watchlist: View: Get Complete RERE Trend Analysis ➞ | |
 | DQ Daqo New Energy Corp. |
| Sector: Technology | |
| SubSector: Semiconductor Equipment & Materials | |
| MarketCap: 660.918 Millions | |
| Recent Price: 22.47 Market Intelligence Score: 70 | |
| Day Percent Change: -1.58% Day Change: -0.36 | |
| Week Change: 5.69% Year-to-date Change: 15.6% | |
| DQ Links: Profile News Message Board | |
| Charts:- Daily , Weekly | |
| Add DQ to Watchlist: View: Get Complete DQ Trend Analysis ➞ | |
 | IMOS ChipMOS TECHNOLOGIES INC. |
| Sector: Technology | |
| SubSector: Semiconductor Equipment & Materials | |
| MarketCap: 658.918 Millions | |
| Recent Price: 15.25 Market Intelligence Score: 40 | |
| Day Percent Change: 0.59% Day Change: 0.09 | |
| Week Change: -7.01% Year-to-date Change: -15.5% | |
| IMOS Links: Profile News Message Board | |
| Charts:- Daily , Weekly | |
| Add IMOS to Watchlist: View: Get Complete IMOS Trend Analysis ➞ | |
 | COE China Online Education Group |
| Sector: Services & Goods | |
| SubSector: Education & Training Services | |
| MarketCap: 643.406 Millions | |
| Recent Price: 35.36 Market Intelligence Score: 70 | |
| Day Percent Change: 0.65% Day Change: 0.23 | |
| Week Change: 9.58% Year-to-date Change: 72.5% | |
| COE Links: Profile News Message Board | |
| Charts:- Daily , Weekly | |
| Add COE to Watchlist: View: Get Complete COE Trend Analysis ➞ | |
 | JKS JinkoSolar Holding Co., Ltd. |
| Sector: Technology | |
| SubSector: Semiconductor - Specialized | |
| MarketCap: 629.36 Millions | |
| Recent Price: 22.60 Market Intelligence Score: 80 | |
| Day Percent Change: -4.12% Day Change: -0.97 | |
| Week Change: 4.05% Year-to-date Change: -3.4% | |
| JKS Links: Profile News Message Board | |
| Charts:- Daily , Weekly | |
| Add JKS to Watchlist: View: Get Complete JKS Trend Analysis ➞ | |
| To view more stocks, click on Next / Previous arrows or select different range: 0 - 25 , 25 - 50 , 50 - 75 , 75 - 100 , 100 - 125 , 125 - 150 , 150 - 175 , 175 - 200 | ||
| Click To Change The Sort Order: By Market Cap or Company Size Performance: Year-to-date, Week and Day | |
| Select Chart Type: | ||
|
Best Stocks Today 12Stocks.com |
© 2025 12Stocks.com Terms & Conditions Privacy Contact Us
All Information Provided Only For Education And Not To Be Used For Investing or Trading. See Terms & Conditions


One More Thing ... Get Best Stocks Delivered Daily!
Never Ever Miss A Move With Our Top Ten Stocks Lists
Find Best Stocks In Any Market - Bull or Bear Market
Take A Peek At Our Top Ten Stocks Lists: Daily, Weekly, Year-to-Date & Top Trends
Find Best Stocks In Any Market - Bull or Bear Market
Take A Peek At Our Top Ten Stocks Lists: Daily, Weekly, Year-to-Date & Top Trends
Asia Stocks With Best Up Trends [0-bearish to 100-bullish]: XPeng [100], NIO [100], MINISO [100], Pinduoduo [100], Huazhu [100], iQIYI [100], Melco Resorts[100], Toyota Motor[100], ORIX [100], Honda Motor[100], Full Truck[90]
Best Asia Stocks Year-to-Date:
Regencell Bioscience[9561.54%], I Mab[454.12%], So-Young [384.74%], QuantaSing [269.91%], Xunlei [264.32%], OneConnect Financial[205.35%], Sify [187.76%], Niu [159.78%], Viomi [154.48%], Yatsen Holding[141.21%], Tencent Music[120.18%] Best Asia Stocks This Week:
Xunlei [43.56%], Burning Rock[41.87%], NIO [24.49%], iQIYI [23.04%], Zhihu [18.1%], XPeng [17.39%], Smart Share[14.53%], Cheetah Mobile[13.59%], MINISO [13.58%], QuantaSing [13.01%], Full Truck[12.26%] Best Asia Stocks Daily:
X Financial[15.73%], XPeng [11.68%], Full Truck[9.81%], Viomi [9.39%], NIO [9.27%], CNFinance [7.77%], Lixiang Education[7.32%], Kanzhun [6.61%], MINISO [6.38%], Burning Rock[6.02%], FinVolution [5.55%]