


On This Page ...
Asia-Pacific ETFs
Performance & Trends
Top Asia-Pacific ETFs
Investing with Asia-Pacific ETFs
Detailed View: Asia-Pacific ETF Lists, Charts & More
Stock Holdings in Asia-Pacific ETFs
 Asia-Pacific ETFs SlideShow Here Asia-Pacific ETFs SlideShow Here |
 Daily Weekly Year-To-Date Top Trends Daily Weekly Year-To-Date Top Trends |
 |
| Top Dow Stocks |
| Best Nasdaq Stocks |
| Best SmallCap Stocks |
| Top Sectors |
| Best China Stocks |

Best Asia-Pacific Exchange Traded Funds (ETFs)
| ||||||||||||||||||
| Detailed View: Best Asia-Pacific ETFs by Daily, Weekly, Year-to-date and Trends | ||||||||||||||||||
| Quickly Browse, Sort and Filter to Find Best Asia-Pacific ETFs Using Our Slide Show Tool | ||||||||||||||||||
| Asia-Pacific ETF Segment in Brief | ||||||||||||||||||
| Year-to-date Asia-Pacific segment is outperforming market by 12.0126%. | ||||||||||||||||||
 |
||||||||||||||||||
| Year To Date Performance: 23.2072 % | ||||||||||||||||||
| Weekly Performance: 0.637681 % | ||||||||||||||||||
| Daily Performance: 0.61 % | ||||||||||||||||||
|
Asia-Pacific Segment Short Term Technical Trend Score: 80 Trend Score : 0(bearish) to 100(bullish). Updated daily. Not to be used for investing. |
||||||||||||||||||

| 12Stocks.com: Asia-Pacific ETF Sector - Look at Big Picture | |
 |
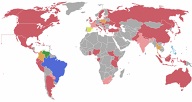
Let's take comprehensive view of Asia-Pacific segment. The Asia-Pacific segment of the Global Stock Market is best represented by VPL - exchange traded fund that tracks FTSE Developed Asia Pacific Index. It consists of top stocks
- from all major sectors - and is primarily Asia-Pacific region based. The Asia-Pacific sector contains stocks like China Mobile and Toyota. Year to date, Asia-Pacific sector as represented by VPL is up by 23.2072% and is currently outperforming the market (S&P 500) by 12.0126%. Next, let us look at relative performance of Asia-Pacific segment as represented by S&P Asia-Pacific 350 versus other major market segments like US stock indexes (Nasdaq 100, Dow 30, S&P 500, S&P 400 Midcap & Total Stock Market Index), emerging markets and other asset classes like bonds, gold and oil. The performances of major market segments year to date are - Gold [34.8912%], US Pacific [23.2072%], Emerging Markets [21.9798%], Euro [14.9435%], US Pacific [11.3706%], US Total Market [11.1946%], US Mid Cap [6.69524%], Bonds [5.5936%], India [0%], Oil [-5.5895%], US Dollar [-7.65083%], . Now, we dive deep to identify investing opportunities both with ETFs that track Asia-Pacific segment of the stock market and Asia-Pacific stock holdings contained within these ETF baskets. Check daily for updates. Scroll down this guide or just click the links below - |
 |
|
| Asia-Pacific ETFs | |
| SEGMENT | |
| PERFORMANCE | |
|
23.2072% (YEAR-TO-DATE) |
|
|
0.637681% (WEEKLY) |
|
|
0.61% (DAILY) |
|
| 12Stocks.com: Quick View of Technicals of Overall Asia-Pacific Sector | |
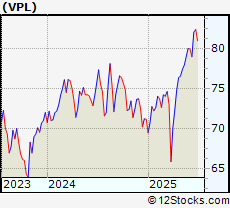
| VPL : Invests to track index of 400 equities from Australia, Japan, Hong Kong, New Zealand and Singapore | |
 |
 |
| Weekly Chart | Daily Chart (Short Term) |
| Weekly: 0.637681% | Daily: 0.61% |
| Year-to-date Performance : 23.2072% | Relative Performance: The Asia-Pacific Index is outperforming the market (S&P 500) by 12.0126% |
| 12Stocks.com: Top Performing Asia-Pacific ETFs | |
|
|
Most popular Asia-Pacific exchange traded funds track the broad Asia-Pacific sector. But there are ETF funds that track specific sub-sectors within the wide Asia-Pacific sector. For instance, most Asia-Pacific ETFs focus on broad market but there are ETFs that focus on smallcap segment. The top performing ETFs (year-to-date) that track the whole Asia-Pacific segment are shown in left side bar. The popular Asia-Pacific ETFs with Best YTD Performances: iShares South Korea [44.0336%], Japan Small Cap Fund [39.9121%], iShares Singapore [33.5537%], iShares Hong Kong [31.9454%], iShares China 25 [30.1439%], Vanguard Pacific Stock VIPERs [23.2072%], iShares Emerging Mkts [21.9798%], iShares Japan [19.1182%], Vanguard Emerging Markets VIPERs [18.7964%], iShares Taiwan [17.277%], iShares Australia [14.3554%]. Also, there are leveraged ETFs that given enhanced performance by moving twice or thrice the daily movement of Asia-Pacific sector Ultra China [56.8312%], TripleBull Emerging Markets [55.5249%], Ultra Emerging Mkts [38.4751%], Ultra Japan [31.3802%], Double Bull India [-9.48193%]. Finally, there are inverse or bearish Asia-Pacific ETFs that move in opposite direction to the daily movement of the Asia-Pacific segment Short MSCI Emerging Markets [-16.0528%], UltraShort MSCI Japan [-30.9766%], UltraShort MSCI Emerging Markets [-32.744%], TripleShort Emerging Markets [-46.8836%], UltraShort FTSE/Xinhua China 25 [-47.5262%]. Now, more recently, over last week, the top performing Asia-Pacific ETFs that track the whole segment on the move are - India ETN [7.6594%], BRIC ADRs/GDRs [7.6594%], Japan SmlCap CF [2.97505%], China CF [2.37443%], Singapore [2.29473%], China150 [2.1579%], China [1.77917%], Korea [1.60066%], Emerging Mkts [1.08195%] . |
|
LEADING Asia-Pacific ETFs (YEAR-TO-DATE) |
|
| iShares South Korea : 44.0336% | |
| Japan Small Cap Fund: 39.9121% | |
| Templeton Dragon Fund: 36.4959% | |
| iShares Singapore : 33.5537% | |
| SPDR S&P China: 32.2633% | |
| iShares Hong Kong : 31.9454% | |
| iShares China 25: 30.1439% | |
| Templeton Emerging Markets: 28.2373% | |
| Vanguard Pacific Stock VIPERs: 23.2072% | |
| iShares Emerging Mkts : 21.9798% | |
|
For Complete List of Winners and Laggards from Asia-Pacific ETF
Segment
| |

| 12Stocks.com: Investing With Asia-Pacific ETFs | |
|
The following table helps investors and traders sort through current performance of various
Asia-Pacific ETFs. One can glean long and short term trends by sorting Asia-Pacific ETF list by performance over daily, weekly or year-to-date periods. |
12Stocks.com Performance of Asia-Pacific ETFs
| Ticker | Stock Name | Watchlist | Category | Recent Price | Change % | Weekly Change% | YTD Change% |
| FXI | iShares China 25 |   | Pacific | 38.90 | 1.49 | 1.77917 | 30.1439% |
| EEM | iShares Emerging Mkts | | Emerging Markets | 50.45 | 1.20 | 1.08195 | 21.9798% |
| INP | iPath India Index ETN | | Pacific | 52.85 | 0.13 | 7.6594 | 0% |
| EEB | Claymore BNY BRIC | | Emerging Markets | 52.85 | 0.13 | 7.6594 | 0% |
| EPI | Wisdom Tree India Earnings Fund | | Pacific | 44.38 | -0.20 | -0.15748 | -3.12159% |
| EWT | iShares Taiwan | | Pacific | 60.21 | 1.53 | 0.736155 | 17.277% |
| GIM | Templeton Global Income | | Emerging Markets | 18.27 | 1.22 | 374.545 | 0% |
| VWO | Vanguard Emerging Markets VIPERs | | Emerging Markets | 51.97 | 1.15 | 0.93222 | 18.7964% |
| HAO | China Smallcap | | Pacific | 1.14 | 0.88 | -4.68227 | -67.842% |
| EWH | iShares Hong Kong | | Pacific | 21.18 | 0.86 | -0.141443 | 31.9454% |
| EWS | iShares Singapore | | Pacific | 28.53 | 0.85 | 2.29473 | 33.5537% |
| EWY | iShares South Korea | | Pacific | 73.63 | 0.77 | 1.60066 | 44.0336% |
| VPL | Vanguard Pacific Stock VIPERs | | Pacific | 86.80 | 0.61 | 0.637681 | 23.2072% |
| EWJ | iShares Japan | | Pacific | 79.18 | 0.57 | 0.699479 | 19.1182% |
| JOF | Japan Small Cap Fund | | Pacific | 10.73 | 0.28 | 2.97505 | 39.9121% |
| EWM | iShares Malaysia | | Pacific | 25.03 | 0.24 | -0.0798403 | 2.87711% |
| EWA | iShares Australia | | Pacific | 26.93 | 0.11 | -0.259259 | 14.3554% |
| FNI | FirstTrust Chindia ETF | | Emerging Markets | 43.54 | 0.00 | 0 | 0% |
| IFN | India Closed-End ETF Fund | | Pacific | 14.98 | -0.07 | -0.991408 | -1.41364% |
| PIN | PowerShares India Portfolio | | Pacific | 25.36 | -0.39 | -0.373281 | -3.00306% |
| GXC | SPDR S&P China | | Pacific | 98.47 | 1.89 | 2.1579 | 32.2633% |
| GMF | SPDR S&P Emerging Asia Pacific | | Pacific | 132.53 | 1.25 | 0.735775 | 14.8142% |
| TDF | Templeton Dragon Fund | | Pacific | 11.21 | 0.99 | 2.37443 | 36.4959% |
| EMF | Templeton Emerging Markets | | Emerging Markets | 15.35 | 0.92 | -0.389358 | 28.2373% |
| GAF | SPDR S&P Emerging Middle East & Africa | | Emerging Markets | 9.77 | 0.31 | -11.7435 | 0% |
 | Showing 0 to 25 ETFs. Click on arrows to view more! Sort by performace by clicking on Daily, Weekly or YTD % Change |  | |||||
| 12Stocks.com: Euro Currency | |
| Investors using Asia-Pacific ETFs have to also deal with currency movements versus US dollar. Unless the ETF is hedged for Asia-Pacific currency exposure, traders will have to take into account the performance of Asia-Pacific currencies. |
12Stocks.com Performance of Asia-Pacific Currencies
| Ticker | ETF Name | Watchlist | Category | Recent Price | Change % | Weekly Change% | YTD Change% |
| YCL | Ultra Yen | | Pacific | 21.98 | 1.46 | 0.0692168 | 9.05806% |
| FXA | Australian Dollar | | Pacific | 64.83 | 0.53 | 0.586483 | 6.37739% |
| CYB | Chinese Yuan | | Pacific | 11.27 | 3.68 | -53.5591 | 0% |
| ICN | Indian Rupee | | Pacific | 11.27 | 3.68 | -59.8932 | 0% |
| YCS | UltraShort Yen | | Pacific | 44.00 | -1.22 | 0.326037 | -8.11652% |
| INR | Indian Rupee | | Pacific | 14.11 | -3.36 | -3.68601 | -33.0327% |
| 12Stocks.com: Trading With Bullish (Leveraged) Asia-Pacific ETFs | |
| Traders and speculators can enhance their performances by trading leveraged ETFs that double or triple the daily returns of Asia-Pacific indexes. Also, listed below are leveraged ETFs that have exposure to Asia-Pacific economy. |
12Stocks.com Performance of Bullish (Leveraged) Asia-Pacific ETFs
| Ticker | ETF Name | Watchlist | Category | Recent Price | Change % | Weekly Change% | YTD Change% |
| XPP | Ultra China | | Pacific | 27.45 | 2.04 | 2.7255 | 56.8312% |
| EDC | TripleBull Emerging Markets | | Emerging Markets | 43.60 | 3.78 | 3.09766 | 55.5249% |
| EET | Ultra Emerging Mkts | | Emerging Markets | 69.03 | 2.29 | 1.85665 | 38.4751% |
| EZJ | Ultra Japan | | Pacific | 47.81 | 1.03 | 1.18425 | 31.3802% |
| INDL | Double Bull India | | Pacific | 55.23 | -0.53 | -1.04677 | -9.48193% |
| 12Stocks.com: Trading With Bearish (& Leveraged) Asia-Pacific ETFs | |
| Traders and speculators can hedge or take advantage of market pullbacks by betting on bearish (inverse) ETFs that move in opposite direction to underlying index. Asia-Pacific traders can enhance their performances by trading leveraged bearish ETFs that double or triple inverse the daily returns of Asia-Pacific indexes. Also, listed below are ETFs that have exposure to Asia-Pacific economy. |
12Stocks.com Performance of Bearish (Leveraged) Asia-Pacific ETFs
| Ticker | ETF Name | Watchlist | Category | Recent Price | Change % | Weekly Change% | YTD Change% |
| EUM | Short MSCI Emerging Markets | | Emerging Markets | 22.27 | -1.08 | -0.713375 | -16.0528% |
| EWV | UltraShort MSCI Japan | | Pacific | 28.74 | -0.97 | -1.01825 | -30.9766% |
| EEV | UltraShort MSCI Emerging Markets | | Emerging Markets | 11.55 | -2.42 | -1.87166 | -32.744% |
| EDZ | TripleShort Emerging Markets | | Emerging Markets | 4.78 | -3.82 | -3.0426 | -46.8836% |
| FXP | UltraShort FTSE/Xinhua China 25 | | Pacific | 9.36 | -2.59 | -3.05516 | -47.5262% |
| Charts, Fundamental Data and Performances of ETFs | ||
| Click on following links to sort by: Market Cap or Company Size Performance: Year-to-date, Week and Day | |
| To view more ETFs click on next and previous arrows | ||
 | FXI iShares China 25 |
| Description: Invests in 25 largest and most liquid Chinese companies | |
| Sector: Pacific | |
| Sub-Sector: China | |
| Recent Price: 38.90 | |
| Day Percent Change: 1.49% Day Change: 0.57 | |
| Week Change: 1.77917% Year-to-date Change: 30.1% | |
| FXI Links: Profile News Message Board | |
| Charts:- Daily , Weekly | |
| Save FXI for Review: | |
 | EEM iShares Emerging Mkts |
| Description: Invests in leading companies from emerging markets like Latin America and Asia [Korea, Taiwan, etc] | |
| Sector: Emerging Markets | |
| Sub-Sector: Emerging Markets | |
| Recent Price: 50.45 | |
| Day Percent Change: 1.20% Day Change: 0.60 | |
| Week Change: 1.08195% Year-to-date Change: 22.0% | |
| EEM Links: Profile News Message Board | |
| Charts:- Daily , Weekly | |
| Save EEM for Review: | |
 | INP iPath India Index ETN |
| Description: To track MSCI India Total Return Index designed to measure the market performance of Indian equity securities | |
| Sector: Pacific | |
| Sub-Sector: India | |
| Recent Price: 52.85 | |
| Day Percent Change: 0.13% Day Change: 0.07 | |
| Week Change: 7.6594% Year-to-date Change: 0.0% | |
| INP Links: Profile News Message Board | |
| Charts:- Daily , Weekly | |
| Save INP for Review: | |
 | EEB Claymore BNY BRIC |
| Description: Based on BNY BRIC Index comprised ADRs & GDRs of companies from Brazil, Russia, India and China currently trading on U.S. exchanges | |
| Sector: Emerging Markets | |
| Sub-Sector: Emerging Markets | |
| Recent Price: 52.85 | |
| Day Percent Change: 0.13% Day Change: 0.07 | |
| Week Change: 7.6594% Year-to-date Change: 0.0% | |
| EEB Links: Profile News Message Board | |
| Charts:- Daily , Weekly | |
| Save EEB for Review: | |
 | EPI Wisdom Tree India Earnings Fund |
| Description: Tracks an earnings-weighted index of 150 Indian companies | |
| Sector: Pacific | |
| Sub-Sector: India | |
| Recent Price: 44.38 | |
| Day Percent Change: -0.20% Day Change: -0.09 | |
| Week Change: -0.15748% Year-to-date Change: -3.1% | |
| EPI Links: Profile News Message Board | |
| Charts:- Daily , Weekly | |
| Save EPI for Review: | |
 | EWT iShares Taiwan |
| Description: Invests in large cap companies traded primarily on Taiwan stock exchange & tracks MSCI Taiwan index | |
| Sector: Pacific | |
| Sub-Sector: Taiwan | |
| Recent Price: 60.21 | |
| Day Percent Change: 1.53% Day Change: 0.91 | |
| Week Change: 0.736155% Year-to-date Change: 17.3% | |
| EWT Links: Profile News Message Board | |
| Charts:- Daily , Weekly | |
| Save EWT for Review: | |
 | GIM Templeton Global Income |
| Description: Fixed income from Asia, Europe, Latin America and Middle East | |
| Sector: Emerging Markets | |
| Sub-Sector: Emerging Markets | |
| Recent Price: 18.27 | |
| Day Percent Change: 1.22% Day Change: 0.22 | |
| Week Change: 374.545% Year-to-date Change: 0.0% | |
| GIM Links: Profile News Message Board | |
| Charts:- Daily , Weekly | |
| Save GIM for Review: | |
 | VWO Vanguard Emerging Markets VIPERs |
| Description: Invests to track index of 500 equities from all across worlds emerging markets | |
| Sector: Emerging Markets | |
| Sub-Sector: Emerging Markets | |
| Recent Price: 51.97 | |
| Day Percent Change: 1.15% Day Change: 0.59 | |
| Week Change: 0.93222% Year-to-date Change: 18.8% | |
| VWO Links: Profile News Message Board | |
| Charts:- Daily , Weekly | |
| Save VWO for Review: | |
 | HAO China Smallcap |
| Description: Invests in small cap value companies traded primarily on China market index | |
| Sector: Pacific | |
| Sub-Sector: China | |
| Recent Price: 1.14 | |
| Day Percent Change: 0.88% Day Change: 0.01 | |
| Week Change: -4.68227% Year-to-date Change: -67.8% | |
| HAO Links: Profile News Message Board | |
| Charts:- Daily , Weekly | |
| Save HAO for Review: | |
 | EWH iShares Hong Kong |
| Description: Invests in large cap companies traded primarily on HongKong stock exchange & tracks MSCI Hong Kong index | |
| Sector: Pacific | |
| Sub-Sector: China | |
| Recent Price: 21.18 | |
| Day Percent Change: 0.86% Day Change: 0.18 | |
| Week Change: -0.141443% Year-to-date Change: 31.9% | |
| EWH Links: Profile News Message Board | |
| Charts:- Daily , Weekly | |
| Save EWH for Review: | |
 | EWS iShares Singapore |
| Description: Invests in large cap value companies traded primarily on Singapore stock exchange & tracks MSCI Singapore index | |
| Sector: Pacific | |
| Sub-Sector: Singapore | |
| Recent Price: 28.53 | |
| Day Percent Change: 0.85% Day Change: 0.24 | |
| Week Change: 2.29473% Year-to-date Change: 33.6% | |
| EWS Links: Profile News Message Board | |
| Charts:- Daily , Weekly | |
| Save EWS for Review: | |
 | EWY iShares South Korea |
| Description: Invests in large cap value companies traded primarily on Seoul stock exchange & tracks MSCI South Korea index | |
| Sector: Pacific | |
| Sub-Sector: Korea | |
| Recent Price: 73.63 | |
| Day Percent Change: 0.77% Day Change: 0.56 | |
| Week Change: 1.60066% Year-to-date Change: 44.0% | |
| EWY Links: Profile News Message Board | |
| Charts:- Daily , Weekly | |
| Save EWY for Review: | |
 | VPL Vanguard Pacific Stock VIPERs |
| Description: Invests to track index of 400 equities from Australia, Japan, Hong Kong, New Zealand and Singapore | |
| Sector: Pacific | |
| Sub-Sector: Pacific | |
| Recent Price: 86.80 | |
| Day Percent Change: 0.61% Day Change: 0.53 | |
| Week Change: 0.637681% Year-to-date Change: 23.2% | |
| VPL Links: Profile News Message Board | |
| Charts:- Daily , Weekly | |
| Save VPL for Review: | |
 | EWJ iShares Japan |
| Description: Invests in large cap companies traded primarily on Tokyo stock exchange & tracks MSCI Japan index | |
| Sector: Pacific | |
| Sub-Sector: Japan | |
| Recent Price: 79.18 | |
| Day Percent Change: 0.57% Day Change: 0.45 | |
| Week Change: 0.699479% Year-to-date Change: 19.1% | |
| EWJ Links: Profile News Message Board | |
| Charts:- Daily , Weekly | |
| Save EWJ for Review: | |
 | JOF Japan Small Cap Fund |
| Description: Invests in equities from Japanese OTC market | |
| Sector: Pacific | |
| Sub-Sector: Japan | |
| Recent Price: 10.73 | |
| Day Percent Change: 0.28% Day Change: 0.03 | |
| Week Change: 2.97505% Year-to-date Change: 39.9% | |
| JOF Links: Profile News Message Board | |
| Charts:- Daily , Weekly | |
| Save JOF for Review: | |
 | EWM iShares Malaysia |
| Description: Invests in large cap value companies traded primarily on Kuala Lampur stock exchange & tracks MSCI Malaysia index | |
| Sector: Pacific | |
| Sub-Sector: Malaysia | |
| Recent Price: 25.03 | |
| Day Percent Change: 0.24% Day Change: 0.06 | |
| Week Change: -0.0798403% Year-to-date Change: 2.9% | |
| EWM Links: Profile News Message Board | |
| Charts:- Daily , Weekly | |
| Save EWM for Review: | |
 | EWA iShares Australia |
| Description: Invests in large cap companies traded in Australian stock exchange & tracks MSCI Australia index | |
| Sector: Pacific | |
| Sub-Sector: Australia | |
| Recent Price: 26.93 | |
| Day Percent Change: 0.11% Day Change: 0.03 | |
| Week Change: -0.259259% Year-to-date Change: 14.4% | |
| EWA Links: Profile News Message Board | |
| Charts:- Daily , Weekly | |
| Save EWA for Review: | |
 | FNI FirstTrust Chindia ETF |
| Description: Tracks a combination of Chinese & Indian equities | |
| Sector: Emerging Markets | |
| Sub-Sector: Emerging Markets | |
| Recent Price: 43.54 | |
| Day Percent Change: 0.00% Day Change: 0.00 | |
| Week Change: 0% Year-to-date Change: 0.0% | |
| FNI Links: Profile News Message Board | |
| Charts:- Daily , Weekly | |
| Save FNI for Review: | |
 | IFN India Closed-End ETF Fund |
| Description: Invests in leading companies from India | |
| Sector: Pacific | |
| Sub-Sector: India | |
| Recent Price: 14.98 | |
| Day Percent Change: -0.07% Day Change: -0.01 | |
| Week Change: -0.991408% Year-to-date Change: -1.4% | |
| IFN Links: Profile News Message Board | |
| Charts:- Daily , Weekly | |
| Save IFN for Review: | |
 | PIN PowerShares India Portfolio |
| Description: Tracks the Indus India Index of 50 companies | |
| Sector: Pacific | |
| Sub-Sector: India | |
| Recent Price: 25.36 | |
| Day Percent Change: -0.39% Day Change: -0.10 | |
| Week Change: -0.373281% Year-to-date Change: -3.0% | |
| PIN Links: Profile News Message Board | |
| Charts:- Daily , Weekly | |
| Save PIN for Review: | |
 | GXC SPDR S&P China |
| Description: Tracks index containing basket of 150 companies from China | |
| Sector: Pacific | |
| Sub-Sector: China | |
| Recent Price: 98.47 | |
| Day Percent Change: 1.89% Day Change: 1.83 | |
| Week Change: 2.1579% Year-to-date Change: 32.3% | |
| GXC Links: Profile News Message Board | |
| Charts:- Daily , Weekly | |
| Save GXC for Review: | |
 | GMF SPDR S&P Emerging Asia Pacific |
| Description: Tracks index containing basket of companies from China, India, Indonesia, Malaysia, Pakistan, the Philippines, Taiwan, and Thailand | |
| Sector: Pacific | |
| Sub-Sector: Pacific | |
| Recent Price: 132.53 | |
| Day Percent Change: 1.25% Day Change: 1.64 | |
| Week Change: 0.735775% Year-to-date Change: 14.8% | |
| GMF Links: Profile News Message Board | |
| Charts:- Daily , Weekly | |
| Save GMF for Review: | |
 | TDF Templeton Dragon Fund |
| Description: Invests in equities primarily from China, HongKong, Taiwan and Korea | |
| Sector: Pacific | |
| Sub-Sector: China | |
| Recent Price: 11.21 | |
| Day Percent Change: 0.99% Day Change: 0.11 | |
| Week Change: 2.37443% Year-to-date Change: 36.5% | |
| TDF Links: Profile News Message Board | |
| Charts:- Daily , Weekly | |
| Save TDF for Review: | |
 | EMF Templeton Emerging Markets |
| Description: Invests in equities and debt securities primarily from Korea, Russia, Taiwan, China, Brazil & Africa | |
| Sector: Emerging Markets | |
| Sub-Sector: Emerging Markets | |
| Recent Price: 15.35 | |
| Day Percent Change: 0.92% Day Change: 0.14 | |
| Week Change: -0.389358% Year-to-date Change: 28.2% | |
| EMF Links: Profile News Message Board | |
| Charts:- Daily , Weekly | |
| Save EMF for Review: | |
 | GAF SPDR S&P Emerging Middle East & Africa |
| Description: Tracks index containing basket of companies from Egypt, Israel, Jordan, Morocco, Nigeria, and South Africa | |
| Sector: Emerging Markets | |
| Sub-Sector: Emerging Markets | |
| Recent Price: 9.77 | |
| Day Percent Change: 0.31% Day Change: 0.03 | |
| Week Change: -11.7435% Year-to-date Change: 0.0% | |
| GAF Links: Profile News Message Board | |
| Charts:- Daily , Weekly | |
| Save GAF for Review: | |
| Click on following links to sort by: Market Cap or Company Size Performance: Year-to-date, Week and Day | |
| To view more ETFs click on next and previous arrows |
| 12Stocks.com: Typical Stock Holdings in Asia-Pacific ETFs | |
| ETFs are funds that hold basket of stocks. The following table shows list of stocks or holdings commonly found in most Asia-Pacific ETFs . The funds basically perform based on what stocks they hold. You can dive deep into Asia-Pacific stocks in the following pages - Asia-Pacific Stocks |
12Stocks.com Performance of Stock Holdings in Asia-Pacific ETFs
| Ticker | Stock Name | Watchlist | Category | Recent Price | Change % | Weekly Change% | YTD Change% |
| TSM | Taiwan Semiconductor Manufacturing ADR | | Technology | 243.41 | 3.49 | 1.72176 | 21.6606% |
| HDB | HDFC Bank Ltd. ADR | | Financials | 70.60 | -0.06 | -2.33781 | 11.4289% |
| BABA | Alibaba Group Holding Ltd ADR | | Services & Goods | 135.58 | 3.56 | 10.922 | 60.8699% |
| TM | Toyota Motor Corporation ADR | | Services & Goods | 199.62 | 1.00 | 1.46386 | 5.40044% |
| PDD | PDD Holdings Inc ADR | | Services & Goods | 124.68 | 0.65 | 2.01276 | 28.682% |
| BHP | BHP Group Limited ADR | | Materials | 54.39 | -2.09 | -2.64901 | 12.7506% |
| PTR | PetroChina Company Limited | | Energy | 521.31 | 0.60 | 1137.09 | 0% |
| IBN | ICICI Bank Ltd. ADR | | Financials | 31.67 | -0.66 | -0.907384 | 7.0797% |
| SMFG | Sumitomo Mitsui Financial Group Inc ADR | | Financials | 16.44 | -1.08 | -0.423985 | 16.0108% |
| DADA | Dada Nexus Limited | | Services & Goods | 1.96 | -1.26 | -2.48756 | 47.3684% |
| DCM | NTT DOCOMO, Inc. | | Technology | 4.16 | -0.72 | -99.9887 | 0% |
| MTU | Mitsubishi UFJ Financial Group, Inc. | | Financials | 6.64 | 0.00 | 0 | 0% |
| LFC | China Life Insurance Company Limited | | Financials | 43.74 | -0.36 | 690.958 | 0% |
| NTT | Nippon Telegraph and Telephone Corporation | | Technology | 9.25 | 0.00 | -82.8163 | 0% |
| NTES | NetEase Inc ADR | | Technology | 134.27 | 0.85 | -0.592285 | 55.6734% |
| MFG | Mizuho Financial Group, Inc. ADR | | Financials | 6.51 | -0.46 | -0.762195 | 35.5939% |
| SNE | Sony Corporation | | Technology | 288.85 | 194.56 | 193.696 | 0% |
| SNP | China Petroleum & Chemical Corporation | | Energy | 510.10 | 1.35 | 1104.2 | 0% |
| INFY | Infosys Ltd ADR | | Technology | 16.38 | -1.27 | -5.64516 | -26.5603% |
| BRLI | Brilliant Acquisition Corporation | | Financials | 4.70 | 0.00 | 0 | 0% |
| TAK | Takeda Pharmaceutical Co ADR | | Health Care | 15.40 | 0.72 | 3.63392 | 18.9051% |
| HMC | Honda Motor ADR | | Services & Goods | 34.35 | 0.50 | 1.38725 | 23.8146% |
| JD | JD.com Inc ADR | | Services & Goods | 31.45 | 1.68 | 2.04413 | -5.46869% |
| WBK | Westpac Banking Corporation | | Financials | 79.00 | -0.57 | 456.338 | 0% |
| CHT | Chunghwa Telecom ADR | | Technology | 44.18 | 0.43 | 0.454752 | 22.3528% |
| CLEU | China Liberal Education Holdings Limited | | Consumer Staples | 0.10 | 0.00 | 0 | -99.9645% |
| CAJ | Canon Inc. | | Consumer Staples | 1.71 | 0.00 | -92.1811 | 0% |
| IX | Orix Corporation ADR | | Financials | 26.22 | 0.46 | 1.70675 | 26.0813% |
| WIT | Wipro Ltd. ADR | | Technology | 2.73 | 0.00 | -2.84698 | -21.4908% |
| BIDU | Baidu Inc ADR | | Technology | 101.96 | 3.82 | 13.4654 | 23.289% |
| CTRP | Ctrip.com International, Ltd. | | Services & Goods | 27.62 | 1.21 | 18.1352 | 0% |
| ASX | ASE Technology Holding Co.Ltd ADR | | Technology | 10.47 | 1.55 | 4.49102 | 8.27973% |
| NMR | Nomura Holdings Inc. ADR | | Financials | 7.20 | 0.56 | -0.277008 | 28.7093% |
| BEKE | KE Holdings Inc ADR | | Financials | 18.99 | 2.32 | 6.74536 | 8.55647% |
| KYO | Kyocera Corporation | | Technology | 1.29 | -5.15 | -89.9922 | 0% |
| LI | Li Auto Inc ADR | | Services & Goods | 23.65 | -1.38 | 4.64602 | -1.54038% |
| UMC | United Micro Electronics ADR | | Technology | 6.80 | -1.16 | 1.19048 | 10.6195% |
| LIZI | Lizhi Inc. | | Technology | 3.40 | -3.41 | -6.84932 | 0% |
| YUMC | Yum China Holdings Inc | | Services & Goods | 44.93 | 0.51 | 0.73991 | -2.561% |
| XPEV | XPeng Inc ADR | | Services & Goods | 19.83 | -0.05 | -12.6432 | 71.6883% |
| TME | Tencent Music Entertainment Group ADR | | Technology | 24.49 | -0.73 | -5.15105 | 116.343% |
| YMM | Full Truck Alliance Co Ltd ADR | | Technology | 13.25 | 1.15 | 4.41292 | 22.4584% |
| RDY | Dr. Reddy's Laboratories Ltd. ADR | | Health Care | 14.34 | 1.34 | 0.702247 | -8.03035% |
| NIO | NIO Inc ADR | | Services & Goods | 5.95 | -2.62 | -5.70998 | 30.7626% |
| HTHT | H World Group Limited ADR | | Services & Goods | 37.60 | 3.33 | 5.49944 | 19.1585% |
| LN | LINE Corporation | | Technology | 20.80 | -0.29 | 23.7359 | 0% |
| ZTO | ZTO Express (Cayman) Inc ADR | | Industrials | 18.34 | 0.82 | -2.44681 | -1.69751% |
| BGNE | BeiGene, Ltd. | | Health Care | 184.71 | 0.49 | 4.65156 | 0% |
| GSX | GSX Techedu Inc. | | Services & Goods | 12.97 | -4.35 | -13.2441 | 0% |
| MMYT | MakeMyTrip Ltd | | Services & Goods | 100.45 | 0.36 | -2.63643 | -13.5765% |
| BZ | Kanzhun Ltd ADR | | Technology | 23.98 | -0.12 | 4.9453 | 75.8064% |
| CEA | China Eastern Airlines Corporation Limited | | Transports | 19.98 | -0.20 | 3.3092 | 0% |
| HNP | Huaneng Power International, Inc. | | Utilities | 32.15 | 0.19 | 71.6956 | 0% |
| EDU | New Oriental Education & Technology Group Inc. ADR | | Consumer Staples | 48.82 | 0.08 | 4.13823 | -20.6953% |
| ZNH | China Southern Airlines Company Limited | | Transports | 9.84 | 1.23 | -73.7949 | 0% |
| MNSO | MINISO Group Holding Ltd ADR | | Services & Goods | 24.52 | 0.62 | -1.40732 | -0.728343% |
| BILI | Bilibili Inc ADR | | Technology | 22.41 | -0.40 | -0.178174 | 30.8231% |
| WUBA | 58.com Inc. | | Technology | 78.83 | -1.08 | -24.0851 | 0% |
| IREN | IREN Ltd | | Financials | 26.15 | 0.08 | 2.67 | 99.49% |
| VIPS | Vipshop Holdings Ltd ADR | | Services & Goods | 17.14 | 1.00 | 1.66074 | 36.1117% |
| GDS | GDS Holdings Limited ADR | | Technology | 33.17 | 1.25 | -1.485 | 43.0975% |
| SMI | Semiconductor Manufacturing International Corporation | | Technology | 46.56 | 0.02 | -0.192926 | 0% |
| ACH | Aluminum Corporation of China Limited | | Materials | 42.46 | -0.09 | 516.255 | 0% |
| SHI | Sinopec Shanghai Petrochemical Company Limited | | Energy | 273.71 | 0.16 | 1992.58 | 0% |
| SPIL | Siliconware Precision Industries Co., Ltd. | | Technology | 47.27 | 0.81 | -18.2746 | 0% |
| TAL | TAL Education Group ADR | | Consumer Staples | 10.14 | -1.07 | -6.0241 | 3.36391% |
| ATAT | Atour Lifestyle Holdings Ltd ADR | | Services & Goods | 39.04 | 0.36 | 0.03 | 30.01% |
| CBPO | China Biologic Products Holdings, Inc. | | Health Care | 8.47 | -0.24 | -71.9536 | 0% |
| JOBS | 51job, Inc. | | Services & Goods | 9.75 | -0.51 | -84.0007 | 0% |
| VEDL | Vedanta Limited | | Materials | 27.08 | -0.44 | 61.9617 | 0% |
| AUO | AU Optronics Corp. | | Technology | 20.25 | 0.40 | -27.4973 | 0% |
| KC | Kingsoft Cloud Holdings Ltd ADR | | Technology | 13.82 | 2.98 | -2.12465 | 28.9179% |
| QFIN | Qfin Holdings Inc. ADR | | Financials | 28.77 | -0.45 | -3.16392 | -24.2416% |
| YY | JOYY Inc. | | Technology | 47.85 | -2.39 | 10.8922 | 20.2866% |
| ZLAB | Zai Lab Limited ADR | | Health Care | 30.76 | 2.53 | -5.52826 | 23.9823% |
| TTM | Tata Motors Limited | | Consumer Staples | 25.14 | 0.00 | 0 | 0% |
| ATHM | Autohome Inc ADR | | Technology | 28.61 | 0.00 | 0.527056 | 11.0206% |
| WNS | WNS (Holdings) Limited | | Technology | 75.40 | 0.00 | -0.0662691 | 59.408% |
| RNW | ReNew Energy Global plc | | Utilities | 7.80 | 2.09 | 1.16732 | 14.7059% |
| HSAI | Hesai Group ADR | | Services & Goods | 26.49 | 0.30 | -1.11 | 66.86% |
| LU | Lufax Holding Ltd ADR | | Financials | 3.01 | 1.69 | -0.331126 | 25.9414% |
| RLX | RLX Technology Inc ADR | | Consumer Staples | 2.61 | 1.95 | 8.75 | 18.0995% |
| GSH | Guangshen Railway Company Limited | | Transports | 283.85 | 1.27 | -6.83057 | 0% |
| SINA | SINA Corporation | | Technology | 79.70 | 1.07 | 64.9762 | 0% |
| VNET | VNET Group Inc ADR | | Technology | 7.90 | 4.22 | 1.28205 | 56.1265% |
| CHA | Chagee Holdings Ltd. ADR | | Services & Goods | 17.07 | -4.32 | -22.8649 | -39.0357% |
| BEST | BEST Inc. | | Consumer Staples | 2.78 | -0.71 | 0 | 5.30303% |
| DQ | Daqo New Energy Corp ADR | | Technology | 29.21 | 8.35 | 26.8346 | 44.3182% |
| MESO | Mesoblast Ltd ADR | | Health Care | 14.39 | 6.43 | -10.732 | -30.1795% |
| WB | Weibo Corp ADR | | Technology | 11.71 | 1.47 | 4.83438 | 40.9044% |
| HIMX | Himax Technologies ADR | | Technology | 8.39 | 0.84 | -0.94451 | 16.7418% |
| FANH | Fanhua Inc. | | Financials | 1.51 | -1.31 | -7.92683 | 0% |
| IQ | iQIYI Inc ADR | | Technology | 2.71 | 0.00 | 14.8305 | 36.1809% |
| TUYA | Tuya Inc ADR | | Technology | 2.52 | 1.61 | -5.97015 | 46.6139% |
| JKS | JinkoSolar Holding Co. Ltd ADR | | Technology | 25.48 | 5.07 | 13.2444 | 4.23869% |
| FINV | FinVolution Group ADR | | Financials | 7.91 | 1.67 | -7.59346 | 21.0739% |
| VDTH | Videocon d2h Limited | | Services & Goods | 11.08 | 0.00 | 13.9918 | 0% |
| MOMO | Hello Group Inc ADR | | Technology | 8.52 | 2.04 | 4.6683 | 21.9041% |
| HLG | Hailiang Education Group Inc. | | Services & Goods | 10.79 | -0.46 | -24.5455 | 0% |
| KANG | iKang Healthcare Group, Inc. | | Health Care | 52.79 | 0.00 | 6.19594 | 0% |
| ZPIN | Zhaopin Limited | | Services & Goods | 58.69 | -0.46 | -29.2295 | 0% |
| QTT | Qutoutiao Inc. | | Technology | 0.18 | 0.00 | 0 | 0% |
| CANG | Cango Inc ADR | | Financials | 5.04 | 6.55 | 3.49076 | 0.398406% |
| EH | EHang Holdings Ltd ADR | | Industrials | 16.16 | 0.37 | 1.57134 | 3.12699% |
| IIJI | Internet Initiative Japan Inc. | | Technology | 31.11 | -2.63 | 913.355 | 0% |
| BITA | Bitauto Holdings Limited | | Technology | 63.74 | -1.06 | 54.0358 | 0% |
| SIFY | Sify Technologies Limited ADR | | Technology | 11.17 | 9.14 | 16.9634 | 265.033% |
| LX | LexinFintech Holdings Ltd ADR | | Financials | 6.09 | 1.50 | -2.56 | 7.20887% |
| NOAH | Noah Holdings Ltd ADR | | Financials | 12.04 | -2.75 | -0.413565 | 18.2897% |
| EHIC | eHi Car Services Limited | | Transports | 386.03 | -0.56 | 175.244 | 0% |
| UXIN | Uxin Ltd ADR | | Services & Goods | 3.50 | -1.13 | -5.66038 | -25.3731% |
| AZRE | Azure Power Global Limited | | Utilities | 0.45 | -18.18 | 0 | 0% |
| HOLI | Hollysys Automation Technologies Ltd. | | Industrials | 31.23 | 0.71 | 18.3403 | 0% |
| IMOS | Chipmos Technologies Inc ADR | | Technology | 17.50 | 2.64 | 10.7245 | -2.92178% |
| CYOU | Changyou.com Limited | | Technology | 43.91 | -0.05 | 123.233 | 0% |
| YSG | Yatsen Holding Ltd ADR | | Consumer Staples | 9.39 | 6.83 | -2.49221 | 144.531% |
| RERE | ATRenew Inc ADR | | Services & Goods | 4.36 | 2.59 | -7.82241 | 52.9825% |
| WDH | Waterdrop Inc ADR | | Financials | 1.81 | -0.55 | 2.25989 | 56.6693% |
| NEW | Puxin Limited | | Services & Goods | 1.20 | 0.00 | 4.34783 | 0% |

|


List of Asia-Pacific ETFs
 |
|
US Stock Market Performance Year-to-Date: 6% |
 performance (%Change)
| Stock | Price | YTD | Week | Day% |
| FXI | 38.90 | 30.1 | 1.8 | 1.5 |
| EEM | 50.45 | 22.0 | 1.1 | 1.2 |
| INP | 52.85 | 0.0 | 7.7 | 0.1 |
| EEB | 52.85 | 0.0 | 7.7 | 0.1 |
| EPI | 44.38 | -3.1 | -0.2 | -0.2 |
| EWT | 60.21 | 17.3 | 0.7 | 1.5 |
| GIM | 18.27 | 0.0 | 0.0 | 1.2 |
| VWO | 51.97 | 18.8 | 0.9 | 1.2 |
| HAO | 1.14 | -67.8 | -4.7 | 0.9 |
| EWH | 21.18 | 31.9 | -0.1 | 0.9 |
| EWS | 28.53 | 33.6 | 2.3 | 0.9 |
| EWY | 73.63 | 44.0 | 1.6 | 0.8 |
| VPL | 86.80 | 23.2 | 0.6 | 0.6 |
| EWJ | 79.18 | 19.1 | 0.7 | 0.6 |
| JOF | 10.73 | 39.9 | 3.0 | 0.3 |
| EWM | 25.03 | 2.9 | -0.1 | 0.2 |
| EWA | 26.93 | 14.4 | -0.3 | 0.1 |
| FNI | 43.54 | 0.0 | 0.0 | 0.0 |
| IFN | 14.98 | -1.4 | -1.0 | -0.1 |
| PIN | 25.36 | -3.0 | -0.4 | -0.4 |
| GXC | 98.47 | 32.3 | 2.2 | 1.9 |
| GMF | 132.53 | 14.8 | 0.7 | 1.3 |
| TDF | 11.21 | 36.5 | 2.4 | 1.0 |
| EMF | 15.35 | 28.2 | -0.4 | 0.9 |
| GAF | 9.77 | 0.0 | -11.7 | 0.3 |
performance (%Change) End-of-Day Market data as of
© 2014 12Stocks.com Terms & Conditions Privacy Contact Us
All Information Provided Only For Education And Not To Be Used For Investing or Trading. See Terms & Conditions
|
|
Best US Stocks |
|
Top Exchange Traded Funds (ETFs) |
|
Global Markets |
|
Best Sectors |
|
Books & More |