


On This Page ...
Asia-Pacific ETFs
Performance & Trends
Top Asia-Pacific ETFs
Investing with Asia-Pacific ETFs
Detailed View: Asia-Pacific ETF Lists, Charts & More
Stock Holdings in Asia-Pacific ETFs
 Asia-Pacific ETFs SlideShow Here Asia-Pacific ETFs SlideShow Here |
 Daily Weekly Year-To-Date Top Trends Daily Weekly Year-To-Date Top Trends |
 |
| Top Dow Stocks |
| Best Nasdaq Stocks |
| Best SmallCap Stocks |
| Top Sectors |
| Best China Stocks |

Best Asia-Pacific Exchange Traded Funds (ETFs)
| ||||||||||||||||||
| Detailed View: Best Asia-Pacific ETFs by Daily, Weekly, Year-to-date and Trends | ||||||||||||||||||
| Quickly Browse, Sort and Filter to Find Best Asia-Pacific ETFs Using Our Slide Show Tool | ||||||||||||||||||
| Asia-Pacific ETF Segment in Brief | ||||||||||||||||||
| Year-to-date Asia-Pacific segment is underperforming market by -4.21%. | ||||||||||||||||||
 |
||||||||||||||||||
| Year To Date Performance: -0.83 % | ||||||||||||||||||
| Weekly Performance: -2.97 % | ||||||||||||||||||
| Daily Performance: -0.43 % | ||||||||||||||||||
|
Asia-Pacific Segment Short Term Technical Trend Score: 23 Trend Score : 0(bearish) to 100(bullish). Updated daily. Not to be used for investing. |
||||||||||||||||||

| 12Stocks.com: Asia-Pacific ETF Sector - Look at Big Picture | |
 |
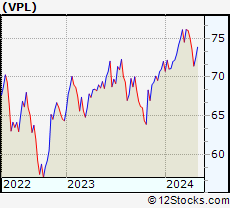
Let's take comprehensive view of Asia-Pacific segment. The Asia-Pacific segment of the Global Stock Market is best represented by VPL - exchange traded fund that tracks FTSE Developed Asia Pacific Index. It consists of top stocks
- from all major sectors - and is primarily Asia-Pacific region based. The Asia-Pacific sector contains stocks like China Mobile and Toyota. Year to date, Asia-Pacific sector as represented by VPL is down by -0.83% and is currently underperforming the market (S&P 500) by -4.21%. Next, let us look at relative performance of Asia-Pacific segment as represented by S&P Asia-Pacific 350 versus other major market segments like US stock indexes (Nasdaq 100, Dow 30, S&P 500, S&P 400 Midcap & Total Stock Market Index), emerging markets and other asset classes like bonds, gold and oil. The performances of major market segments year to date are - Oil [18.3%], Gold [15.62%], US Dollar [6.68%], US Pacific [4.18%], US Total Market [3.38%], US Mid Cap [2.15%], US Pacific [-0.83%], Emerging Markets [-1.24%], Euro [-3.55%], Bonds [-3.75%], . Now, we dive deep to identify investing opportunities both with ETFs that track Asia-Pacific segment of the stock market and Asia-Pacific stock holdings contained within these ETF baskets. Check daily for updates. Scroll down this guide or just click the links below - |
 |
|
| Asia-Pacific ETFs | |
| SEGMENT | |
| PERFORMANCE | |
|
-0.83% (YEAR-TO-DATE) |
|
|
-2.97% (WEEKLY) |
|
|
-0.43% (DAILY) |
|
| 12Stocks.com: Quick View of Technicals of Overall Asia-Pacific Sector | |
| VPL : Invests to track index of 400 equities from Australia, Japan, Hong Kong, New Zealand and Singapore | |
 |
 |
| Weekly Chart | Daily Chart (Short Term) |
| Weekly: -2.97% | Daily: -0.43% |
| Year-to-date Performance : -0.83% | Relative Performance: The Asia-Pacific Index is underperforming the market (S&P 500) by -4.21% |
| 12Stocks.com: Top Performing Asia-Pacific ETFs | |
|
|
Most popular Asia-Pacific exchange traded funds track the broad Asia-Pacific sector. But there are ETF funds that track specific sub-sectors within the wide Asia-Pacific sector. For instance, most Asia-Pacific ETFs focus on broad market but there are ETFs that focus on smallcap segment. The top performing ETFs (year-to-date) that track the whole Asia-Pacific segment are shown in left side bar. The popular Asia-Pacific ETFs with Best YTD Performances: Wisdom Tree India Earnings Fund [7.34%], PowerShares India Portfolio [4.34%], iShares Japan [3.66%], iShares Malaysia [2.4%], iShares China 25 [-0.08%], Vanguard Emerging Markets VIPERs [-0.51%], Japan Small Cap Fund [-0.53%], iShares Taiwan [-0.7%], Vanguard Pacific Stock VIPERs [-0.83%], iShares Emerging Mkts [-1.24%], iShares Singapore [-2.62%]. Also, there are leveraged ETFs that given enhanced performance by moving twice or thrice the daily movement of Asia-Pacific sector Double Bull India [7.11%], Ultra Japan [5.44%], Ultra China [-5.66%], Ultra Emerging Mkts [-6.18%], TripleBull Emerging Markets [-11.04%]. Finally, there are inverse or bearish Asia-Pacific ETFs that move in opposite direction to the daily movement of the Asia-Pacific segment TripleShort Emerging Markets [5.84%], UltraShort MSCI Emerging Markets [4.03%], Short MSCI Emerging Markets [2.42%], UltraShort FTSE/Xinhua China 25 [-4.61%], UltraShort MSCI Japan [-7.17%]. Now, more recently, over last week, the top performing Asia-Pacific ETFs that track the whole segment on the move are - China CF [0.78%], China [0.71%], Malaysia [0.55%], Singapore [0.5%], China150 [0.4%], India [-0.07%], India [-0.19%], India CF [-1.09%], Japan SmlCap CF [-1.69%], Emerging Mkts [-1.71%], Pacific Ex-Jpn [-2.02%] . |
|
LEADING Asia-Pacific ETFs (YEAR-TO-DATE) |
|
| Wisdom Tree India Earnings Fund : 7.34% | |
| MS India Investment Fund: 5.78% | |
| PowerShares India Portfolio: 4.34% | |
| iShares Japan : 3.66% | |
| iShares Malaysia : 2.4% | |
| SPDR S&P Emerging Asia Pacific: 0.03% | |
| iShares China 25: -0.08% | |
| Vanguard Emerging Markets VIPERs: -0.51% | |
| Japan Small Cap Fund: -0.53% | |
| iShares Taiwan : -0.7% | |
|
For Complete List of Winners and Laggards from Asia-Pacific ETF
Segment
| |

| 12Stocks.com: Investing With Asia-Pacific ETFs | |
|
The following table helps investors and traders sort through current performance of various
Asia-Pacific ETFs. One can glean long and short term trends by sorting Asia-Pacific ETF list by performance over daily, weekly or year-to-date periods. |
12Stocks.com Performance of Asia-Pacific ETFs
| Ticker | Stock Name | Watchlist | Category | Recent Price | Change % | Weekly Change% | YTD Change% |
| FXI | iShares China 25 |   | Pacific | 24.01 | -0.29 | 0.71 | -0.08% |
| EPI | Wisdom Tree India Earnings Fund | | Pacific | 44.01 | 0.46 | -0.07 | 7.34% |
| EEM | iShares Emerging Mkts | | Emerging Markets | 39.71 | -0.40 | -2.02 | -1.24% |
| EWM | iShares Malaysia | | Pacific | 21.76 | 0.55 | 0.55 | 2.4% |
| EWS | iShares Singapore | | Pacific | 18.21 | 0.55 | 0.5 | -2.62% |
| VWO | Vanguard Emerging Markets VIPERs | | Emerging Markets | 40.89 | -0.29 | -1.71 | -0.51% |
| PIN | PowerShares India Portfolio | | Pacific | 26.71 | 0.75 | -0.19 | 4.34% |
| EWY | iShares South Korea | | Pacific | 61.32 | -0.78 | -2.06 | -6.42% |
| JOF | Japan Small Cap Fund | | Pacific | 7.55 | 0.94 | -1.69 | -0.53% |
| EWT | iShares Taiwan | | Pacific | 45.71 | -2.10 | -5.5 | -0.7% |
| EWJ | iShares Japan | | Pacific | 66.49 | -0.60 | -3.72 | 3.66% |
| VPL | Vanguard Pacific Stock VIPERs | | Pacific | 71.43 | -0.43 | -2.97 | -0.83% |
| EWA | iShares Australia | | Pacific | 23.36 | 0.26 | -2.26 | -4.03% |
| EWH | iShares Hong Kong | | Pacific | 14.70 | -0.27 | -3.03 | -15.37% |
| IFN | India Closed-End ETF Fund | | Pacific | 17.64 | 0.23 | -9.07 | -3.55% |
| TDF | Templeton Dragon Fund | | Pacific | 7.80 | -0.13 | 0.78 | -4.53% |
| IIF | MS India Investment Fund | | Pacific | 22.71 | 0.49 | -1.09 | 5.78% |
| GXC | SPDR S&P China | | Pacific | 65.33 | -0.29 | 0.4 | -4.1% |
| GMF | SPDR S&P Emerging Asia Pacific | | Pacific | 101.10 | -0.57 | -2.22 | 0.03% |
| EMF | Templeton Emerging Markets | | Emerging Markets | 11.20 | -1.06 | -3.86 | -4.11% |
| EPP | iShares Pacific ex-Japan | | Pacific | 40.80 | 0.12 | -2.02 | -6.01% |
| TFC | Taiwan Greater China Fund | | Pacific | 36.80 | 3.05 | 0.08 | -0.33% |
| IAF | Australia Equity Fund | | Pacific | 4.17 | 0.00 | -0.48 | -3.7% |
| CHN | China Fund | | Pacific | 9.73 | -0.97 | 0.52 | -4.23% |
| KF | Korea Fund | | Pacific | 22.99 | -1.54 | -3.89 | -1.75% |
 | Showing 0 to 25 ETFs. Click on arrows to view more! Sort by performace by clicking on Daily, Weekly or YTD % Change |  | |||||
| 12Stocks.com: Euro Currency | |
| Investors using Asia-Pacific ETFs have to also deal with currency movements versus US dollar. Unless the ETF is hedged for Asia-Pacific currency exposure, traders will have to take into account the performance of Asia-Pacific currencies. |
12Stocks.com Performance of Asia-Pacific Currencies
| Ticker | ETF Name | Watchlist | Category | Recent Price | Change % | Weekly Change% | YTD Change% |
| YCS | UltraShort Yen | | Pacific | 86.13 | 0.01 | 1.97 | 24.92% |
| FXA | Australian Dollar | | Pacific | 63.57 | -0.08 | -0.62 | -5.85% |
| YCL | Ultra Yen | | Pacific | 22.27 | -0.18 | -2.32 | -18.99% |
| 12Stocks.com: Trading With Bullish (Leveraged) Asia-Pacific ETFs | |
| Traders and speculators can enhance their performances by trading leveraged ETFs that double or triple the daily returns of Asia-Pacific indexes. Also, listed below are leveraged ETFs that have exposure to Asia-Pacific economy. |
12Stocks.com Performance of Bullish (Leveraged) Asia-Pacific ETFs
| Ticker | ETF Name | Watchlist | Category | Recent Price | Change % | Weekly Change% | YTD Change% |
| INDL | Double Bull India | | Pacific | 60.84 | 1.01 | -1.46 | 7.11% |
| EZJ | Ultra Japan | | Pacific | 38.31 | -0.16 | -6.67 | 5.44% |
| XPP | Ultra China | | Pacific | 12.97 | -0.17 | 1.47 | -5.66% |
| EET | Ultra Emerging Mkts | | Emerging Markets | 47.72 | -0.65 | -4.18 | -6.18% |
| EDC | TripleBull Emerging Markets | | Emerging Markets | 27.07 | -1.42 | -6.27 | -11.04% |
| 12Stocks.com: Trading With Bearish (& Leveraged) Asia-Pacific ETFs | |
| Traders and speculators can hedge or take advantage of market pullbacks by betting on bearish (inverse) ETFs that move in opposite direction to underlying index. Asia-Pacific traders can enhance their performances by trading leveraged bearish ETFs that double or triple inverse the daily returns of Asia-Pacific indexes. Also, listed below are ETFs that have exposure to Asia-Pacific economy. |
12Stocks.com Performance of Bearish (Leveraged) Asia-Pacific ETFs
| Ticker | ETF Name | Watchlist | Category | Recent Price | Change % | Weekly Change% | YTD Change% |
| EDZ | TripleShort Emerging Markets | | Emerging Markets | 11.60 | 1.40 | 6.81 | 5.84% |
| EEV | UltraShort MSCI Emerging Markets | | Emerging Markets | 20.52 | 0.73 | 3.94 | 4.03% |
| EUM | Short MSCI Emerging Markets | | Emerging Markets | 14.49 | 0.50 | 2.16 | 2.42% |
| FXP | UltraShort FTSE/Xinhua China 25 | | Pacific | 37.36 | -0.02 | -1.49 | -4.61% |
| EWV | UltraShort MSCI Japan | | Pacific | 11.33 | 0.44 | 6.99 | -7.17% |
| Charts, Fundamental Data and Performances of ETFs | ||
| Click on following links to sort by: Market Cap or Company Size Performance: Year-to-date, Week and Day | |
| To view more ETFs click on next and previous arrows | ||
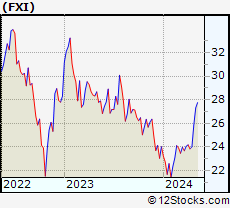 | FXI iShares China 25 |
| Description: Invests in 25 largest and most liquid Chinese companies | |
| Sector: Pacific | |
| Sub-Sector: China | |
| Recent Price: 24.01 | |
| Day Percent Change: -0.29% Day Change: -0.07 | |
| Week Change: 0.71% Year-to-date Change: -0.1% | |
| FXI Links: Profile News Message Board | |
| Charts:- Daily , Weekly | |
| Save FXI for Review: | |
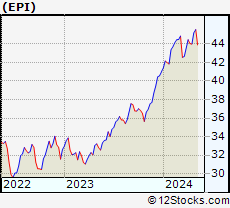 | EPI Wisdom Tree India Earnings Fund |
| Description: Tracks an earnings-weighted index of 150 Indian companies | |
| Sector: Pacific | |
| Sub-Sector: India | |
| Recent Price: 44.01 | |
| Day Percent Change: 0.46% Day Change: 0.20 | |
| Week Change: -0.07% Year-to-date Change: 7.3% | |
| EPI Links: Profile News Message Board | |
| Charts:- Daily , Weekly | |
| Save EPI for Review: | |
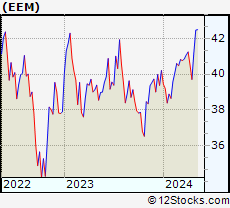 | EEM iShares Emerging Mkts |
| Description: Invests in leading companies from emerging markets like Latin America and Asia [Korea, Taiwan, etc] | |
| Sector: Emerging Markets | |
| Sub-Sector: Emerging Markets | |
| Recent Price: 39.71 | |
| Day Percent Change: -0.40% Day Change: -0.16 | |
| Week Change: -2.02% Year-to-date Change: -1.2% | |
| EEM Links: Profile News Message Board | |
| Charts:- Daily , Weekly | |
| Save EEM for Review: | |
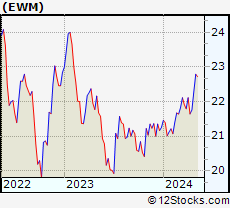 | EWM iShares Malaysia |
| Description: Invests in large cap value companies traded primarily on Kuala Lampur stock exchange & tracks MSCI Malaysia index | |
| Sector: Pacific | |
| Sub-Sector: Malaysia | |
| Recent Price: 21.76 | |
| Day Percent Change: 0.55% Day Change: 0.12 | |
| Week Change: 0.55% Year-to-date Change: 2.4% | |
| EWM Links: Profile News Message Board | |
| Charts:- Daily , Weekly | |
| Save EWM for Review: | |
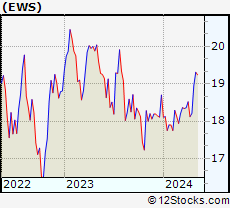 | EWS iShares Singapore |
| Description: Invests in large cap value companies traded primarily on Singapore stock exchange & tracks MSCI Singapore index | |
| Sector: Pacific | |
| Sub-Sector: Singapore | |
| Recent Price: 18.21 | |
| Day Percent Change: 0.55% Day Change: 0.10 | |
| Week Change: 0.5% Year-to-date Change: -2.6% | |
| EWS Links: Profile News Message Board | |
| Charts:- Daily , Weekly | |
| Save EWS for Review: | |
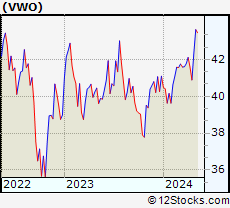 | VWO Vanguard Emerging Markets VIPERs |
| Description: Invests to track index of 500 equities from all across worlds emerging markets | |
| Sector: Emerging Markets | |
| Sub-Sector: Emerging Markets | |
| Recent Price: 40.89 | |
| Day Percent Change: -0.29% Day Change: -0.12 | |
| Week Change: -1.71% Year-to-date Change: -0.5% | |
| VWO Links: Profile News Message Board | |
| Charts:- Daily , Weekly | |
| Save VWO for Review: | |
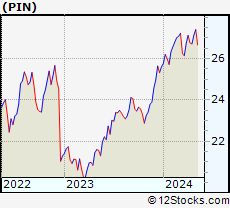 | PIN PowerShares India Portfolio |
| Description: Tracks the Indus India Index of 50 companies | |
| Sector: Pacific | |
| Sub-Sector: India | |
| Recent Price: 26.71 | |
| Day Percent Change: 0.75% Day Change: 0.20 | |
| Week Change: -0.19% Year-to-date Change: 4.3% | |
| PIN Links: Profile News Message Board | |
| Charts:- Daily , Weekly | |
| Save PIN for Review: | |
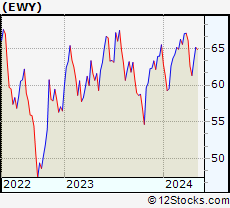 | EWY iShares South Korea |
| Description: Invests in large cap value companies traded primarily on Seoul stock exchange & tracks MSCI South Korea index | |
| Sector: Pacific | |
| Sub-Sector: Korea | |
| Recent Price: 61.32 | |
| Day Percent Change: -0.78% Day Change: -0.48 | |
| Week Change: -2.06% Year-to-date Change: -6.4% | |
| EWY Links: Profile News Message Board | |
| Charts:- Daily , Weekly | |
| Save EWY for Review: | |
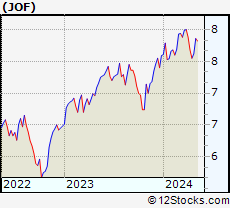 | JOF Japan Small Cap Fund |
| Description: Invests in equities from Japanese OTC market | |
| Sector: Pacific | |
| Sub-Sector: Japan | |
| Recent Price: 7.55 | |
| Day Percent Change: 0.94% Day Change: 0.07 | |
| Week Change: -1.69% Year-to-date Change: -0.5% | |
| JOF Links: Profile News Message Board | |
| Charts:- Daily , Weekly | |
| Save JOF for Review: | |
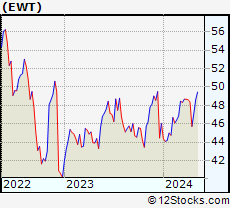 | EWT iShares Taiwan |
| Description: Invests in large cap companies traded primarily on Taiwan stock exchange & tracks MSCI Taiwan index | |
| Sector: Pacific | |
| Sub-Sector: Taiwan | |
| Recent Price: 45.71 | |
| Day Percent Change: -2.10% Day Change: -0.98 | |
| Week Change: -5.5% Year-to-date Change: -0.7% | |
| EWT Links: Profile News Message Board | |
| Charts:- Daily , Weekly | |
| Save EWT for Review: | |
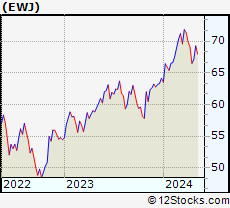 | EWJ iShares Japan |
| Description: Invests in large cap companies traded primarily on Tokyo stock exchange & tracks MSCI Japan index | |
| Sector: Pacific | |
| Sub-Sector: Japan | |
| Recent Price: 66.49 | |
| Day Percent Change: -0.60% Day Change: -0.40 | |
| Week Change: -3.72% Year-to-date Change: 3.7% | |
| EWJ Links: Profile News Message Board | |
| Charts:- Daily , Weekly | |
| Save EWJ for Review: | |
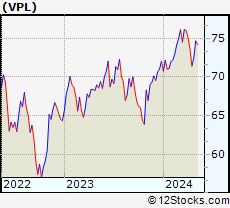 | VPL Vanguard Pacific Stock VIPERs |
| Description: Invests to track index of 400 equities from Australia, Japan, Hong Kong, New Zealand and Singapore | |
| Sector: Pacific | |
| Sub-Sector: Pacific | |
| Recent Price: 71.43 | |
| Day Percent Change: -0.43% Day Change: -0.31 | |
| Week Change: -2.97% Year-to-date Change: -0.8% | |
| VPL Links: Profile News Message Board | |
| Charts:- Daily , Weekly | |
| Save VPL for Review: | |
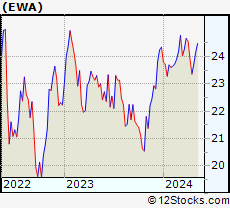 | EWA iShares Australia |
| Description: Invests in large cap companies traded in Australian stock exchange & tracks MSCI Australia index | |
| Sector: Pacific | |
| Sub-Sector: Australia | |
| Recent Price: 23.36 | |
| Day Percent Change: 0.26% Day Change: 0.06 | |
| Week Change: -2.26% Year-to-date Change: -4.0% | |
| EWA Links: Profile News Message Board | |
| Charts:- Daily , Weekly | |
| Save EWA for Review: | |
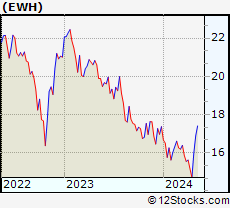 | EWH iShares Hong Kong |
| Description: Invests in large cap companies traded primarily on HongKong stock exchange & tracks MSCI Hong Kong index | |
| Sector: Pacific | |
| Sub-Sector: China | |
| Recent Price: 14.70 | |
| Day Percent Change: -0.27% Day Change: -0.04 | |
| Week Change: -3.03% Year-to-date Change: -15.4% | |
| EWH Links: Profile News Message Board | |
| Charts:- Daily , Weekly | |
| Save EWH for Review: | |
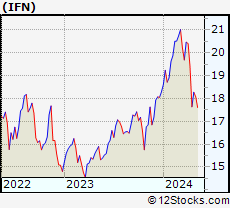 | IFN India Closed-End ETF Fund |
| Description: Invests in leading companies from India | |
| Sector: Pacific | |
| Sub-Sector: India | |
| Recent Price: 17.64 | |
| Day Percent Change: 0.23% Day Change: 0.04 | |
| Week Change: -9.07% Year-to-date Change: -3.6% | |
| IFN Links: Profile News Message Board | |
| Charts:- Daily , Weekly | |
| Save IFN for Review: | |
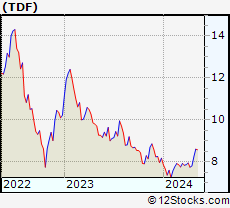 | TDF Templeton Dragon Fund |
| Description: Invests in equities primarily from China, HongKong, Taiwan and Korea | |
| Sector: Pacific | |
| Sub-Sector: China | |
| Recent Price: 7.80 | |
| Day Percent Change: -0.13% Day Change: -0.01 | |
| Week Change: 0.78% Year-to-date Change: -4.5% | |
| TDF Links: Profile News Message Board | |
| Charts:- Daily , Weekly | |
| Save TDF for Review: | |
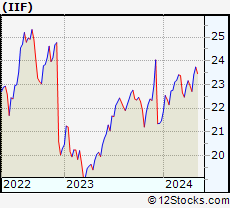 | IIF MS India Investment Fund |
| Description: Invests in leading companies from India | |
| Sector: Pacific | |
| Sub-Sector: India | |
| Recent Price: 22.71 | |
| Day Percent Change: 0.49% Day Change: 0.11 | |
| Week Change: -1.09% Year-to-date Change: 5.8% | |
| IIF Links: Profile News Message Board | |
| Charts:- Daily , Weekly | |
| Save IIF for Review: | |
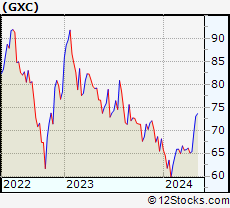 | GXC SPDR S&P China |
| Description: Tracks index containing basket of 150 companies from China | |
| Sector: Pacific | |
| Sub-Sector: China | |
| Recent Price: 65.33 | |
| Day Percent Change: -0.29% Day Change: -0.19 | |
| Week Change: 0.4% Year-to-date Change: -4.1% | |
| GXC Links: Profile News Message Board | |
| Charts:- Daily , Weekly | |
| Save GXC for Review: | |
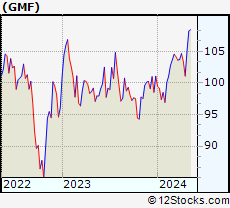 | GMF SPDR S&P Emerging Asia Pacific |
| Description: Tracks index containing basket of companies from China, India, Indonesia, Malaysia, Pakistan, the Philippines, Taiwan, and Thailand | |
| Sector: Pacific | |
| Sub-Sector: Pacific | |
| Recent Price: 101.10 | |
| Day Percent Change: -0.57% Day Change: -0.58 | |
| Week Change: -2.22% Year-to-date Change: 0.0% | |
| GMF Links: Profile News Message Board | |
| Charts:- Daily , Weekly | |
| Save GMF for Review: | |
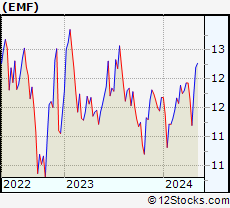 | EMF Templeton Emerging Markets |
| Description: Invests in equities and debt securities primarily from Korea, Russia, Taiwan, China, Brazil & Africa | |
| Sector: Emerging Markets | |
| Sub-Sector: Emerging Markets | |
| Recent Price: 11.20 | |
| Day Percent Change: -1.06% Day Change: -0.12 | |
| Week Change: -3.86% Year-to-date Change: -4.1% | |
| EMF Links: Profile News Message Board | |
| Charts:- Daily , Weekly | |
| Save EMF for Review: | |
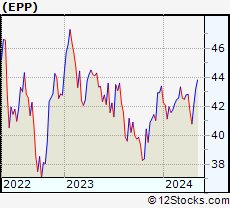 | EPP iShares Pacific ex-Japan |
| Description: Invests in large companies from Australia, Hong Kong, New Zealand and Singapore | |
| Sector: Pacific | |
| Sub-Sector: Pacific | |
| Recent Price: 40.80 | |
| Day Percent Change: 0.12% Day Change: 0.05 | |
| Week Change: -2.02% Year-to-date Change: -6.0% | |
| EPP Links: Profile News Message Board | |
| Charts:- Daily , Weekly | |
| Save EPP for Review: | |
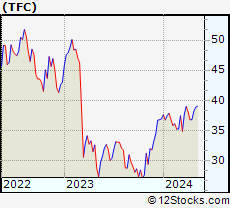 | TFC Taiwan Greater China Fund |
| Description: Invests in equities of companies that trade primarily in Taiwan stock market and gets substantial revenues from mainland China | |
| Sector: Pacific | |
| Sub-Sector: Thailand | |
| Recent Price: 36.80 | |
| Day Percent Change: 3.05% Day Change: 1.09 | |
| Week Change: 0.08% Year-to-date Change: -0.3% | |
| TFC Links: Profile News Message Board | |
| Charts:- Daily , Weekly | |
| Save TFC for Review: | |
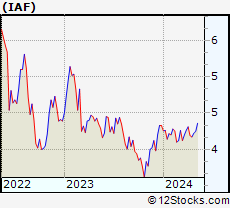 | IAF Australia Equity Fund |
| Description: Invests in large cap companies traded in Australian stock exchange | |
| Sector: Pacific | |
| Sub-Sector: Australia | |
| Recent Price: 4.17 | |
| Day Percent Change: 0.00% Day Change: 0.00 | |
| Week Change: -0.48% Year-to-date Change: -3.7% | |
| IAF Links: Profile News Message Board | |
| Charts:- Daily , Weekly | |
| Save IAF for Review: | |
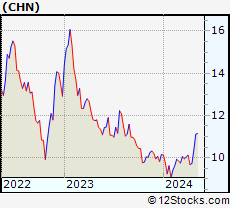 | CHN China Fund |
| Description: Invests in equities of China related securities traded primarily in Hong Kong, Taiwan and also in unlisted securities | |
| Sector: Pacific | |
| Sub-Sector: China | |
| Recent Price: 9.73 | |
| Day Percent Change: -0.97% Day Change: -0.09 | |
| Week Change: 0.52% Year-to-date Change: -4.2% | |
| CHN Links: Profile News Message Board | |
| Charts:- Daily , Weekly | |
| Save CHN for Review: | |
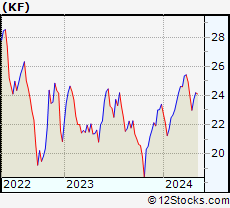 | KF Korea Fund |
| Description: Invests in equities and debt securities primarily from Korea | |
| Sector: Pacific | |
| Sub-Sector: Korea | |
| Recent Price: 22.99 | |
| Day Percent Change: -1.54% Day Change: -0.36 | |
| Week Change: -3.89% Year-to-date Change: -1.8% | |
| KF Links: Profile News Message Board | |
| Charts:- Daily , Weekly | |
| Save KF for Review: | |
| Click on following links to sort by: Market Cap or Company Size Performance: Year-to-date, Week and Day | |
| To view more ETFs click on next and previous arrows |
| 12Stocks.com: Typical Stock Holdings in Asia-Pacific ETFs | |
| ETFs are funds that hold basket of stocks. The following table shows list of stocks or holdings commonly found in most Asia-Pacific ETFs . The funds basically perform based on what stocks they hold. You can dive deep into Asia-Pacific stocks in the following pages - Asia-Pacific Stocks |
12Stocks.com Performance of Stock Holdings in Asia-Pacific ETFs
| Ticker | Stock Name | Watchlist | Category | Recent Price | Change % | Weekly Change% | YTD Change% |
| BABA | Alibaba Group Holding Limited | | Services & Goods | 69.07 | 0.28 | -3.11 | -10.89% |
| TSM | Taiwan Semiconductor Manufacturing Company Limited | | Technology | 127.70 | -3.46 | -10.4 | 22.79% |
| TM | Toyota Motor Corporation | | Consumer Staples | 228.72 | -1.35 | -5.86 | 24.72% |
| DADA | Dada Nexus Limited | | Services & Goods | 1.89 | 2.17 | -1.31 | -43.22% |
| KC | Kingsoft Cloud Holdings Limited | | Technology | 2.67 | 0.19 | -1.3 | -29.59% |
| BHP | BHP Group | | Materials | 58.12 | 0.22 | -0.75 | -14.92% |
| OCFT | OneConnect Financial Technology Co., Ltd. | | Technology | 1.89 | 2.16 | -3.08 | -40% |
| BEKE | KE Holdings Inc. | | Financials | 12.65 | -0.78 | -3.88 | -21.96% |
| MNSO | MINISO Group Holding Limited | | Services & Goods | 20.50 | -1.80 | -3.14 | 0.51% |
| JD | JD.com, Inc. | | Technology | 25.51 | 0.20 | 0.47 | -11.7% |
| API | Agora, Inc. | | Technology | 2.41 | -1.23 | -1.23 | -8.71% |
| WIMI | WiMi Hologram Cloud Inc. | | Technology | 0.70 | -1.62 | -4.32 | -13.34% |
| PDD | Pinduoduo Inc. | | Services & Goods | 113.49 | -0.18 | -1.74 | -22.43% |
| YGMZ | MingZhu Logistics Holdings Limited | | Industrials | 0.47 | 10.31 | 17.48 | -0.55% |
| HMC | Honda Motor Co., Ltd. | | Consumer Staples | 34.14 | -0.90 | -5.43 | 10.45% |
| ZCMD | Zhongchao Inc. | | Health Care | 1.87 | -44.67 | 14.02 | 412.19% |
| TAK | Takeda Pharmaceutical Company Limited | | Health Care | 13.24 | 0.61 | -0.97 | -7.22% |
| NTES | NetEase, Inc. | | Technology | 93.51 | 1.09 | 1.48 | 0.38% |
| QH | Quhuo Limited | | Technology | 0.63 | 1.89 | 8.87 | -57.12% |
| HUIZ | Huize Holding Limited | | Financials | 0.62 | -2.36 | 2.82 | -31.44% |
| SMFG | Sumitomo Mitsui Financial Group, Inc. | | Financials | 11.17 | 0.27 | -2.95 | 15.39% |
| INFY | Infosys Limited | | Technology | 16.81 | 1.82 | -5.14 | -8.54% |
| EBON | Ebang International Holdings Inc. | | Technology | 8.24 | 0.00 | -1.08 | -46.06% |
| BIDU | Baidu, Inc. | | Technology | 95.05 | -0.55 | -2.55 | -20.19% |
| LU | Lufax Holding Ltd | | Financials | 4.35 | 1.87 | 5.07 | 41.69% |
| BQ | Boqii Holding Limited | | Services & Goods | 0.27 | 3.47 | 5.07 | -40.02% |
| XPEV | XPeng Inc. | | Services & Goods | 7.04 | -1.74 | -5.56 | -51.71% |
| CLEU | China Liberal Education Holdings Limited | | Consumer Staples | 1.03 | 3.08 | 6.27 | 476.51% |
| EDTK | Skillful Craftsman Education Technology Limited | | Consumer Staples | 0.92 | -0.54 | -0.54 | -27.38% |
| YQ | 17 Education & Technology Group Inc. | | Consumer Staples | 2.46 | 1.44 | -5.19 | 20.83% |
| TEAM | Atlassian Corporation Plc | | Technology | 191.55 | -1.06 | -7.25 | -19.47% |
| IBN | ICICI Bank Limited | | Financials | 25.68 | 0.98 | -1.76 | 7.72% |
| TAL | TAL Education Group | | Services & Goods | 11.43 | -1.89 | -2.31 | -9.5% |
| HDB | HDFC Bank Limited | | Financials | 59.05 | 2.91 | 3.51 | -12.01% |
| LI | Li Auto Inc. | | Services & Goods | 27.21 | -6.78 | -7.42 | -27.32% |
| CHT | Chunghwa Telecom Co., Ltd. | | Technology | 37.85 | -0.81 | -1.69 | -3.12% |
| MFG | Mizuho Financial Group, Inc. | | Financials | 3.85 | 0.26 | -1.53 | 11.92% |
| BNR | Burning Rock Biotech Limited | | Health Care | 0.80 | 3.52 | 5.26 | -17.09% |
| IMAB | I Mab | | Health Care | 1.81 | 0.56 | 0 | -4.74% |
| ZTO | ZTO Express (Cayman) Inc. | | Transports | 19.94 | -0.30 | 3.53 | -6.3% |
| EDU | New Oriental Education & Technology Group Inc. | | Services & Goods | 84.99 | -2.19 | -1.81 | 15.98% |
| YUMC | Yum China Holdings, Inc. | | Services & Goods | 37.10 | -0.32 | -0.64 | -12.56% |
| TME | Tencent Music Entertainment Group | | Technology | 11.36 | -1.90 | -0.09 | 26.08% |
| IX | ORIX Corporation | | Financials | 101.44 | -0.30 | -4.02 | 8.62% |
| NMR | Nomura Holdings, Inc. | | Financials | 5.77 | -1.70 | -5.56 | 27.94% |
| WIT | Wipro Limited | | Technology | 5.25 | 1.74 | -3.85 | -5.75% |
| IQ | iQIYI, Inc. | | Technology | 4.09 | -2.74 | -0.85 | -16.29% |
| TCOM | Trip.com Group Limited | | Services & Goods | 48.00 | -1.48 | -1.74 | 33.3% |
| LXEH | Lixiang Education Holding Co., Ltd. | | Consumer Staples | 0.41 | 2.00 | -6.62 | -62.3% |
| IH | iHuman Inc. | | Consumer Staples | 1.73 | 0.99 | -2.7 | -43.21% |
| YSG | Yatsen Holding Limited | | Services & Goods | 3.62 | 0.98 | 20.1 | 394.12% |
| BGNE | BeiGene, Ltd. | | Health Care | 129.52 | -1.85 | -8.34 | -28.19% |
| VIPS | Vipshop Holdings Limited | | Services & Goods | 15.16 | 0.07 | -6.71 | -14.64% |
| HTHT | Huazhu Group Limited | | Services & Goods | 36.89 | -1.26 | -1.57 | 10.32% |
| GDS | GDS Holdings Limited | | Technology | 6.32 | -1.40 | -6.23 | -30.7% |
| ASX | ASE Technology Holding Co., Ltd. | | Technology | 10.05 | -2.90 | -7.37 | 6.8% |
| WB | Weibo Corporation | | Technology | 7.90 | -1.99 | 3.54 | -27.85% |
| ATHM | Autohome Inc. | | Technology | 24.28 | 0.08 | -3.8 | -13.47% |
| BILI | Bilibili Inc. | | Technology | 10.91 | -1.45 | -4.97 | -10.35% |
| YMM | Full Truck Alliance Co. Ltd. | | Technology | 7.77 | 1.97 | 0.78 | 11.08% |
| BZ | Kanzhun Limited | | Industrials | 17.84 | -1.03 | -4.8 | 7.96% |
| RDY | Dr. Reddy s Laboratories Limited | | Health Care | 71.14 | 0.32 | -0.39 | 2.24% |
| SMI | Semiconductor Manufacturing International Corporation | | Technology | 45.72 | 0.07 | 0.04 | -1.57% |
| UMC | United Microelectronics Corporation | | Technology | 7.40 | -1.73 | -7.15 | -12.53% |
| MOMO | Momo Inc. | | Technology | 5.59 | -1.58 | 5.47 | -19.57% |
| ZLAB | Zai Lab Limited | | Health Care | 14.08 | -0.98 | -1.61 | -48.48% |
| YY | JOYY Inc. | | Technology | 32.23 | -1.32 | -2.04 | -18.82% |
| HUYA | HUYA Inc. | | Services & Goods | 4.41 | -2.22 | -3.5 | 20.49% |
| RLX | RLX Technology Inc. | | Consumer Staples | 1.78 | -0.28 | 1.14 | -10.1% |
| SDA | SunCar Technology Group Inc. | | Services & Goods | 7.09 | -5.34 | 1.29 | -8.75% |
| NIO | NIO Limited | | Consumer Staples | 3.80 | -5.00 | -7.54 | -58.1% |
| DOYU | DouYu International Holdings Limited | | Technology | 8.05 | 0.25 | 6.62 | 747.37% |
| ATAT | Atour Lifestyle Holdings Limited | | Services & Goods | 17.24 | -2.43 | -2.87 | -1.6% |
| DAO | Youdao, Inc. | | Technology | 3.55 | -0.56 | -11.03 | -9.9% |
| BEST | BEST Inc. | | Consumer Staples | 2.08 | 0.00 | -0.95 | -18.48% |
| VNET | 21Vianet Group, Inc. | | Technology | 1.49 | 1.36 | -7.45 | -48.08% |
| LX | LexinFintech Holdings Ltd. | | Financials | 1.63 | 1.24 | -7.39 | -11.41% |
| BZUN | Baozun Inc. | | Services & Goods | 2.32 | -2.52 | -2.11 | -15.33% |
| NOAH | Noah Holdings Limited | | Financials | 11.62 | -3.17 | -9.71 | -15.86% |
| FANH | Fanhua Inc. | | Financials | 3.50 | 2.64 | -15.87 | -47.37% |
| MMYT | MakeMyTrip Limited | | Services & Goods | 60.90 | -0.52 | -11.25 | 29.63% |
| HSAI | Hesai Group | | Services & Goods | 3.97 | -9.05 | -12.17 | -56.28% |
| GHG | GreenTree Hospitality Group Ltd. | | Services & Goods | 2.83 | 3.43 | -7.39 | -24.63% |
| SIMO | Silicon Motion Technology Corporation | | Technology | 71.84 | -1.99 | -4.57 | 17.25% |
| TUYA | Tuya Inc. | | Technology | 1.57 | -4.27 | -8.19 | -31.59% |
| SY | So-Young International Inc. | | Technology | 1.17 | -2.92 | -0.43 | -9.69% |
| QFIN | 360 Finance, Inc. | | Financials | 18.00 | -0.11 | -2.91 | 13.78% |
| CANG | Cango Inc. | | Technology | 1.40 | 1.45 | -4.11 | 37.25% |
| WDH | Waterdrop Inc. | | Financials | 1.22 | 0.00 | -2.4 | 16.52% |
| GGR | Gogoro Inc. | | Services & Goods | 1.41 | -4.41 | -12.96 | -45.77% |
| BEDU | Bright Scholar Education Holdings Limited | | Services & Goods | 2.01 | 6.91 | 9.24 | 60.8% |
| DUO | Fangdd Network Group Ltd. | | Financials | 0.39 | -2.50 | -3.23 | -42.05% |
| YJ | Yunji Inc. | | Services & Goods | 0.75 | 0.00 | -15.28 | 4.87% |
| SFWL | Shengfeng Development Limited | | Industrials | 1.63 | 2.52 | -9.44 | -40.73% |
| ZH | Zhihu Inc. | | Services & Goods | 0.62 | -5.95 | -11.72 | -34.66% |
| LANV | Lanvin Group Holdings Limited | | Services & Goods | 1.59 | 11.19 | -0.63 | -48.04% |
| DDL | Dingdong (Cayman) Limited | | Consumer Staples | 1.15 | 2.68 | -4.96 | -24.34% |
| RERE | ATRenew Inc. | | Services & Goods | 1.58 | -0.32 | -9.2 | -16.4% |
| HOLI | Hollysys Automation Technologies Ltd. | | Industrials | 24.55 | 0.99 | -3.31 | -6.83% |
| DQ | Daqo New Energy Corp. | | Technology | 22.11 | -2.64 | -5.27 | -16.88% |
| IMOS | ChipMOS TECHNOLOGIES INC. | | Technology | 27.81 | -2.35 | -6.83 | 2.21% |
| COE | China Online Education Group | | Services & Goods | 6.47 | -1.97 | -0.61 | -19.44% |
| JKS | JinkoSolar Holding Co., Ltd. | | Technology | 21.56 | -0.46 | -6.34 | -41.64% |
| PERF | Perfect Corp. | | Technology | 2.30 | -4.17 | -13.53 | -25.81% |
| QD | Qudian Inc. | | Technology | 2.28 | 1.33 | -5.79 | 11.76% |
| NIU | Niu Technologies | | Consumer Staples | 1.94 | -4.68 | -12.05 | -11.64% |
| YI | 111, Inc. | | Services & Goods | 1.02 | 2.00 | -7.27 | -34.19% |
| EH | EHang Holdings Limited | | Industrials | 17.51 | -4.26 | 3.67 | 4.23% |

|


List of Asia-Pacific ETFs
 |
|
US Stock Market Performance Year-to-Date: 6% |
 performance (%Change)
| Stock | Price | YTD | Week | Day% |
| FXI | 24.01 | -0.1 | 0.7 | -0.3 |
| EPI | 44.01 | 7.3 | -0.1 | 0.5 |
| EEM | 39.71 | -1.2 | -2.0 | -0.4 |
| EWM | 21.76 | 2.4 | 0.6 | 0.6 |
| EWS | 18.21 | -2.6 | 0.5 | 0.6 |
| VWO | 40.89 | -0.5 | -1.7 | -0.3 |
| PIN | 26.71 | 4.3 | -0.2 | 0.8 |
| EWY | 61.32 | -6.4 | -2.1 | -0.8 |
| JOF | 7.55 | -0.5 | -1.7 | 0.9 |
| EWT | 45.71 | -0.7 | -5.5 | -2.1 |
| EWJ | 66.49 | 3.7 | -3.7 | -0.6 |
| VPL | 71.43 | -0.8 | -3.0 | -0.4 |
| EWA | 23.36 | -4.0 | -2.3 | 0.3 |
| EWH | 14.70 | -15.4 | -3.0 | -0.3 |
| IFN | 17.64 | -3.6 | -9.1 | 0.2 |
| TDF | 7.80 | -4.5 | 0.8 | -0.1 |
| IIF | 22.71 | 5.8 | -1.1 | 0.5 |
| GXC | 65.33 | -4.1 | 0.4 | -0.3 |
| GMF | 101.10 | 0.0 | -2.2 | -0.6 |
| EMF | 11.20 | -4.1 | -3.9 | -1.1 |
| EPP | 40.80 | -6.0 | -2.0 | 0.1 |
| TFC | 36.80 | -0.3 | 0.1 | 3.1 |
| IAF | 4.17 | -3.7 | -0.5 | 0.0 |
| CHN | 9.73 | -4.2 | 0.5 | -1.0 |
| KF | 22.99 | -1.8 | -3.9 | -1.5 |
performance (%Change) End-of-Day Market data as of
© 2014 12Stocks.com Terms & Conditions Privacy Contact Us
All Information Provided Only For Education And Not To Be Used For Investing or Trading. See Terms & Conditions
|
|
Best US Stocks |
|
Top Exchange Traded Funds (ETFs) |
|
Global Markets |
|
Best Sectors |
|
Books & More |