
 Login Sign Up


| |||||
 |  | ||||

| 12Stocks.com Market Intelligence |
Best SmallCap Stocks
|
| In a hurry? Small Cap Stock Lists: Performance Trends Table, Stock Charts
Sort Small Cap stocks: Daily, Weekly, Year-to-Date, Market Cap & Trends. Filter Small Cap stocks list by sector: Show all, Tech, Finance, Energy, Staples, Retail, Industrial, Materials, Utilities and HealthCare Filter Small Cap stocks list by size: All Large Medium Small and MicroCap |
| 12Stocks.com Small Cap Stocks Performances & Trends Daily | |||||||||
|
|  The overall Smart Investing & Trading Score is 82 (0-bearish to 100-bullish) which puts Small Cap index in short term bullish trend. The Smart Investing & Trading Score from previous trading session is 69 and hence an improvement of trend.
| ||||||||
Here are the Smart Investing & Trading Scores of the most requested small cap stocks at 12Stocks.com (click stock name for detailed review):
|


| 12Stocks.com: Investing in Smallcap Index with Stocks | |
|
The following table helps investors and traders sort through current performance and trends (as measured by Smart Investing & Trading Score) of various
stocks in the Smallcap Index. Quick View: Move mouse or cursor over stock symbol (ticker) to view short-term technical chart and over stock name to view long term chart. Click on  to add stock symbol to your watchlist and to add stock symbol to your watchlist and  to view watchlist. Click on any ticker or stock name for detailed market intelligence report for that stock. to view watchlist. Click on any ticker or stock name for detailed market intelligence report for that stock. |
12Stocks.com Performance of Stocks in Smallcap Index
| Ticker | Stock Name | Watchlist | Category | Recent Price | Smart Investing & Trading Score | Change % | YTD Change% |
| TELL | Tellurian |   | Energy | 0.43 | 44 | -0.98 | -43.65% |
| AIRS | AirSculpt | | Health Care | 5.49 | 10 | -0.99 | -26.70% |
| CSV | Carriage Services | | Services & Goods | 25.74 | 83 | -1.00 | 2.92% |
| BCOV | Brightcove | | Technology | 1.88 | 67 | -1.05 | -27.41% |
| VGAS | Verde Clean | | Utilities | 4.69 | 73 | -1.05 | 101.29% |
| ZIMV | ZimVie | | Health Care | 15.82 | 57 | -1.06 | -10.72% |
| NUVB | Nuvation Bio | | Health Care | 3.18 | 63 | -1.09 | 109.90% |
| WNC | Wabash National | | Consumer Staples | 23.08 | 32 | -1.11 | -9.91% |
| PLPC | Preformed Line | | Industrials | 125.34 | 52 | -1.11 | -6.36% |
| OOMA | Ooma | | Technology | 7.15 | 25 | -1.11 | -33.36% |
| ANGO | AngioDynamics | | Health Care | 6.20 | 80 | -1.12 | -20.92% |
| IKNA | Ikena Oncology | | Health Care | 1.32 | 25 | -1.12 | -34.00% |
| PKBK | Parke Bancorp | | Financials | 16.65 | 39 | -1.13 | -17.78% |
| STKL | SunOpta | | Consumer Staples | 5.54 | 7 | -1.16 | 1.28% |
| CYH | Community Health | | Health Care | 3.38 | 75 | -1.17 | 7.99% |
| GLUE | Monte Rosa | | Health Care | 5.72 | 15 | -1.21 | 1.60% |
| QTRX | Quanterix | | Health Care | 16.80 | 64 | -1.29 | -38.55% |
| GPRE | Green Plains | | Materials | 19.90 | 17 | -1.34 | -21.09% |
| LLAP | Terran Orbital | | Industrials | 1.06 | 10 | -1.40 | -7.42% |
| PWOD | Penns Woods | | Financials | 18.19 | 50 | -1.52 | -19.19% |
| CRNX | Crinetics | | Health Care | 46.48 | 88 | -1.53 | 30.64% |
| GSAT | Globalstar | | Technology | 1.28 | 10 | -1.54 | -34.02% |
| ERII | Energy Recovery | | Industrials | 13.43 | 10 | -1.54 | -28.72% |
| PARR | Par Pacific | | Energy | 30.33 | 18 | -1.65 | -16.61% |
| BWMN | Bowman Consulting | | Industrials | 30.48 | 22 | -1.69 | -13.42% |
| For chart view version of above stock list: Chart View ➞ 0 - 25 , 25 - 50 , 50 - 75 , 75 - 100 , 100 - 125 , 125 - 150 , 150 - 175 , 175 - 200 , 200 - 225 , 225 - 250 , 250 - 275 , 275 - 300 , 300 - 325 , 325 - 350 , 350 - 375 , 375 - 400 , 400 - 425 , 425 - 450 , 450 - 475 , 475 - 500 , 500 - 525 | ||
 | Click To Change The Sort Order: By Market Cap or Company Size Performance: Year-to-date, Week and Day |  |
| Too many stocks? View smallcap stocks filtered by marketcap & sector |
| Marketcap: All SmallCap Stocks (default-no microcap), Large, Mid-Range, Small |
| Smallcap Sector: Tech, Finance, Energy, Staples, Retail, Industrial, Materials, & Medical |
|
Get the most comprehensive stock market coverage daily at 12Stocks.com ➞ Best Stocks Today ➞ Best Stocks Weekly ➞ Best Stocks Year-to-Date ➞ Best Stocks Trends ➞  Best Stocks Today 12Stocks.com Best Nasdaq Stocks ➞ Best S&P 500 Stocks ➞ Best Tech Stocks ➞ Best Biotech Stocks ➞ |
| Detailed Overview of SmallCap Stocks |
| SmallCap Technical Overview, Leaders & Laggards, Top SmallCap ETF Funds & Detailed SmallCap Stocks List, Charts, Trends & More |
| Smallcap: Technical Analysis, Trends & YTD Performance | |
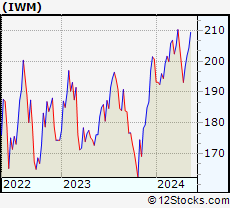
| SmallCap segment as represented by
IWM, an exchange-traded fund [ETF], holds basket of thousands of smallcap stocks from across all major sectors of the US stock market. The smallcap index (contains stocks like Riverbed & Sotheby's) is up by 1.89% and is currently underperforming the overall market by -6.13% year-to-date. Below is a quick view of technical charts and trends: | |
 IWM Weekly Chart |
|
| Long Term Trend: Very Good | |
| Medium Term Trend: Very Good | |
 IWM Daily Chart |
|
| Short Term Trend: Very Good | |
| Overall Trend Score: 82 | |
| YTD Performance: 1.89% | |
| **Trend Scores & Views Are Only For Educational Purposes And Not For Investing | |
| 12Stocks.com: Top Performing Small Cap Index Stocks | ||||||||||||||||||||||||||||||||||||||||||||||||
 The top performing Small Cap Index stocks year to date are
Now, more recently, over last week, the top performing Small Cap Index stocks on the move are


|
||||||||||||||||||||||||||||||||||||||||||||||||
| 12Stocks.com: Investing in Smallcap Index using Exchange Traded Funds | |
|
The following table shows list of key exchange traded funds (ETF) that
help investors track Smallcap index. The following list also includes leveraged ETF funds that track twice or thrice the daily returns of Smallcap indices. Short or inverse ETF funds move in the opposite direction to the index they track and are useful during market pullbacks or during bear markets. Quick View: Move mouse or cursor over ETF symbol (ticker) to view short-term technical chart and over ETF name to view long term chart. Click on ticker or stock name for detailed view. Click on to add stock symbol to your watchlist and to view watchlist. |
12Stocks.com List of ETFs that track Smallcap Index
| Ticker | ETF Name | Watchlist | Recent Price | Smart Investing & Trading Score | Change % | Week % | Year-to-date % |
| IWM | iShares Russell 2000 | | 204.51 | 82 | 1.29 | 1.29 | 1.89% |
| IJR | iShares Core S&P Small-Cap | | 108.26 | 100 | 1.05 | 1.05 | 0.01% |
| VTWO | Vanguard Russell 2000 ETF | | 82.66 | 82 | 1.29 | 1.29 | 1.92% |
| IWN | iShares Russell 2000 Value | | 155.65 | 100 | 0.93 | 0.93 | 0.21% |
| IWO | iShares Russell 2000 Growth | | 261.01 | 69 | 1.61 | 1.61 | 3.49% |
| IJS | iShares S&P Small-Cap 600 Value | | 99.75 | 69 | 1.04 | 1.04 | -3.22% |
| IJT | iShares S&P Small-Cap 600 Growth | | 129.12 | 90 | 1.06 | 1.06 | 3.18% |
| XSLV | PowerShares S&P SmallCap Low Volatil ETF | | 43.58 | 87 | 0.83 | 0.83 | -1.29% |
| SAA | ProShares Ultra SmallCap600 | | 24.11 | 82 | 2.20 | 2.2 | -3.37% |
| SDD | ProShares UltraShort SmallCap600 | | 18.42 | 10 | -2.26 | -2.26 | -0.04% |
| SBB | ProShares Short SmallCap600 | | 16.05 | 13 | -0.67 | -0.67 | 0.76% |
| SMLV | SPDR SSGA US Small Cap Low Volatil ETF | | 110.59 | 100 | 0.83 | 0.83 | -1.72% |
| 12Stocks.com: Charts, Trends, Fundamental Data and Performances of SmallCap Stocks | |
|
We now take in-depth look at all SmallCap stocks including charts, multi-period performances and overall trends (as measured by Smart Investing & Trading Score). One can sort SmallCap stocks (click link to choose) by Daily, Weekly and by Year-to-Date performances. Also, one can sort by size of the company or by market capitalization. |
| Select Your Default Chart Type: | |||||
| |||||
| Click on stock symbol or name for detailed view. Click on to add stock symbol to your watchlist and to view watchlist. Quick View: Move mouse or cursor over "Daily" to quickly view daily technical stock chart and over "Weekly" to view weekly technical stock chart. | |||||

 | TELL Tellurian Inc. |
| Sector: Energy | |
| SubSector: Oil & Gas Drilling & Exploration | |
| MarketCap: 245.339 Millions | |
| Recent Price: 0.43 Smart Investing & Trading Score: 44 | |
| Day Percent Change: -0.98% Day Change: 0.00 | |
| Week Change: -0.98% Year-to-date Change: -43.7% | |
| TELL Links: Profile News Message Board | |
| Charts:- Daily , Weekly | |
| Add TELL to Watchlist: View: Get Complete TELL Trend Analysis ➞ | |
 | AIRS AirSculpt Technologies, Inc. |
| Sector: Health Care | |
| SubSector: Medical Care Facilities | |
| MarketCap: 497 Millions | |
| Recent Price: 5.49 Smart Investing & Trading Score: 10 | |
| Day Percent Change: -0.99% Day Change: -0.05 | |
| Week Change: -0.99% Year-to-date Change: -26.7% | |
| AIRS Links: Profile News Message Board | |
| Charts:- Daily , Weekly | |
| Add AIRS to Watchlist: View: Get Complete AIRS Trend Analysis ➞ | |
 | CSV Carriage Services, Inc. |
| Sector: Services & Goods | |
| SubSector: Personal Services | |
| MarketCap: 304.725 Millions | |
| Recent Price: 25.74 Smart Investing & Trading Score: 83 | |
| Day Percent Change: -1.00% Day Change: -0.26 | |
| Week Change: -1% Year-to-date Change: 2.9% | |
| CSV Links: Profile News Message Board | |
| Charts:- Daily , Weekly | |
| Add CSV to Watchlist: View: Get Complete CSV Trend Analysis ➞ | |
 | BCOV Brightcove Inc. |
| Sector: Technology | |
| SubSector: Application Software | |
| MarketCap: 266.162 Millions | |
| Recent Price: 1.88 Smart Investing & Trading Score: 67 | |
| Day Percent Change: -1.05% Day Change: -0.02 | |
| Week Change: -1.05% Year-to-date Change: -27.4% | |
| BCOV Links: Profile News Message Board | |
| Charts:- Daily , Weekly | |
| Add BCOV to Watchlist: View: Get Complete BCOV Trend Analysis ➞ | |
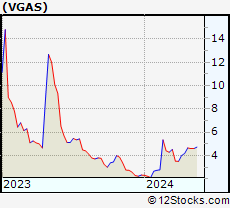 | VGAS Verde Clean Fuels, Inc. |
| Sector: Utilities | |
| SubSector: Utilities - Renewable | |
| MarketCap: 204 Millions | |
| Recent Price: 4.69 Smart Investing & Trading Score: 73 | |
| Day Percent Change: -1.05% Day Change: -0.05 | |
| Week Change: -1.05% Year-to-date Change: 101.3% | |
| VGAS Links: Profile News Message Board | |
| Charts:- Daily , Weekly | |
| Add VGAS to Watchlist: View: Get Complete VGAS Trend Analysis ➞ | |
 | ZIMV ZimVie Inc. |
| Sector: Health Care | |
| SubSector: Medical Devices | |
| MarketCap: 303 Millions | |
| Recent Price: 15.82 Smart Investing & Trading Score: 57 | |
| Day Percent Change: -1.06% Day Change: -0.17 | |
| Week Change: -1.06% Year-to-date Change: -10.7% | |
| ZIMV Links: Profile News Message Board | |
| Charts:- Daily , Weekly | |
| Add ZIMV to Watchlist: View: Get Complete ZIMV Trend Analysis ➞ | |
 | NUVB Nuvation Bio Inc. |
| Sector: Health Care | |
| SubSector: Biotechnology | |
| MarketCap: 381 Millions | |
| Recent Price: 3.18 Smart Investing & Trading Score: 63 | |
| Day Percent Change: -1.09% Day Change: -0.03 | |
| Week Change: -1.09% Year-to-date Change: 109.9% | |
| NUVB Links: Profile News Message Board | |
| Charts:- Daily , Weekly | |
| Add NUVB to Watchlist: View: Get Complete NUVB Trend Analysis ➞ | |
 | WNC Wabash National Corporation |
| Sector: Consumer Staples | |
| SubSector: Trucks & Other Vehicles | |
| MarketCap: 482.597 Millions | |
| Recent Price: 23.08 Smart Investing & Trading Score: 32 | |
| Day Percent Change: -1.11% Day Change: -0.26 | |
| Week Change: -1.11% Year-to-date Change: -9.9% | |
| WNC Links: Profile News Message Board | |
| Charts:- Daily , Weekly | |
| Add WNC to Watchlist: View: Get Complete WNC Trend Analysis ➞ | |
 | PLPC Preformed Line Products Company |
| Sector: Industrials | |
| SubSector: Industrial Electrical Equipment | |
| MarketCap: 221.779 Millions | |
| Recent Price: 125.34 Smart Investing & Trading Score: 52 | |
| Day Percent Change: -1.11% Day Change: -1.41 | |
| Week Change: -1.11% Year-to-date Change: -6.4% | |
| PLPC Links: Profile News Message Board | |
| Charts:- Daily , Weekly | |
| Add PLPC to Watchlist: View: Get Complete PLPC Trend Analysis ➞ | |
 | OOMA Ooma, Inc. |
| Sector: Technology | |
| SubSector: Diversified Communication Services | |
| MarketCap: 222.064 Millions | |
| Recent Price: 7.15 Smart Investing & Trading Score: 25 | |
| Day Percent Change: -1.11% Day Change: -0.08 | |
| Week Change: -1.11% Year-to-date Change: -33.4% | |
| OOMA Links: Profile News Message Board | |
| Charts:- Daily , Weekly | |
| Add OOMA to Watchlist: View: Get Complete OOMA Trend Analysis ➞ | |
 | ANGO AngioDynamics, Inc. |
| Sector: Health Care | |
| SubSector: Medical Instruments & Supplies | |
| MarketCap: 370.86 Millions | |
| Recent Price: 6.20 Smart Investing & Trading Score: 80 | |
| Day Percent Change: -1.12% Day Change: -0.07 | |
| Week Change: -1.12% Year-to-date Change: -20.9% | |
| ANGO Links: Profile News Message Board | |
| Charts:- Daily , Weekly | |
| Add ANGO to Watchlist: View: Get Complete ANGO Trend Analysis ➞ | |
 | IKNA Ikena Oncology, Inc. |
| Sector: Health Care | |
| SubSector: Biotechnology | |
| MarketCap: 277 Millions | |
| Recent Price: 1.32 Smart Investing & Trading Score: 25 | |
| Day Percent Change: -1.12% Day Change: -0.01 | |
| Week Change: -1.12% Year-to-date Change: -34.0% | |
| IKNA Links: Profile News Message Board | |
| Charts:- Daily , Weekly | |
| Add IKNA to Watchlist: View: Get Complete IKNA Trend Analysis ➞ | |
 | PKBK Parke Bancorp, Inc. |
| Sector: Financials | |
| SubSector: Regional - Northeast Banks | |
| MarketCap: 165.799 Millions | |
| Recent Price: 16.65 Smart Investing & Trading Score: 39 | |
| Day Percent Change: -1.13% Day Change: -0.19 | |
| Week Change: -1.13% Year-to-date Change: -17.8% | |
| PKBK Links: Profile News Message Board | |
| Charts:- Daily , Weekly | |
| Add PKBK to Watchlist: View: Get Complete PKBK Trend Analysis ➞ | |
 | STKL SunOpta Inc. |
| Sector: Consumer Staples | |
| SubSector: Processed & Packaged Goods | |
| MarketCap: 174.548 Millions | |
| Recent Price: 5.54 Smart Investing & Trading Score: 7 | |
| Day Percent Change: -1.16% Day Change: -0.07 | |
| Week Change: -1.16% Year-to-date Change: 1.3% | |
| STKL Links: Profile News Message Board | |
| Charts:- Daily , Weekly | |
| Add STKL to Watchlist: View: Get Complete STKL Trend Analysis ➞ | |
 | CYH Community Health Systems, Inc. |
| Sector: Health Care | |
| SubSector: Hospitals | |
| MarketCap: 371.546 Millions | |
| Recent Price: 3.38 Smart Investing & Trading Score: 75 | |
| Day Percent Change: -1.17% Day Change: -0.04 | |
| Week Change: -1.17% Year-to-date Change: 8.0% | |
| CYH Links: Profile News Message Board | |
| Charts:- Daily , Weekly | |
| Add CYH to Watchlist: View: Get Complete CYH Trend Analysis ➞ | |
 | GLUE Monte Rosa Therapeutics, Inc. |
| Sector: Health Care | |
| SubSector: Biotechnology | |
| MarketCap: 346 Millions | |
| Recent Price: 5.72 Smart Investing & Trading Score: 15 | |
| Day Percent Change: -1.21% Day Change: -0.07 | |
| Week Change: -1.21% Year-to-date Change: 1.6% | |
| GLUE Links: Profile News Message Board | |
| Charts:- Daily , Weekly | |
| Add GLUE to Watchlist: View: Get Complete GLUE Trend Analysis ➞ | |
 | QTRX Quanterix Corporation |
| Sector: Health Care | |
| SubSector: Biotechnology | |
| MarketCap: 448.685 Millions | |
| Recent Price: 16.80 Smart Investing & Trading Score: 64 | |
| Day Percent Change: -1.29% Day Change: -0.22 | |
| Week Change: -1.29% Year-to-date Change: -38.6% | |
| QTRX Links: Profile News Message Board | |
| Charts:- Daily , Weekly | |
| Add QTRX to Watchlist: View: Get Complete QTRX Trend Analysis ➞ | |
 | GPRE Green Plains Inc. |
| Sector: Materials | |
| SubSector: Specialty Chemicals | |
| MarketCap: 196.357 Millions | |
| Recent Price: 19.90 Smart Investing & Trading Score: 17 | |
| Day Percent Change: -1.34% Day Change: -0.27 | |
| Week Change: -1.34% Year-to-date Change: -21.1% | |
| GPRE Links: Profile News Message Board | |
| Charts:- Daily , Weekly | |
| Add GPRE to Watchlist: View: Get Complete GPRE Trend Analysis ➞ | |
 | LLAP Terran Orbital Corporation |
| Sector: Industrials | |
| SubSector: Aerospace & Defense | |
| MarketCap: 206 Millions | |
| Recent Price: 1.06 Smart Investing & Trading Score: 10 | |
| Day Percent Change: -1.40% Day Change: -0.01 | |
| Week Change: -1.4% Year-to-date Change: -7.4% | |
| LLAP Links: Profile News Message Board | |
| Charts:- Daily , Weekly | |
| Add LLAP to Watchlist: View: Get Complete LLAP Trend Analysis ➞ | |
 | PWOD Penns Woods Bancorp, Inc. |
| Sector: Financials | |
| SubSector: Regional - Mid-Atlantic Banks | |
| MarketCap: 152.559 Millions | |
| Recent Price: 18.19 Smart Investing & Trading Score: 50 | |
| Day Percent Change: -1.52% Day Change: -0.28 | |
| Week Change: -1.52% Year-to-date Change: -19.2% | |
| PWOD Links: Profile News Message Board | |
| Charts:- Daily , Weekly | |
| Add PWOD to Watchlist: View: Get Complete PWOD Trend Analysis ➞ | |
 | CRNX Crinetics Pharmaceuticals, Inc. |
| Sector: Health Care | |
| SubSector: Biotechnology | |
| MarketCap: 381.085 Millions | |
| Recent Price: 46.48 Smart Investing & Trading Score: 88 | |
| Day Percent Change: -1.53% Day Change: -0.72 | |
| Week Change: -1.53% Year-to-date Change: 30.6% | |
| CRNX Links: Profile News Message Board | |
| Charts:- Daily , Weekly | |
| Add CRNX to Watchlist: View: Get Complete CRNX Trend Analysis ➞ | |
 | GSAT Globalstar, Inc. |
| Sector: Technology | |
| SubSector: Wireless Communications | |
| MarketCap: 485.127 Millions | |
| Recent Price: 1.28 Smart Investing & Trading Score: 10 | |
| Day Percent Change: -1.54% Day Change: -0.02 | |
| Week Change: -1.54% Year-to-date Change: -34.0% | |
| GSAT Links: Profile News Message Board | |
| Charts:- Daily , Weekly | |
| Add GSAT to Watchlist: View: Get Complete GSAT Trend Analysis ➞ | |
 | ERII Energy Recovery, Inc. |
| Sector: Industrials | |
| SubSector: Pollution & Treatment Controls | |
| MarketCap: 429.375 Millions | |
| Recent Price: 13.43 Smart Investing & Trading Score: 10 | |
| Day Percent Change: -1.54% Day Change: -0.21 | |
| Week Change: -1.54% Year-to-date Change: -28.7% | |
| ERII Links: Profile News Message Board | |
| Charts:- Daily , Weekly | |
| Add ERII to Watchlist: View: Get Complete ERII Trend Analysis ➞ | |
 | PARR Par Pacific Holdings, Inc. |
| Sector: Energy | |
| SubSector: Oil & Gas Refining & Marketing | |
| MarketCap: 443.154 Millions | |
| Recent Price: 30.33 Smart Investing & Trading Score: 18 | |
| Day Percent Change: -1.65% Day Change: -0.51 | |
| Week Change: -1.65% Year-to-date Change: -16.6% | |
| PARR Links: Profile News Message Board | |
| Charts:- Daily , Weekly | |
| Add PARR to Watchlist: View: Get Complete PARR Trend Analysis ➞ | |
 | BWMN Bowman Consulting Group Ltd. |
| Sector: Industrials | |
| SubSector: Engineering & Construction | |
| MarketCap: 443 Millions | |
| Recent Price: 30.48 Smart Investing & Trading Score: 22 | |
| Day Percent Change: -1.69% Day Change: -0.53 | |
| Week Change: -1.69% Year-to-date Change: -13.4% | |
| BWMN Links: Profile News Message Board | |
| Charts:- Daily , Weekly | |
| Add BWMN to Watchlist: View: Get Complete BWMN Trend Analysis ➞ | |
| For tabular summary view of above stock list: Summary View ➞ 0 - 25 , 25 - 50 , 50 - 75 , 75 - 100 , 100 - 125 , 125 - 150 , 150 - 175 , 175 - 200 , 200 - 225 , 225 - 250 , 250 - 275 , 275 - 300 , 300 - 325 , 325 - 350 , 350 - 375 , 375 - 400 , 400 - 425 , 425 - 450 , 450 - 475 , 475 - 500 , 500 - 525 | ||
| Click To Change The Sort Order: By Market Cap or Company Size Performance: Year-to-date, Week and Day | |
| Select Chart Type: | ||
| Too many stocks? View smallcap stocks filtered by marketcap & sector |
| Marketcap: All SmallCap Stocks (default-no microcap), Large, Mid-Range, Small & MicroCap |
| Sector: Tech, Finance, Energy, Staples, Retail, Industrial, Materials, Utilities & Medical |
|
Best Stocks Today 12Stocks.com |
© 2024 12Stocks.com Terms & Conditions Privacy Contact Us
All Information Provided Only For Education And Not To Be Used For Investing or Trading. See Terms & Conditions


One More Thing ... Get Best Stocks Delivered Daily!
Never Ever Miss A Move With Our Top Ten Stocks Lists
Find Best Stocks In Any Market - Bull or Bear Market
Take A Peek At Our Top Ten Stocks Lists: Daily, Weekly, Year-to-Date & Top Trends
Find Best Stocks In Any Market - Bull or Bear Market
Take A Peek At Our Top Ten Stocks Lists: Daily, Weekly, Year-to-Date & Top Trends
Smallcap Stocks With Best Up Trends [0-bearish to 100-bullish]: Perficient [100], Outset Medical[100], Lineage Cell[100], Assertio [100], Dakota Gold[100], Loln Educational[100], Twist Bioscience[100], PMV [100], SilverBow Resources[100], Phathom [100], Alexander s[100]
Best Smallcap Stocks Year-to-Date:
CareMax [511.34%], Janux [479.25%], Viking [320.26%], Alpine Immune[239.29%], Longboard [237.32%], Bakkt [197.53%], Vera [194.15%], Super Micro[192.11%], Avidity Biosciences[189.6%], Cullinan Oncology[178.76%], Y-mAbs [152.79%] Best Smallcap Stocks This Week:
Perficient [52.28%], P3 Health[25.16%], Outset Medical[23%], Lineage Cell[22.64%], Workhorse Group[20.5%], SoundHound AI[19.54%], DASAN Zhone[19.25%], BioCryst [18.43%], Marathon Patent[17.98%], Assertio [16.99%], Aceto [16.55%] Best Smallcap Stocks Daily:
Perficient [52.28%], P3 Health[25.16%], Outset Medical[23.00%], Lineage Cell[22.64%], Workhorse Group[20.50%], SoundHound AI[19.54%], DASAN Zhone[19.25%], BioCryst [18.43%], Marathon Patent[17.98%], Assertio [16.99%], Aceto [16.55%]