
 Login Sign Up


| |||||
 |  | ||||

| 12Stocks.com Market Intelligence |
Best SmallCap Stocks
|
| In a hurry? Small Cap Stock Lists: Performance Trends Table, Stock Charts
Sort Small Cap stocks: Daily, Weekly, Year-to-Date, Market Cap & Trends. Filter Small Cap stocks list by sector: Show all, Tech, Finance, Energy, Staples, Retail, Industrial, Materials, Utilities and HealthCare Filter Small Cap stocks list by size: All Large Medium Small and MicroCap |
| 12Stocks.com Small Cap Stocks Performances & Trends Daily | |||||||||
|
|  The overall Smart Investing & Trading Score is 87 (0-bearish to 100-bullish) which puts Small Cap index in short term bullish trend. The Smart Investing & Trading Score from previous trading session is 82 and hence an improvement of trend.
| ||||||||
Here are the Smart Investing & Trading Scores of the most requested small cap stocks at 12Stocks.com (click stock name for detailed review):
|


| 12Stocks.com: Investing in Smallcap Index with Stocks | |
|
The following table helps investors and traders sort through current performance and trends (as measured by Smart Investing & Trading Score) of various
stocks in the Smallcap Index. Quick View: Move mouse or cursor over stock symbol (ticker) to view short-term technical chart and over stock name to view long term chart. Click on  to add stock symbol to your watchlist and to add stock symbol to your watchlist and  to view watchlist. Click on any ticker or stock name for detailed market intelligence report for that stock. to view watchlist. Click on any ticker or stock name for detailed market intelligence report for that stock. |
12Stocks.com Performance of Stocks in Smallcap Index
| Ticker | Stock Name | Watchlist | Category | Recent Price | Smart Investing & Trading Score | Change % | YTD Change% |
| STRS | Stratus Properties |   | Financials | 23.35 | 93 | -2.91 | -19.09% |
| PNTG | Pennant Group | | Health Care | 20.94 | 53 | -2.92 | 50.43% |
| HSII | Heidrick & Struggles | | Services & Goods | 29.42 | 7 | -2.94 | -0.37% |
| CIVB | Civista Bancshares | | Financials | 13.81 | 0 | -2.95 | -25.11% |
| WRLD | World Acceptance | | Financials | 135.59 | 41 | -3.11 | 3.88% |
| GPRE | Green Plains | | Materials | 19.28 | 10 | -3.12 | -23.55% |
| NVAX | Novavax | | Health Care | 4.61 | 42 | -3.15 | -3.96% |
| NAUT | Nautilus | | Health Care | 2.76 | 51 | -3.16 | -16.11% |
| BJRI | BJ s | | Services & Goods | 33.54 | 47 | -3.18 | -6.86% |
| NC | NACCO Industries | | Consumer Staples | 31.49 | 50 | -3.20 | -13.73% |
| EVC | Entravision | | Services & Goods | 2.10 | 27 | -3.23 | -49.64% |
| QSI | Quantum-Si | | Health Care | 1.78 | 73 | -3.26 | -11.44% |
| LXRX | Lexicon | | Health Care | 1.77 | 57 | -3.28 | 15.69% |
| URGN | UroGen Pharma | | Health Care | 13.40 | 0 | -3.32 | -10.67% |
| ONL | Orion Office | | Financials | 3.38 | 50 | -3.43 | -40.91% |
| KRMD | Repro Med | | Health Care | 2.24 | 58 | -3.45 | -8.76% |
| ACNB | ACNB | | Financials | 32.18 | 10 | -3.48 | -28.11% |
| CLAR | Clarus | | Consumer Staples | 6.77 | 73 | -3.49 | -1.81% |
| PFIS | Peoples Financial | | Financials | 37.90 | 25 | -3.59 | -22.18% |
| BRY | Berry | | Energy | 7.68 | 26 | -3.64 | 9.25% |
| GPRO | GoPro | | Consumer Staples | 1.84 | 42 | -3.66 | -46.97% |
| OOMA | Ooma | | Technology | 6.88 | 10 | -3.78 | -35.88% |
| OBIO | Orchestra BioMed | | Health Care | 4.98 | 47 | -3.86 | -45.33% |
| DC | Dakota Gold | | Materials | 2.64 | 90 | -4.00 | 1.54% |
| TMDX | TransMedics Group | | Health Care | 127.22 | 90 | -4.10 | 61.19% |
| For chart view version of above stock list: Chart View ➞ 0 - 25 , 25 - 50 , 50 - 75 , 75 - 100 , 100 - 125 , 125 - 150 , 150 - 175 , 175 - 200 , 200 - 225 , 225 - 250 , 250 - 275 , 275 - 300 , 300 - 325 , 325 - 350 , 350 - 375 , 375 - 400 , 400 - 425 , 425 - 450 , 450 - 475 , 475 - 500 , 500 - 525 | ||
 | Click To Change The Sort Order: By Market Cap or Company Size Performance: Year-to-date, Week and Day |  |
| Too many stocks? View smallcap stocks filtered by marketcap & sector |
| Marketcap: All SmallCap Stocks (default-no microcap), Large, Mid-Range, Small |
| Smallcap Sector: Tech, Finance, Energy, Staples, Retail, Industrial, Materials, & Medical |
|
Get the most comprehensive stock market coverage daily at 12Stocks.com ➞ Best Stocks Today ➞ Best Stocks Weekly ➞ Best Stocks Year-to-Date ➞ Best Stocks Trends ➞  Best Stocks Today 12Stocks.com Best Nasdaq Stocks ➞ Best S&P 500 Stocks ➞ Best Tech Stocks ➞ Best Biotech Stocks ➞ |
| Detailed Overview of SmallCap Stocks |
| SmallCap Technical Overview, Leaders & Laggards, Top SmallCap ETF Funds & Detailed SmallCap Stocks List, Charts, Trends & More |
| Smallcap: Technical Analysis, Trends & YTD Performance | |
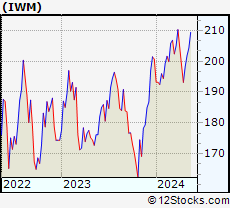
| SmallCap segment as represented by
IWM, an exchange-traded fund [ETF], holds basket of thousands of smallcap stocks from across all major sectors of the US stock market. The smallcap index (contains stocks like Riverbed & Sotheby's) is up by 2.12% and is currently underperforming the overall market by -6% year-to-date. Below is a quick view of technical charts and trends: | |
 IWM Weekly Chart |
|
| Long Term Trend: Very Good | |
| Medium Term Trend: Very Good | |
 IWM Daily Chart |
|
| Short Term Trend: Very Good | |
| Overall Trend Score: 87 | |
| YTD Performance: 2.12% | |
| **Trend Scores & Views Are Only For Educational Purposes And Not For Investing | |
| 12Stocks.com: Top Performing Small Cap Index Stocks | ||||||||||||||||||||||||||||||||||||||||||||||||
 The top performing Small Cap Index stocks year to date are
Now, more recently, over last week, the top performing Small Cap Index stocks on the move are


|
||||||||||||||||||||||||||||||||||||||||||||||||
| 12Stocks.com: Investing in Smallcap Index using Exchange Traded Funds | |
|
The following table shows list of key exchange traded funds (ETF) that
help investors track Smallcap index. The following list also includes leveraged ETF funds that track twice or thrice the daily returns of Smallcap indices. Short or inverse ETF funds move in the opposite direction to the index they track and are useful during market pullbacks or during bear markets. Quick View: Move mouse or cursor over ETF symbol (ticker) to view short-term technical chart and over ETF name to view long term chart. Click on ticker or stock name for detailed view. Click on to add stock symbol to your watchlist and to view watchlist. |
12Stocks.com List of ETFs that track Smallcap Index
| Ticker | ETF Name | Watchlist | Recent Price | Smart Investing & Trading Score | Change % | Week % | Year-to-date % |
| IWM | iShares Russell 2000 | | 204.97 | 87 | 0.22 | 1.52 | 2.12% |
| IJR | iShares Core S&P Small-Cap | | 108.62 | 100 | 0.33 | 1.39 | 0.34% |
| VTWO | Vanguard Russell 2000 ETF | | 82.84 | 82 | 0.22 | 1.51 | 2.15% |
| IWN | iShares Russell 2000 Value | | 155.63 | 100 | -0.01 | 0.92 | 0.19% |
| IWO | iShares Russell 2000 Growth | | 262.30 | 69 | 0.49 | 2.11 | 4% |
| IJS | iShares S&P Small-Cap 600 Value | | 99.68 | 82 | -0.07 | 0.97 | -3.29% |
| IJT | iShares S&P Small-Cap 600 Growth | | 129.84 | 95 | 0.56 | 1.63 | 3.76% |
| XSLV | PowerShares S&P SmallCap Low Volatil ETF | | 44.00 | 100 | 0.96 | 1.8 | -0.34% |
| SAA | ProShares Ultra SmallCap600 | | 24.39 | 95 | 1.16 | 3.39 | -2.24% |
| SMLV | SPDR SSGA US Small Cap Low Volatil ETF | | 110.48 | 100 | -0.10 | 0.72 | -1.81% |
| SBB | ProShares Short SmallCap600 | | 15.97 | 0 | -0.50 | -1.18 | 0.25% |
| SDD | ProShares UltraShort SmallCap600 | | 18.22 | 10 | -1.10 | -3.33 | -1.13% |
| 12Stocks.com: Charts, Trends, Fundamental Data and Performances of SmallCap Stocks | |
|
We now take in-depth look at all SmallCap stocks including charts, multi-period performances and overall trends (as measured by Smart Investing & Trading Score). One can sort SmallCap stocks (click link to choose) by Daily, Weekly and by Year-to-Date performances. Also, one can sort by size of the company or by market capitalization. |
| Select Your Default Chart Type: | |||||
| |||||
| Click on stock symbol or name for detailed view. Click on to add stock symbol to your watchlist and to view watchlist. Quick View: Move mouse or cursor over "Daily" to quickly view daily technical stock chart and over "Weekly" to view weekly technical stock chart. | |||||

 | STRS Stratus Properties Inc. |
| Sector: Financials | |
| SubSector: Real Estate Development | |
| MarketCap: 167.819 Millions | |
| Recent Price: 23.35 Smart Investing & Trading Score: 93 | |
| Day Percent Change: -2.91% Day Change: -0.70 | |
| Week Change: -0.21% Year-to-date Change: -19.1% | |
| STRS Links: Profile News Message Board | |
| Charts:- Daily , Weekly | |
| Add STRS to Watchlist: View: Get Complete STRS Trend Analysis ➞ | |
 | PNTG The Pennant Group, Inc. |
| Sector: Health Care | |
| SubSector: Long-Term Care Facilities | |
| MarketCap: 451.786 Millions | |
| Recent Price: 20.94 Smart Investing & Trading Score: 53 | |
| Day Percent Change: -2.92% Day Change: -0.63 | |
| Week Change: -2.15% Year-to-date Change: 50.4% | |
| PNTG Links: Profile News Message Board | |
| Charts:- Daily , Weekly | |
| Add PNTG to Watchlist: View: Get Complete PNTG Trend Analysis ➞ | |
 | HSII Heidrick & Struggles International, Inc. |
| Sector: Services & Goods | |
| SubSector: Staffing & Outsourcing Services | |
| MarketCap: 431.428 Millions | |
| Recent Price: 29.42 Smart Investing & Trading Score: 7 | |
| Day Percent Change: -2.94% Day Change: -0.89 | |
| Week Change: -1.37% Year-to-date Change: -0.4% | |
| HSII Links: Profile News Message Board | |
| Charts:- Daily , Weekly | |
| Add HSII to Watchlist: View: Get Complete HSII Trend Analysis ➞ | |
 | CIVB Civista Bancshares, Inc. |
| Sector: Financials | |
| SubSector: Regional - Pacific Banks | |
| MarketCap: 255.929 Millions | |
| Recent Price: 13.81 Smart Investing & Trading Score: 0 | |
| Day Percent Change: -2.95% Day Change: -0.42 | |
| Week Change: -2.88% Year-to-date Change: -25.1% | |
| CIVB Links: Profile News Message Board | |
| Charts:- Daily , Weekly | |
| Add CIVB to Watchlist: View: Get Complete CIVB Trend Analysis ➞ | |
 | WRLD World Acceptance Corporation |
| Sector: Financials | |
| SubSector: Credit Services | |
| MarketCap: 486.408 Millions | |
| Recent Price: 135.59 Smart Investing & Trading Score: 41 | |
| Day Percent Change: -3.11% Day Change: -4.35 | |
| Week Change: -2.66% Year-to-date Change: 3.9% | |
| WRLD Links: Profile News Message Board | |
| Charts:- Daily , Weekly | |
| Add WRLD to Watchlist: View: Get Complete WRLD Trend Analysis ➞ | |
 | GPRE Green Plains Inc. |
| Sector: Materials | |
| SubSector: Specialty Chemicals | |
| MarketCap: 196.357 Millions | |
| Recent Price: 19.28 Smart Investing & Trading Score: 10 | |
| Day Percent Change: -3.12% Day Change: -0.62 | |
| Week Change: -4.41% Year-to-date Change: -23.6% | |
| GPRE Links: Profile News Message Board | |
| Charts:- Daily , Weekly | |
| Add GPRE to Watchlist: View: Get Complete GPRE Trend Analysis ➞ | |
 | NVAX Novavax, Inc. |
| Sector: Health Care | |
| SubSector: Biotechnology | |
| MarketCap: 376.185 Millions | |
| Recent Price: 4.61 Smart Investing & Trading Score: 42 | |
| Day Percent Change: -3.15% Day Change: -0.15 | |
| Week Change: -6.49% Year-to-date Change: -4.0% | |
| NVAX Links: Profile News Message Board | |
| Charts:- Daily , Weekly | |
| Add NVAX to Watchlist: View: Get Complete NVAX Trend Analysis ➞ | |
 | NAUT Nautilus Biotechnology, Inc. |
| Sector: Health Care | |
| SubSector: Biotechnology | |
| MarketCap: 458 Millions | |
| Recent Price: 2.76 Smart Investing & Trading Score: 51 | |
| Day Percent Change: -3.16% Day Change: -0.09 | |
| Week Change: 0% Year-to-date Change: -16.1% | |
| NAUT Links: Profile News Message Board | |
| Charts:- Daily , Weekly | |
| Add NAUT to Watchlist: View: Get Complete NAUT Trend Analysis ➞ | |
 | BJRI BJ s Restaurants, Inc. |
| Sector: Services & Goods | |
| SubSector: Restaurants | |
| MarketCap: 183.67 Millions | |
| Recent Price: 33.54 Smart Investing & Trading Score: 47 | |
| Day Percent Change: -3.18% Day Change: -1.10 | |
| Week Change: -3.29% Year-to-date Change: -6.9% | |
| BJRI Links: Profile News Message Board | |
| Charts:- Daily , Weekly | |
| Add BJRI to Watchlist: View: Get Complete BJRI Trend Analysis ➞ | |
 | NC NACCO Industries, Inc. |
| Sector: Consumer Staples | |
| SubSector: Home Furnishings & Fixtures | |
| MarketCap: 179.835 Millions | |
| Recent Price: 31.49 Smart Investing & Trading Score: 50 | |
| Day Percent Change: -3.20% Day Change: -1.04 | |
| Week Change: -5.21% Year-to-date Change: -13.7% | |
| NC Links: Profile News Message Board | |
| Charts:- Daily , Weekly | |
| Add NC to Watchlist: View: Get Complete NC Trend Analysis ➞ | |
 | EVC Entravision Communications Corporation |
| Sector: Services & Goods | |
| SubSector: Broadcasting - TV | |
| MarketCap: 171.763 Millions | |
| Recent Price: 2.10 Smart Investing & Trading Score: 27 | |
| Day Percent Change: -3.23% Day Change: -0.07 | |
| Week Change: -6.67% Year-to-date Change: -49.6% | |
| EVC Links: Profile News Message Board | |
| Charts:- Daily , Weekly | |
| Add EVC to Watchlist: View: Get Complete EVC Trend Analysis ➞ | |
 | QSI Quantum-Si incorporated |
| Sector: Health Care | |
| SubSector: Biotechnology | |
| MarketCap: 256 Millions | |
| Recent Price: 1.78 Smart Investing & Trading Score: 73 | |
| Day Percent Change: -3.26% Day Change: -0.06 | |
| Week Change: -8.25% Year-to-date Change: -11.4% | |
| QSI Links: Profile News Message Board | |
| Charts:- Daily , Weekly | |
| Add QSI to Watchlist: View: Get Complete QSI Trend Analysis ➞ | |
 | LXRX Lexicon Pharmaceuticals, Inc. |
| Sector: Health Care | |
| SubSector: Biotechnology | |
| MarketCap: 251.185 Millions | |
| Recent Price: 1.77 Smart Investing & Trading Score: 57 | |
| Day Percent Change: -3.28% Day Change: -0.06 | |
| Week Change: 1.72% Year-to-date Change: 15.7% | |
| LXRX Links: Profile News Message Board | |
| Charts:- Daily , Weekly | |
| Add LXRX to Watchlist: View: Get Complete LXRX Trend Analysis ➞ | |
 | URGN UroGen Pharma Ltd. |
| Sector: Health Care | |
| SubSector: Biotechnology | |
| MarketCap: 373.485 Millions | |
| Recent Price: 13.40 Smart Investing & Trading Score: 0 | |
| Day Percent Change: -3.32% Day Change: -0.46 | |
| Week Change: -6.29% Year-to-date Change: -10.7% | |
| URGN Links: Profile News Message Board | |
| Charts:- Daily , Weekly | |
| Add URGN to Watchlist: View: Get Complete URGN Trend Analysis ➞ | |
 | ONL Orion Office REIT Inc. |
| Sector: Financials | |
| SubSector: REIT - Office | |
| MarketCap: 375 Millions | |
| Recent Price: 3.38 Smart Investing & Trading Score: 50 | |
| Day Percent Change: -3.43% Day Change: -0.12 | |
| Week Change: -3.29% Year-to-date Change: -40.9% | |
| ONL Links: Profile News Message Board | |
| Charts:- Daily , Weekly | |
| Add ONL to Watchlist: View: Get Complete ONL Trend Analysis ➞ | |
 | KRMD Repro Med Systems, Inc. |
| Sector: Health Care | |
| SubSector: Medical Instruments & Supplies | |
| MarketCap: 340.06 Millions | |
| Recent Price: 2.24 Smart Investing & Trading Score: 58 | |
| Day Percent Change: -3.45% Day Change: -0.08 | |
| Week Change: -3.45% Year-to-date Change: -8.8% | |
| KRMD Links: Profile News Message Board | |
| Charts:- Daily , Weekly | |
| Add KRMD to Watchlist: View: Get Complete KRMD Trend Analysis ➞ | |
 | ACNB ACNB Corporation |
| Sector: Financials | |
| SubSector: Regional - Southwest Banks | |
| MarketCap: 231.065 Millions | |
| Recent Price: 32.18 Smart Investing & Trading Score: 10 | |
| Day Percent Change: -3.48% Day Change: -1.16 | |
| Week Change: -3.19% Year-to-date Change: -28.1% | |
| ACNB Links: Profile News Message Board | |
| Charts:- Daily , Weekly | |
| Add ACNB to Watchlist: View: Get Complete ACNB Trend Analysis ➞ | |
 | CLAR Clarus Corporation |
| Sector: Consumer Staples | |
| SubSector: Sporting Goods | |
| MarketCap: 290.144 Millions | |
| Recent Price: 6.77 Smart Investing & Trading Score: 73 | |
| Day Percent Change: -3.49% Day Change: -0.25 | |
| Week Change: -7.39% Year-to-date Change: -1.8% | |
| CLAR Links: Profile News Message Board | |
| Charts:- Daily , Weekly | |
| Add CLAR to Watchlist: View: Get Complete CLAR Trend Analysis ➞ | |
 | PFIS Peoples Financial Services Corp. |
| Sector: Financials | |
| SubSector: Regional - Northeast Banks | |
| MarketCap: 305.499 Millions | |
| Recent Price: 37.90 Smart Investing & Trading Score: 25 | |
| Day Percent Change: -3.59% Day Change: -1.41 | |
| Week Change: -4.29% Year-to-date Change: -22.2% | |
| PFIS Links: Profile News Message Board | |
| Charts:- Daily , Weekly | |
| Add PFIS to Watchlist: View: Get Complete PFIS Trend Analysis ➞ | |
 | BRY Berry Corporation |
| Sector: Energy | |
| SubSector: Independent Oil & Gas | |
| MarketCap: 254.793 Millions | |
| Recent Price: 7.68 Smart Investing & Trading Score: 26 | |
| Day Percent Change: -3.64% Day Change: -0.29 | |
| Week Change: -4% Year-to-date Change: 9.3% | |
| BRY Links: Profile News Message Board | |
| Charts:- Daily , Weekly | |
| Add BRY to Watchlist: View: Get Complete BRY Trend Analysis ➞ | |
 | GPRO GoPro, Inc. |
| Sector: Consumer Staples | |
| SubSector: Photographic Equipment & Supplies | |
| MarketCap: 475.925 Millions | |
| Recent Price: 1.84 Smart Investing & Trading Score: 42 | |
| Day Percent Change: -3.66% Day Change: -0.07 | |
| Week Change: -4.17% Year-to-date Change: -47.0% | |
| GPRO Links: Profile News Message Board | |
| Charts:- Daily , Weekly | |
| Add GPRO to Watchlist: View: Get Complete GPRO Trend Analysis ➞ | |
 | OOMA Ooma, Inc. |
| Sector: Technology | |
| SubSector: Diversified Communication Services | |
| MarketCap: 222.064 Millions | |
| Recent Price: 6.88 Smart Investing & Trading Score: 10 | |
| Day Percent Change: -3.78% Day Change: -0.27 | |
| Week Change: -4.84% Year-to-date Change: -35.9% | |
| OOMA Links: Profile News Message Board | |
| Charts:- Daily , Weekly | |
| Add OOMA to Watchlist: View: Get Complete OOMA Trend Analysis ➞ | |
 | OBIO Orchestra BioMed Holdings, Inc. |
| Sector: Health Care | |
| SubSector: Biotechnology | |
| MarketCap: 271 Millions | |
| Recent Price: 4.98 Smart Investing & Trading Score: 47 | |
| Day Percent Change: -3.86% Day Change: -0.20 | |
| Week Change: 0.61% Year-to-date Change: -45.3% | |
| OBIO Links: Profile News Message Board | |
| Charts:- Daily , Weekly | |
| Add OBIO to Watchlist: View: Get Complete OBIO Trend Analysis ➞ | |
 | DC Dakota Gold Corp. |
| Sector: Materials | |
| SubSector: Gold | |
| MarketCap: 218 Millions | |
| Recent Price: 2.64 Smart Investing & Trading Score: 90 | |
| Day Percent Change: -4.00% Day Change: -0.11 | |
| Week Change: 9.09% Year-to-date Change: 1.5% | |
| DC Links: Profile News Message Board | |
| Charts:- Daily , Weekly | |
| Add DC to Watchlist: View: Get Complete DC Trend Analysis ➞ | |
 | TMDX TransMedics Group, Inc. |
| Sector: Health Care | |
| SubSector: Medical Appliances & Equipment | |
| MarketCap: 331.68 Millions | |
| Recent Price: 127.22 Smart Investing & Trading Score: 90 | |
| Day Percent Change: -4.10% Day Change: -5.44 | |
| Week Change: -0.6% Year-to-date Change: 61.2% | |
| TMDX Links: Profile News Message Board | |
| Charts:- Daily , Weekly | |
| Add TMDX to Watchlist: View: Get Complete TMDX Trend Analysis ➞ | |
| For tabular summary view of above stock list: Summary View ➞ 0 - 25 , 25 - 50 , 50 - 75 , 75 - 100 , 100 - 125 , 125 - 150 , 150 - 175 , 175 - 200 , 200 - 225 , 225 - 250 , 250 - 275 , 275 - 300 , 300 - 325 , 325 - 350 , 350 - 375 , 375 - 400 , 400 - 425 , 425 - 450 , 450 - 475 , 475 - 500 , 500 - 525 | ||
| Click To Change The Sort Order: By Market Cap or Company Size Performance: Year-to-date, Week and Day | |
| Select Chart Type: | ||
| Too many stocks? View smallcap stocks filtered by marketcap & sector |
| Marketcap: All SmallCap Stocks (default-no microcap), Large, Mid-Range, Small & MicroCap |
| Sector: Tech, Finance, Energy, Staples, Retail, Industrial, Materials, Utilities & Medical |
|
Best Stocks Today 12Stocks.com |
© 2024 12Stocks.com Terms & Conditions Privacy Contact Us
All Information Provided Only For Education And Not To Be Used For Investing or Trading. See Terms & Conditions


One More Thing ... Get Best Stocks Delivered Daily!
Never Ever Miss A Move With Our Top Ten Stocks Lists
Find Best Stocks In Any Market - Bull or Bear Market
Take A Peek At Our Top Ten Stocks Lists: Daily, Weekly, Year-to-Date & Top Trends
Find Best Stocks In Any Market - Bull or Bear Market
Take A Peek At Our Top Ten Stocks Lists: Daily, Weekly, Year-to-Date & Top Trends
Smallcap Stocks With Best Up Trends [0-bearish to 100-bullish]: Design [100], Ambac Financial[100], Summit [100], EverQuote [100], Zeta Global[100], Coca-Cola Consolidated[100], J & J Snack Foods[100], Sterling Construction[100], Vanda [100], CPI Card[100], Semrush [100]
Best Smallcap Stocks Year-to-Date:
CareMax [570.1%], Janux [472.36%], Viking [327.78%], Longboard [260.8%], Alpine Immune[239.34%], Bakkt [226.91%], Vera [190.7%], Super Micro[188.22%], Cullinan Oncology[187.89%], Avidity Biosciences[180.86%], Y-mAbs [152.49%] Best Smallcap Stocks This Week:
Perficient [52.32%], Thoughtworks Holding[34.22%], Trupanion [28.72%], DASAN Zhone[26.29%], Great Lakes[25.72%], Workhorse Group[24.5%], Design [23.42%], Ambac Financial[22.97%], P3 Health[22.36%], Outset Medical[21.09%], Summit [20.96%] Best Smallcap Stocks Daily:
Design [28.85%], Great Lakes[24.29%], Thoughtworks Holding[19.84%], Ambac Financial[19.31%], Summit [18.79%], EverQuote [18.40%], Origin Materials[18.38%], Zeta Global[18.35%], FibroGen [18.10%], Coca-Cola Consolidated[17.65%], Children s[16.44%]