
 Login Sign Up


| |||||
 |  | ||||

| 12Stocks.com Market Intelligence |
Best SmallCap Stocks
|
| In a hurry? Small Cap Stock Lists: Performance Trends Table, Stock Charts
Sort Small Cap stocks: Daily, Weekly, Year-to-Date, Market Cap & Trends. Filter Small Cap stocks list by sector: Show all, Tech, Finance, Energy, Staples, Retail, Industrial, Materials, Utilities and HealthCare Filter Small Cap stocks list by size: All Large Medium Small and MicroCap |
| 12Stocks.com Small Cap Stocks Performances & Trends Daily | |||||||||
|
|  The overall Smart Investing & Trading Score is 87 (0-bearish to 100-bullish) which puts Small Cap index in short term bullish trend. The Smart Investing & Trading Score from previous trading session is 82 and hence an improvement of trend.
| ||||||||
Here are the Smart Investing & Trading Scores of the most requested small cap stocks at 12Stocks.com (click stock name for detailed review):
|


| 12Stocks.com: Investing in Smallcap Index with Stocks | |
|
The following table helps investors and traders sort through current performance and trends (as measured by Smart Investing & Trading Score) of various
stocks in the Smallcap Index. Quick View: Move mouse or cursor over stock symbol (ticker) to view short-term technical chart and over stock name to view long term chart. Click on  to add stock symbol to your watchlist and to add stock symbol to your watchlist and  to view watchlist. Click on any ticker or stock name for detailed market intelligence report for that stock. to view watchlist. Click on any ticker or stock name for detailed market intelligence report for that stock. |
12Stocks.com Performance of Stocks in Smallcap Index
| Ticker | Stock Name | Watchlist | Category | Recent Price | Smart Investing & Trading Score | Change % | YTD Change% |
| CRAI | CRA |   | Services & Goods | 163.31 | 100 | 1.59 | 65.21% |
| DXPE | DXP Enterprises | | Services & Goods | 54.21 | 90 | 1.59 | 60.86% |
| FF | FutureFuel | | Materials | 5.46 | 32 | 1.58 | -10.12% |
| OSUR | OraSure | | Health Care | 5.59 | 64 | 1.55 | -31.89% |
| THR | Thermon Group | | Industrials | 33.63 | 95 | 1.55 | 3.27% |
| OSW | OneSpaWorld | | Services & Goods | 14.94 | 88 | 1.46 | 5.96% |
| RBBN | Ribbon | | Technology | 3.15 | 63 | 1.45 | 8.79% |
| AROW | Arrow Financial | | Financials | 23.95 | 64 | 1.44 | -14.28% |
| DVAX | Dynavax | | Health Care | 11.81 | 50 | 1.42 | -15.56% |
| HTBI | HomeTrust Bancshares | | Financials | 27.23 | 95 | 1.42 | 1.15% |
| NSSC | Napco Security | | Services & Goods | 45.94 | 100 | 1.40 | 34.12% |
| ARCT | Arcturus | | Health Care | 27.69 | 57 | 1.39 | -12.18% |
| FCBC | First Community | | Financials | 35.97 | 100 | 1.38 | -3.05% |
| MNKD | MannKind | | Health Care | 4.46 | 95 | 1.36 | 22.53% |
| SWIM | Latham Group | | Industrials | 2.98 | 37 | 1.36 | 12.88% |
| IIIN | Insteel Industries | | Materials | 33.91 | 57 | 1.34 | -11.44% |
| UTI | Universal Technical | | Services & Goods | 16.73 | 70 | 1.30 | 33.67% |
| UTMD | Utah Medical | | Health Care | 70.29 | 87 | 1.30 | -16.54% |
| IMXI | Money | | Services & Goods | 19.60 | 30 | 1.29 | -11.27% |
| FPI | Farmland Partners | | Financials | 11.10 | 42 | 1.28 | -11.06% |
| SMBK | SmartFinancial | | Financials | 22.52 | 95 | 1.28 | -8.06% |
| WNC | Wabash National | | Consumer Staples | 23.37 | 32 | 1.26 | -8.78% |
| GIII | G-III Apparel | | Consumer Staples | 28.94 | 59 | 1.26 | -14.83% |
| IPI | Intrepid Potash | | Materials | 21.38 | 62 | 1.21 | -10.53% |
| BTAI | BioXcel | | Health Care | 2.54 | 20 | 1.20 | -13.90% |
| For chart view version of above stock list: Chart View ➞ 0 - 25 , 25 - 50 , 50 - 75 , 75 - 100 , 100 - 125 , 125 - 150 , 150 - 175 , 175 - 200 , 200 - 225 , 225 - 250 , 250 - 275 , 275 - 300 , 300 - 325 , 325 - 350 , 350 - 375 , 375 - 400 , 400 - 425 , 425 - 450 , 450 - 475 , 475 - 500 , 500 - 525 | ||
 | Click To Change The Sort Order: By Market Cap or Company Size Performance: Year-to-date, Week and Day |  |
| Too many stocks? View smallcap stocks filtered by marketcap & sector |
| Marketcap: All SmallCap Stocks (default-no microcap), Large, Mid-Range, Small |
| Smallcap Sector: Tech, Finance, Energy, Staples, Retail, Industrial, Materials, & Medical |
|
Get the most comprehensive stock market coverage daily at 12Stocks.com ➞ Best Stocks Today ➞ Best Stocks Weekly ➞ Best Stocks Year-to-Date ➞ Best Stocks Trends ➞  Best Stocks Today 12Stocks.com Best Nasdaq Stocks ➞ Best S&P 500 Stocks ➞ Best Tech Stocks ➞ Best Biotech Stocks ➞ |
| Detailed Overview of SmallCap Stocks |
| SmallCap Technical Overview, Leaders & Laggards, Top SmallCap ETF Funds & Detailed SmallCap Stocks List, Charts, Trends & More |
| Smallcap: Technical Analysis, Trends & YTD Performance | |
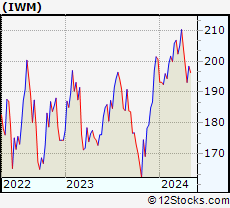
| SmallCap segment as represented by
IWM, an exchange-traded fund [ETF], holds basket of thousands of smallcap stocks from across all major sectors of the US stock market. The smallcap index (contains stocks like Riverbed & Sotheby's) is up by 2.24% and is currently underperforming the overall market by -5.83% year-to-date. Below is a quick view of technical charts and trends: | |
 IWM Weekly Chart |
|
| Long Term Trend: Very Good | |
| Medium Term Trend: Very Good | |
 IWM Daily Chart |
|
| Short Term Trend: Very Good | |
| Overall Trend Score: 87 | |
| YTD Performance: 2.24% | |
| **Trend Scores & Views Are Only For Educational Purposes And Not For Investing | |
| 12Stocks.com: Top Performing Small Cap Index Stocks | ||||||||||||||||||||||||||||||||||||||||||||||||
 The top performing Small Cap Index stocks year to date are
Now, more recently, over last week, the top performing Small Cap Index stocks on the move are


|
||||||||||||||||||||||||||||||||||||||||||||||||
| 12Stocks.com: Investing in Smallcap Index using Exchange Traded Funds | |
|
The following table shows list of key exchange traded funds (ETF) that
help investors track Smallcap index. The following list also includes leveraged ETF funds that track twice or thrice the daily returns of Smallcap indices. Short or inverse ETF funds move in the opposite direction to the index they track and are useful during market pullbacks or during bear markets. Quick View: Move mouse or cursor over ETF symbol (ticker) to view short-term technical chart and over ETF name to view long term chart. Click on ticker or stock name for detailed view. Click on to add stock symbol to your watchlist and to view watchlist. |
12Stocks.com List of ETFs that track Smallcap Index
| Ticker | ETF Name | Watchlist | Recent Price | Smart Investing & Trading Score | Change % | Week % | Year-to-date % |
| IWM | iShares Russell 2000 | | 205.21 | 87 | 0.34 | 1.64 | 2.24% |
| IJR | iShares Core S&P Small-Cap | | 108.92 | 100 | 0.61 | 1.67 | 0.62% |
| VTWO | Vanguard Russell 2000 ETF | | 82.84 | 82 | 0.22 | 1.51 | 2.15% |
| IWN | iShares Russell 2000 Value | | 156.07 | 100 | 0.27 | 1.21 | 0.48% |
| IWO | iShares Russell 2000 Growth | | 262.32 | 69 | 0.50 | 2.12 | 4% |
| IJS | iShares S&P Small-Cap 600 Value | | 100.02 | 82 | 0.27 | 1.32 | -2.96% |
| XSLV | PowerShares S&P SmallCap Low Volatil ETF | | 44.03 | 100 | 1.02 | 1.86 | -0.28% |
| IJT | iShares S&P Small-Cap 600 Growth | | 129.88 | 95 | 0.59 | 1.66 | 3.79% |
| SDD | ProShares UltraShort SmallCap600 | | 18.22 | 10 | -1.10 | -3.33 | -1.13% |
| SAA | ProShares Ultra SmallCap600 | | 24.47 | 95 | 1.49 | 3.73 | -1.92% |
| SMLV | SPDR SSGA US Small Cap Low Volatil ETF | | 110.38 | 82 | -0.19 | 0.63 | -1.9% |
| SBB | ProShares Short SmallCap600 | | 16.04 | 13 | -0.04 | -0.72 | 0.72% |
| 12Stocks.com: Charts, Trends, Fundamental Data and Performances of SmallCap Stocks | |
|
We now take in-depth look at all SmallCap stocks including charts, multi-period performances and overall trends (as measured by Smart Investing & Trading Score). One can sort SmallCap stocks (click link to choose) by Daily, Weekly and by Year-to-Date performances. Also, one can sort by size of the company or by market capitalization. |
| Select Your Default Chart Type: | |||||
| |||||
| Click on stock symbol or name for detailed view. Click on to add stock symbol to your watchlist and to view watchlist. Quick View: Move mouse or cursor over "Daily" to quickly view daily technical stock chart and over "Weekly" to view weekly technical stock chart. | |||||

 | CRAI CRA International, Inc. |
| Sector: Services & Goods | |
| SubSector: Management Services | |
| MarketCap: 209.645 Millions | |
| Recent Price: 163.31 Smart Investing & Trading Score: 100 | |
| Day Percent Change: 1.59% Day Change: 2.56 | |
| Week Change: 6.17% Year-to-date Change: 65.2% | |
| CRAI Links: Profile News Message Board | |
| Charts:- Daily , Weekly | |
| Add CRAI to Watchlist: View: Get Complete CRAI Trend Analysis ➞ | |
 | DXPE DXP Enterprises, Inc. |
| Sector: Services & Goods | |
| SubSector: Industrial Equipment Wholesale | |
| MarketCap: 243.758 Millions | |
| Recent Price: 54.21 Smart Investing & Trading Score: 90 | |
| Day Percent Change: 1.59% Day Change: 0.85 | |
| Week Change: 3.59% Year-to-date Change: 60.9% | |
| DXPE Links: Profile News Message Board | |
| Charts:- Daily , Weekly | |
| Add DXPE to Watchlist: View: Get Complete DXPE Trend Analysis ➞ | |
 | FF FutureFuel Corp. |
| Sector: Materials | |
| SubSector: Chemicals - Major Diversified | |
| MarketCap: 450.736 Millions | |
| Recent Price: 5.46 Smart Investing & Trading Score: 32 | |
| Day Percent Change: 1.58% Day Change: 0.08 | |
| Week Change: 1.58% Year-to-date Change: -10.1% | |
| FF Links: Profile News Message Board | |
| Charts:- Daily , Weekly | |
| Add FF to Watchlist: View: Get Complete FF Trend Analysis ➞ | |
 | OSUR OraSure Technologies, Inc. |
| Sector: Health Care | |
| SubSector: Medical Instruments & Supplies | |
| MarketCap: 468.26 Millions | |
| Recent Price: 5.59 Smart Investing & Trading Score: 64 | |
| Day Percent Change: 1.55% Day Change: 0.08 | |
| Week Change: 1.73% Year-to-date Change: -31.9% | |
| OSUR Links: Profile News Message Board | |
| Charts:- Daily , Weekly | |
| Add OSUR to Watchlist: View: Get Complete OSUR Trend Analysis ➞ | |
 | THR Thermon Group Holdings, Inc. |
| Sector: Industrials | |
| SubSector: Diversified Machinery | |
| MarketCap: 492.816 Millions | |
| Recent Price: 33.63 Smart Investing & Trading Score: 95 | |
| Day Percent Change: 1.55% Day Change: 0.52 | |
| Week Change: 2.73% Year-to-date Change: 3.3% | |
| THR Links: Profile News Message Board | |
| Charts:- Daily , Weekly | |
| Add THR to Watchlist: View: Get Complete THR Trend Analysis ➞ | |
 | OSW OneSpaWorld Holdings Limited |
| Sector: Services & Goods | |
| SubSector: Resorts & Casinos | |
| MarketCap: 228.394 Millions | |
| Recent Price: 14.94 Smart Investing & Trading Score: 88 | |
| Day Percent Change: 1.46% Day Change: 0.21 | |
| Week Change: 0.67% Year-to-date Change: 6.0% | |
| OSW Links: Profile News Message Board | |
| Charts:- Daily , Weekly | |
| Add OSW to Watchlist: View: Get Complete OSW Trend Analysis ➞ | |
 | RBBN Ribbon Communications Inc. |
| Sector: Technology | |
| SubSector: Telecom Services - Domestic | |
| MarketCap: 284.577 Millions | |
| Recent Price: 3.15 Smart Investing & Trading Score: 63 | |
| Day Percent Change: 1.45% Day Change: 0.04 | |
| Week Change: -0.47% Year-to-date Change: 8.8% | |
| RBBN Links: Profile News Message Board | |
| Charts:- Daily , Weekly | |
| Add RBBN to Watchlist: View: Get Complete RBBN Trend Analysis ➞ | |
 | AROW Arrow Financial Corporation |
| Sector: Financials | |
| SubSector: Regional - Northeast Banks | |
| MarketCap: 413.999 Millions | |
| Recent Price: 23.95 Smart Investing & Trading Score: 64 | |
| Day Percent Change: 1.44% Day Change: 0.34 | |
| Week Change: 1.23% Year-to-date Change: -14.3% | |
| AROW Links: Profile News Message Board | |
| Charts:- Daily , Weekly | |
| Add AROW to Watchlist: View: Get Complete AROW Trend Analysis ➞ | |
 | DVAX Dynavax Technologies Corporation |
| Sector: Health Care | |
| SubSector: Biotechnology | |
| MarketCap: 276.885 Millions | |
| Recent Price: 11.81 Smart Investing & Trading Score: 50 | |
| Day Percent Change: 1.42% Day Change: 0.16 | |
| Week Change: 0.55% Year-to-date Change: -15.6% | |
| DVAX Links: Profile News Message Board | |
| Charts:- Daily , Weekly | |
| Add DVAX to Watchlist: View: Get Complete DVAX Trend Analysis ➞ | |
 | HTBI HomeTrust Bancshares, Inc. |
| Sector: Financials | |
| SubSector: Regional - Northeast Banks | |
| MarketCap: 238.899 Millions | |
| Recent Price: 27.23 Smart Investing & Trading Score: 95 | |
| Day Percent Change: 1.42% Day Change: 0.38 | |
| Week Change: 2.21% Year-to-date Change: 1.2% | |
| HTBI Links: Profile News Message Board | |
| Charts:- Daily , Weekly | |
| Add HTBI to Watchlist: View: Get Complete HTBI Trend Analysis ➞ | |
 | NSSC Napco Security Technologies, Inc. |
| Sector: Services & Goods | |
| SubSector: Security & Protection Services | |
| MarketCap: 339.103 Millions | |
| Recent Price: 45.94 Smart Investing & Trading Score: 100 | |
| Day Percent Change: 1.40% Day Change: 0.64 | |
| Week Change: 8.16% Year-to-date Change: 34.1% | |
| NSSC Links: Profile News Message Board | |
| Charts:- Daily , Weekly | |
| Add NSSC to Watchlist: View: Get Complete NSSC Trend Analysis ➞ | |
 | ARCT Arcturus Therapeutics Holdings Inc. |
| Sector: Health Care | |
| SubSector: Biotechnology | |
| MarketCap: 241.385 Millions | |
| Recent Price: 27.69 Smart Investing & Trading Score: 57 | |
| Day Percent Change: 1.39% Day Change: 0.38 | |
| Week Change: 1.54% Year-to-date Change: -12.2% | |
| ARCT Links: Profile News Message Board | |
| Charts:- Daily , Weekly | |
| Add ARCT to Watchlist: View: Get Complete ARCT Trend Analysis ➞ | |
 | FCBC First Community Bankshares, Inc. |
| Sector: Financials | |
| SubSector: Regional - Mid-Atlantic Banks | |
| MarketCap: 393.459 Millions | |
| Recent Price: 35.97 Smart Investing & Trading Score: 100 | |
| Day Percent Change: 1.38% Day Change: 0.49 | |
| Week Change: 1.3% Year-to-date Change: -3.1% | |
| FCBC Links: Profile News Message Board | |
| Charts:- Daily , Weekly | |
| Add FCBC to Watchlist: View: Get Complete FCBC Trend Analysis ➞ | |
 | MNKD MannKind Corporation |
| Sector: Health Care | |
| SubSector: Biotechnology | |
| MarketCap: 250.885 Millions | |
| Recent Price: 4.46 Smart Investing & Trading Score: 95 | |
| Day Percent Change: 1.36% Day Change: 0.06 | |
| Week Change: 1.59% Year-to-date Change: 22.5% | |
| MNKD Links: Profile News Message Board | |
| Charts:- Daily , Weekly | |
| Add MNKD to Watchlist: View: Get Complete MNKD Trend Analysis ➞ | |
 | SWIM Latham Group, Inc. |
| Sector: Industrials | |
| SubSector: Building Products & Equipment | |
| MarketCap: 388 Millions | |
| Recent Price: 2.98 Smart Investing & Trading Score: 37 | |
| Day Percent Change: 1.36% Day Change: 0.04 | |
| Week Change: 9.16% Year-to-date Change: 12.9% | |
| SWIM Links: Profile News Message Board | |
| Charts:- Daily , Weekly | |
| Add SWIM to Watchlist: View: Get Complete SWIM Trend Analysis ➞ | |
 | IIIN Insteel Industries, Inc. |
| Sector: Materials | |
| SubSector: Steel & Iron | |
| MarketCap: 269.488 Millions | |
| Recent Price: 33.91 Smart Investing & Trading Score: 57 | |
| Day Percent Change: 1.34% Day Change: 0.45 | |
| Week Change: 2.57% Year-to-date Change: -11.4% | |
| IIIN Links: Profile News Message Board | |
| Charts:- Daily , Weekly | |
| Add IIIN to Watchlist: View: Get Complete IIIN Trend Analysis ➞ | |
 | UTI Universal Technical Institute, Inc. |
| Sector: Services & Goods | |
| SubSector: Education & Training Services | |
| MarketCap: 163.506 Millions | |
| Recent Price: 16.73 Smart Investing & Trading Score: 70 | |
| Day Percent Change: 1.30% Day Change: 0.21 | |
| Week Change: 7.21% Year-to-date Change: 33.7% | |
| UTI Links: Profile News Message Board | |
| Charts:- Daily , Weekly | |
| Add UTI to Watchlist: View: Get Complete UTI Trend Analysis ➞ | |
 | UTMD Utah Medical Products, Inc. |
| Sector: Health Care | |
| SubSector: Medical Instruments & Supplies | |
| MarketCap: 285.86 Millions | |
| Recent Price: 70.29 Smart Investing & Trading Score: 87 | |
| Day Percent Change: 1.30% Day Change: 0.90 | |
| Week Change: 3.49% Year-to-date Change: -16.5% | |
| UTMD Links: Profile News Message Board | |
| Charts:- Daily , Weekly | |
| Add UTMD to Watchlist: View: Get Complete UTMD Trend Analysis ➞ | |
 | IMXI International Money Express, Inc. |
| Sector: Services & Goods | |
| SubSector: Business Services | |
| MarketCap: 326.582 Millions | |
| Recent Price: 19.60 Smart Investing & Trading Score: 30 | |
| Day Percent Change: 1.29% Day Change: 0.25 | |
| Week Change: -2.73% Year-to-date Change: -11.3% | |
| IMXI Links: Profile News Message Board | |
| Charts:- Daily , Weekly | |
| Add IMXI to Watchlist: View: Get Complete IMXI Trend Analysis ➞ | |
 | FPI Farmland Partners Inc. |
| Sector: Financials | |
| SubSector: REIT - Diversified | |
| MarketCap: 182.653 Millions | |
| Recent Price: 11.10 Smart Investing & Trading Score: 42 | |
| Day Percent Change: 1.28% Day Change: 0.14 | |
| Week Change: -0.98% Year-to-date Change: -11.1% | |
| FPI Links: Profile News Message Board | |
| Charts:- Daily , Weekly | |
| Add FPI to Watchlist: View: Get Complete FPI Trend Analysis ➞ | |
 | SMBK SmartFinancial, Inc. |
| Sector: Financials | |
| SubSector: Regional - Southeast Banks | |
| MarketCap: 174.035 Millions | |
| Recent Price: 22.52 Smart Investing & Trading Score: 95 | |
| Day Percent Change: 1.28% Day Change: 0.29 | |
| Week Change: 1.74% Year-to-date Change: -8.1% | |
| SMBK Links: Profile News Message Board | |
| Charts:- Daily , Weekly | |
| Add SMBK to Watchlist: View: Get Complete SMBK Trend Analysis ➞ | |
 | WNC Wabash National Corporation |
| Sector: Consumer Staples | |
| SubSector: Trucks & Other Vehicles | |
| MarketCap: 482.597 Millions | |
| Recent Price: 23.37 Smart Investing & Trading Score: 32 | |
| Day Percent Change: 1.26% Day Change: 0.29 | |
| Week Change: 0.13% Year-to-date Change: -8.8% | |
| WNC Links: Profile News Message Board | |
| Charts:- Daily , Weekly | |
| Add WNC to Watchlist: View: Get Complete WNC Trend Analysis ➞ | |
 | GIII G-III Apparel Group, Ltd. |
| Sector: Consumer Staples | |
| SubSector: Textile - Apparel Clothing | |
| MarketCap: 354.365 Millions | |
| Recent Price: 28.94 Smart Investing & Trading Score: 59 | |
| Day Percent Change: 1.26% Day Change: 0.36 | |
| Week Change: 1.22% Year-to-date Change: -14.8% | |
| GIII Links: Profile News Message Board | |
| Charts:- Daily , Weekly | |
| Add GIII to Watchlist: View: Get Complete GIII Trend Analysis ➞ | |
 | IPI Intrepid Potash, Inc. |
| Sector: Materials | |
| SubSector: Agricultural Chemicals | |
| MarketCap: 160.329 Millions | |
| Recent Price: 21.38 Smart Investing & Trading Score: 62 | |
| Day Percent Change: 1.21% Day Change: 0.25 | |
| Week Change: 2.86% Year-to-date Change: -10.5% | |
| IPI Links: Profile News Message Board | |
| Charts:- Daily , Weekly | |
| Add IPI to Watchlist: View: Get Complete IPI Trend Analysis ➞ | |
 | BTAI BioXcel Therapeutics, Inc. |
| Sector: Health Care | |
| SubSector: Biotechnology | |
| MarketCap: 487.485 Millions | |
| Recent Price: 2.54 Smart Investing & Trading Score: 20 | |
| Day Percent Change: 1.20% Day Change: 0.03 | |
| Week Change: -1.17% Year-to-date Change: -13.9% | |
| BTAI Links: Profile News Message Board | |
| Charts:- Daily , Weekly | |
| Add BTAI to Watchlist: View: Get Complete BTAI Trend Analysis ➞ | |
| For tabular summary view of above stock list: Summary View ➞ 0 - 25 , 25 - 50 , 50 - 75 , 75 - 100 , 100 - 125 , 125 - 150 , 150 - 175 , 175 - 200 , 200 - 225 , 225 - 250 , 250 - 275 , 275 - 300 , 300 - 325 , 325 - 350 , 350 - 375 , 375 - 400 , 400 - 425 , 425 - 450 , 450 - 475 , 475 - 500 , 500 - 525 | ||
| Click To Change The Sort Order: By Market Cap or Company Size Performance: Year-to-date, Week and Day | |
| Select Chart Type: | ||
| Too many stocks? View smallcap stocks filtered by marketcap & sector |
| Marketcap: All SmallCap Stocks (default-no microcap), Large, Mid-Range, Small & MicroCap |
| Sector: Tech, Finance, Energy, Staples, Retail, Industrial, Materials, Utilities & Medical |
|
Best Stocks Today 12Stocks.com |
© 2024 12Stocks.com Terms & Conditions Privacy Contact Us
All Information Provided Only For Education And Not To Be Used For Investing or Trading. See Terms & Conditions


One More Thing ... Get Best Stocks Delivered Daily!
Never Ever Miss A Move With Our Top Ten Stocks Lists
Find Best Stocks In Any Market - Bull or Bear Market
Take A Peek At Our Top Ten Stocks Lists: Daily, Weekly, Year-to-Date & Top Trends
Find Best Stocks In Any Market - Bull or Bear Market
Take A Peek At Our Top Ten Stocks Lists: Daily, Weekly, Year-to-Date & Top Trends
Smallcap Stocks With Best Up Trends [0-bearish to 100-bullish]: Design [100], Origin Materials[100], Ambac Financial[100], Coca-Cola Consolidated[100], Zeta Global[100], EverQuote [100], Sterling Construction[100], J & J Snack Foods[100], Summit [100], Bandwidth [100], Vanda [100]
Best Smallcap Stocks Year-to-Date:
Janux [473.85%], Viking [322.84%], Longboard [262.68%], Alpine Immune[239.34%], Bakkt [228.25%], Super Micro[187.4%], Cullinan Oncology[185.34%], Vera [181.98%], Avidity Biosciences[176.83%], Y-mAbs [155.72%], Arcutis Bio[146.44%] Best Smallcap Stocks This Week:
Perficient [52.43%], Thoughtworks Holding[35.11%], Trupanion [28.46%], DASAN Zhone[26.29%], Great Lakes[25%], Lineage Cell[24.06%], Workhorse Group[23.69%], Ambac Financial[23.52%], Bandwidth [22.95%], Aceto [22.07%], P3 Health[21.66%] Best Smallcap Stocks Daily:
Design [25.96%], Great Lakes[23.58%], Thoughtworks Holding[20.63%], Origin Materials[20.53%], Ambac Financial[19.84%], Coca-Cola Consolidated[18.33%], Zeta Global[18.28%], EverQuote [18.19%], Children s[16.19%], Sterling Construction[16.02%], J & J Snack Foods[15.85%]