
 Login Sign Up


| |||||
 |  | ||||

| 12Stocks.com Market Intelligence |
Best SmallCap Stocks
|
| In a hurry? Small Cap Stock Lists: Performance Trends Table, Stock Charts
Sort Small Cap stocks: Daily, Weekly, Year-to-Date, Market Cap & Trends. Filter Small Cap stocks list by sector: Show all, Tech, Finance, Energy, Staples, Retail, Industrial, Materials, Utilities and HealthCare Filter Small Cap stocks list by size: All Large Medium Small and MicroCap |
| 12Stocks.com Small Cap Stocks Performances & Trends Daily | |||||||||
|
|  The overall Smart Investing & Trading Score is 82 (0-bearish to 100-bullish) which puts Small Cap index in short term bullish trend. The Smart Investing & Trading Score from previous trading session is 69 and hence an improvement of trend.
| ||||||||
Here are the Smart Investing & Trading Scores of the most requested small cap stocks at 12Stocks.com (click stock name for detailed review):
|


| 12Stocks.com: Investing in Smallcap Index with Stocks | |
|
The following table helps investors and traders sort through current performance and trends (as measured by Smart Investing & Trading Score) of various
stocks in the Smallcap Index. Quick View: Move mouse or cursor over stock symbol (ticker) to view short-term technical chart and over stock name to view long term chart. Click on  to add stock symbol to your watchlist and to add stock symbol to your watchlist and  to view watchlist. Click on any ticker or stock name for detailed market intelligence report for that stock. to view watchlist. Click on any ticker or stock name for detailed market intelligence report for that stock. |
12Stocks.com Performance of Stocks in Smallcap Index
| Ticker | Stock Name | Watchlist | Category | Recent Price | Smart Investing & Trading Score | Change % | YTD Change% |
| SPOK | Spok |   | Technology | 14.33 | 0 | -0.35 | -7.43% |
| BRY | Berry | | Energy | 7.97 | 54 | -0.38 | 13.37% |
| TSBK | Timberland Bancorp | | Financials | 26.00 | 68 | -0.38 | -17.36% |
| MSBI | Midland States | | Financials | 23.66 | 43 | -0.38 | -14.15% |
| PLYM | Plymouth Industrial | | Financials | 20.48 | 25 | -0.39 | -14.91% |
| WOW | WideOpenWest | | Technology | 4.84 | 100 | -0.41 | 19.51% |
| CLNE | Clean Energy | | Utilities | 2.37 | 69 | -0.42 | -38.12% |
| MOFG | MidWestOne Financial | | Financials | 21.26 | 62 | -0.42 | -21.00% |
| GRBK | Green Brick | | Financials | 56.40 | 47 | -0.42 | 8.59% |
| USCB | USCB Financial | | Financials | 11.86 | 88 | -0.42 | -3.42% |
| GPMT | Granite Point | | Financials | 4.40 | 35 | -0.45 | -25.93% |
| EGAN | eGain | | Technology | 6.36 | 76 | -0.47 | -23.65% |
| WEYS | Weyco Group | | Consumer Staples | 29.14 | 18 | -0.48 | -7.08% |
| RAPT | RAPT | | Health Care | 8.29 | 69 | -0.48 | -66.64% |
| CEIX | CONSOL Energy | | Materials | 83.48 | 50 | -0.49 | -16.96% |
| FISI | Financial Institutions | | Financials | 17.76 | 57 | -0.50 | -16.62% |
| FSBC | Five Star | | Financials | 22.02 | 55 | -0.50 | -15.89% |
| GPRO | GoPro | | Consumer Staples | 1.91 | 67 | -0.52 | -44.96% |
| BOOT | Boot Barn | | Services & Goods | 104.75 | 80 | -0.52 | 36.46% |
| GRTS | Gritstone Oncology | | Health Care | 0.96 | 59 | -0.58 | -53.08% |
| MCRI | Monarch Casino | | Services & Goods | 68.60 | 47 | -0.59 | -0.80% |
| JANX | Janux | | Health Care | 62.24 | 88 | -0.60 | 479.25% |
| SPWH | Sportsman s | | Consumer Staples | 3.19 | 20 | -0.62 | -25.12% |
| OSG | Overseas Shipholding | | Transports | 6.28 | 73 | -0.63 | 19.17% |
| ADTN | ADTRAN | | Technology | 4.71 | 60 | -0.63 | -35.83% |
| For chart view version of above stock list: Chart View ➞ 0 - 25 , 25 - 50 , 50 - 75 , 75 - 100 , 100 - 125 , 125 - 150 , 150 - 175 , 175 - 200 , 200 - 225 , 225 - 250 , 250 - 275 , 275 - 300 , 300 - 325 , 325 - 350 , 350 - 375 , 375 - 400 , 400 - 425 , 425 - 450 , 450 - 475 , 475 - 500 , 500 - 525 | ||
 | Click To Change The Sort Order: By Market Cap or Company Size Performance: Year-to-date, Week and Day |  |
| Too many stocks? View smallcap stocks filtered by marketcap & sector |
| Marketcap: All SmallCap Stocks (default-no microcap), Large, Mid-Range, Small |
| Smallcap Sector: Tech, Finance, Energy, Staples, Retail, Industrial, Materials, & Medical |
|
Get the most comprehensive stock market coverage daily at 12Stocks.com ➞ Best Stocks Today ➞ Best Stocks Weekly ➞ Best Stocks Year-to-Date ➞ Best Stocks Trends ➞  Best Stocks Today 12Stocks.com Best Nasdaq Stocks ➞ Best S&P 500 Stocks ➞ Best Tech Stocks ➞ Best Biotech Stocks ➞ |
| Detailed Overview of SmallCap Stocks |
| SmallCap Technical Overview, Leaders & Laggards, Top SmallCap ETF Funds & Detailed SmallCap Stocks List, Charts, Trends & More |
| Smallcap: Technical Analysis, Trends & YTD Performance | |
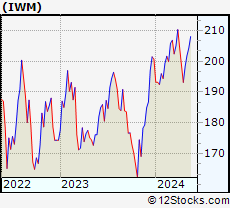
| SmallCap segment as represented by
IWM, an exchange-traded fund [ETF], holds basket of thousands of smallcap stocks from across all major sectors of the US stock market. The smallcap index (contains stocks like Riverbed & Sotheby's) is up by 1.89% and is currently underperforming the overall market by -6.13% year-to-date. Below is a quick view of technical charts and trends: | |
 IWM Weekly Chart |
|
| Long Term Trend: Very Good | |
| Medium Term Trend: Very Good | |
 IWM Daily Chart |
|
| Short Term Trend: Very Good | |
| Overall Trend Score: 82 | |
| YTD Performance: 1.89% | |
| **Trend Scores & Views Are Only For Educational Purposes And Not For Investing | |
| 12Stocks.com: Top Performing Small Cap Index Stocks | ||||||||||||||||||||||||||||||||||||||||||||||||
 The top performing Small Cap Index stocks year to date are
Now, more recently, over last week, the top performing Small Cap Index stocks on the move are


|
||||||||||||||||||||||||||||||||||||||||||||||||
| 12Stocks.com: Investing in Smallcap Index using Exchange Traded Funds | |
|
The following table shows list of key exchange traded funds (ETF) that
help investors track Smallcap index. The following list also includes leveraged ETF funds that track twice or thrice the daily returns of Smallcap indices. Short or inverse ETF funds move in the opposite direction to the index they track and are useful during market pullbacks or during bear markets. Quick View: Move mouse or cursor over ETF symbol (ticker) to view short-term technical chart and over ETF name to view long term chart. Click on ticker or stock name for detailed view. Click on to add stock symbol to your watchlist and to view watchlist. |
12Stocks.com List of ETFs that track Smallcap Index
| Ticker | ETF Name | Watchlist | Recent Price | Smart Investing & Trading Score | Change % | Week % | Year-to-date % |
| IWM | iShares Russell 2000 | | 204.51 | 82 | 1.29 | 1.29 | 1.89% |
| IJR | iShares Core S&P Small-Cap | | 108.26 | 100 | 1.05 | 1.05 | 0.01% |
| VTWO | Vanguard Russell 2000 ETF | | 82.66 | 82 | 1.29 | 1.29 | 1.92% |
| IWN | iShares Russell 2000 Value | | 155.65 | 100 | 0.93 | 0.93 | 0.21% |
| IWO | iShares Russell 2000 Growth | | 261.01 | 69 | 1.61 | 1.61 | 3.49% |
| IJS | iShares S&P Small-Cap 600 Value | | 99.75 | 69 | 1.04 | 1.04 | -3.22% |
| IJT | iShares S&P Small-Cap 600 Growth | | 129.12 | 90 | 1.06 | 1.06 | 3.18% |
| XSLV | PowerShares S&P SmallCap Low Volatil ETF | | 43.58 | 87 | 0.83 | 0.83 | -1.29% |
| SAA | ProShares Ultra SmallCap600 | | 24.11 | 82 | 2.20 | 2.2 | -3.37% |
| SDD | ProShares UltraShort SmallCap600 | | 18.42 | 10 | -2.26 | -2.26 | -0.04% |
| SBB | ProShares Short SmallCap600 | | 16.05 | 13 | -0.67 | -0.67 | 0.76% |
| SMLV | SPDR SSGA US Small Cap Low Volatil ETF | | 110.59 | 100 | 0.83 | 0.83 | -1.72% |
| 12Stocks.com: Charts, Trends, Fundamental Data and Performances of SmallCap Stocks | |
|
We now take in-depth look at all SmallCap stocks including charts, multi-period performances and overall trends (as measured by Smart Investing & Trading Score). One can sort SmallCap stocks (click link to choose) by Daily, Weekly and by Year-to-Date performances. Also, one can sort by size of the company or by market capitalization. |
| Select Your Default Chart Type: | |||||
| |||||
| Click on stock symbol or name for detailed view. Click on to add stock symbol to your watchlist and to view watchlist. Quick View: Move mouse or cursor over "Daily" to quickly view daily technical stock chart and over "Weekly" to view weekly technical stock chart. | |||||

 | SPOK Spok Holdings, Inc. |
| Sector: Technology | |
| SubSector: Wireless Communications | |
| MarketCap: 220.827 Millions | |
| Recent Price: 14.33 Smart Investing & Trading Score: 0 | |
| Day Percent Change: -0.35% Day Change: -0.05 | |
| Week Change: -0.35% Year-to-date Change: -7.4% | |
| SPOK Links: Profile News Message Board | |
| Charts:- Daily , Weekly | |
| Add SPOK to Watchlist: View: Get Complete SPOK Trend Analysis ➞ | |
 | BRY Berry Corporation |
| Sector: Energy | |
| SubSector: Independent Oil & Gas | |
| MarketCap: 254.793 Millions | |
| Recent Price: 7.97 Smart Investing & Trading Score: 54 | |
| Day Percent Change: -0.38% Day Change: -0.03 | |
| Week Change: -0.38% Year-to-date Change: 13.4% | |
| BRY Links: Profile News Message Board | |
| Charts:- Daily , Weekly | |
| Add BRY to Watchlist: View: Get Complete BRY Trend Analysis ➞ | |
 | TSBK Timberland Bancorp, Inc. |
| Sector: Financials | |
| SubSector: Savings & Loans | |
| MarketCap: 155.03 Millions | |
| Recent Price: 26.00 Smart Investing & Trading Score: 68 | |
| Day Percent Change: -0.38% Day Change: -0.10 | |
| Week Change: -0.38% Year-to-date Change: -17.4% | |
| TSBK Links: Profile News Message Board | |
| Charts:- Daily , Weekly | |
| Add TSBK to Watchlist: View: Get Complete TSBK Trend Analysis ➞ | |
 | MSBI Midland States Bancorp, Inc. |
| Sector: Financials | |
| SubSector: Regional - Midwest Banks | |
| MarketCap: 400.27 Millions | |
| Recent Price: 23.66 Smart Investing & Trading Score: 43 | |
| Day Percent Change: -0.38% Day Change: -0.09 | |
| Week Change: -0.38% Year-to-date Change: -14.2% | |
| MSBI Links: Profile News Message Board | |
| Charts:- Daily , Weekly | |
| Add MSBI to Watchlist: View: Get Complete MSBI Trend Analysis ➞ | |
 | PLYM Plymouth Industrial REIT, Inc. |
| Sector: Financials | |
| SubSector: REIT - Industrial | |
| MarketCap: 153.449 Millions | |
| Recent Price: 20.48 Smart Investing & Trading Score: 25 | |
| Day Percent Change: -0.39% Day Change: -0.08 | |
| Week Change: -0.39% Year-to-date Change: -14.9% | |
| PLYM Links: Profile News Message Board | |
| Charts:- Daily , Weekly | |
| Add PLYM to Watchlist: View: Get Complete PLYM Trend Analysis ➞ | |
 | WOW WideOpenWest, Inc. |
| Sector: Technology | |
| SubSector: CATV Systems | |
| MarketCap: 328.932 Millions | |
| Recent Price: 4.84 Smart Investing & Trading Score: 100 | |
| Day Percent Change: -0.41% Day Change: -0.02 | |
| Week Change: -0.41% Year-to-date Change: 19.5% | |
| WOW Links: Profile News Message Board | |
| Charts:- Daily , Weekly | |
| Add WOW to Watchlist: View: Get Complete WOW Trend Analysis ➞ | |
 | CLNE Clean Energy Fuels Corp. |
| Sector: Utilities | |
| SubSector: Gas Utilities | |
| MarketCap: 371.977 Millions | |
| Recent Price: 2.37 Smart Investing & Trading Score: 69 | |
| Day Percent Change: -0.42% Day Change: -0.01 | |
| Week Change: -0.42% Year-to-date Change: -38.1% | |
| CLNE Links: Profile News Message Board | |
| Charts:- Daily , Weekly | |
| Add CLNE to Watchlist: View: Get Complete CLNE Trend Analysis ➞ | |
 | MOFG MidWestOne Financial Group, Inc. |
| Sector: Financials | |
| SubSector: Regional - Southwest Banks | |
| MarketCap: 345.265 Millions | |
| Recent Price: 21.26 Smart Investing & Trading Score: 62 | |
| Day Percent Change: -0.42% Day Change: -0.09 | |
| Week Change: -0.42% Year-to-date Change: -21.0% | |
| MOFG Links: Profile News Message Board | |
| Charts:- Daily , Weekly | |
| Add MOFG to Watchlist: View: Get Complete MOFG Trend Analysis ➞ | |
 | GRBK Green Brick Partners, Inc. |
| Sector: Financials | |
| SubSector: Real Estate Development | |
| MarketCap: 341.819 Millions | |
| Recent Price: 56.40 Smart Investing & Trading Score: 47 | |
| Day Percent Change: -0.42% Day Change: -0.24 | |
| Week Change: -0.42% Year-to-date Change: 8.6% | |
| GRBK Links: Profile News Message Board | |
| Charts:- Daily , Weekly | |
| Add GRBK to Watchlist: View: Get Complete GRBK Trend Analysis ➞ | |
 | USCB USCB Financial Holdings, Inc. |
| Sector: Financials | |
| SubSector: Banks - Regional | |
| MarketCap: 198 Millions | |
| Recent Price: 11.86 Smart Investing & Trading Score: 88 | |
| Day Percent Change: -0.42% Day Change: -0.05 | |
| Week Change: -0.42% Year-to-date Change: -3.4% | |
| USCB Links: Profile News Message Board | |
| Charts:- Daily , Weekly | |
| Add USCB to Watchlist: View: Get Complete USCB Trend Analysis ➞ | |
 | GPMT Granite Point Mortgage Trust Inc. |
| Sector: Financials | |
| SubSector: Mortgage Investment | |
| MarketCap: 289.739 Millions | |
| Recent Price: 4.40 Smart Investing & Trading Score: 35 | |
| Day Percent Change: -0.45% Day Change: -0.02 | |
| Week Change: -0.45% Year-to-date Change: -25.9% | |
| GPMT Links: Profile News Message Board | |
| Charts:- Daily , Weekly | |
| Add GPMT to Watchlist: View: Get Complete GPMT Trend Analysis ➞ | |
 | EGAN eGain Corporation |
| Sector: Technology | |
| SubSector: Business Software & Services | |
| MarketCap: 201.458 Millions | |
| Recent Price: 6.36 Smart Investing & Trading Score: 76 | |
| Day Percent Change: -0.47% Day Change: -0.03 | |
| Week Change: -0.47% Year-to-date Change: -23.7% | |
| EGAN Links: Profile News Message Board | |
| Charts:- Daily , Weekly | |
| Add EGAN to Watchlist: View: Get Complete EGAN Trend Analysis ➞ | |
 | WEYS Weyco Group, Inc. |
| Sector: Consumer Staples | |
| SubSector: Textile - Apparel Footwear & Accessories | |
| MarketCap: 198.87 Millions | |
| Recent Price: 29.14 Smart Investing & Trading Score: 18 | |
| Day Percent Change: -0.48% Day Change: -0.14 | |
| Week Change: -0.48% Year-to-date Change: -7.1% | |
| WEYS Links: Profile News Message Board | |
| Charts:- Daily , Weekly | |
| Add WEYS to Watchlist: View: Get Complete WEYS Trend Analysis ➞ | |
 | RAPT RAPT Therapeutics, Inc. |
| Sector: Health Care | |
| SubSector: Biotechnology | |
| MarketCap: 368.785 Millions | |
| Recent Price: 8.29 Smart Investing & Trading Score: 69 | |
| Day Percent Change: -0.48% Day Change: -0.04 | |
| Week Change: -0.48% Year-to-date Change: -66.6% | |
| RAPT Links: Profile News Message Board | |
| Charts:- Daily , Weekly | |
| Add RAPT to Watchlist: View: Get Complete RAPT Trend Analysis ➞ | |
 | CEIX CONSOL Energy Inc. |
| Sector: Materials | |
| SubSector: Industrial Metals & Minerals | |
| MarketCap: 196.81 Millions | |
| Recent Price: 83.48 Smart Investing & Trading Score: 50 | |
| Day Percent Change: -0.49% Day Change: -0.41 | |
| Week Change: -0.49% Year-to-date Change: -17.0% | |
| CEIX Links: Profile News Message Board | |
| Charts:- Daily , Weekly | |
| Add CEIX to Watchlist: View: Get Complete CEIX Trend Analysis ➞ | |
 | FISI Financial Institutions, Inc. |
| Sector: Financials | |
| SubSector: Regional - Mid-Atlantic Banks | |
| MarketCap: 253.459 Millions | |
| Recent Price: 17.76 Smart Investing & Trading Score: 57 | |
| Day Percent Change: -0.50% Day Change: -0.09 | |
| Week Change: -0.5% Year-to-date Change: -16.6% | |
| FISI Links: Profile News Message Board | |
| Charts:- Daily , Weekly | |
| Add FISI to Watchlist: View: Get Complete FISI Trend Analysis ➞ | |
 | FSBC Five Star Bancorp |
| Sector: Financials | |
| SubSector: Banks - Regional | |
| MarketCap: 377 Millions | |
| Recent Price: 22.02 Smart Investing & Trading Score: 55 | |
| Day Percent Change: -0.50% Day Change: -0.11 | |
| Week Change: -0.5% Year-to-date Change: -15.9% | |
| FSBC Links: Profile News Message Board | |
| Charts:- Daily , Weekly | |
| Add FSBC to Watchlist: View: Get Complete FSBC Trend Analysis ➞ | |
 | GPRO GoPro, Inc. |
| Sector: Consumer Staples | |
| SubSector: Photographic Equipment & Supplies | |
| MarketCap: 475.925 Millions | |
| Recent Price: 1.91 Smart Investing & Trading Score: 67 | |
| Day Percent Change: -0.52% Day Change: -0.01 | |
| Week Change: -0.52% Year-to-date Change: -45.0% | |
| GPRO Links: Profile News Message Board | |
| Charts:- Daily , Weekly | |
| Add GPRO to Watchlist: View: Get Complete GPRO Trend Analysis ➞ | |
 | BOOT Boot Barn Holdings, Inc. |
| Sector: Services & Goods | |
| SubSector: Apparel Stores | |
| MarketCap: 360.608 Millions | |
| Recent Price: 104.75 Smart Investing & Trading Score: 80 | |
| Day Percent Change: -0.52% Day Change: -0.55 | |
| Week Change: -0.52% Year-to-date Change: 36.5% | |
| BOOT Links: Profile News Message Board | |
| Charts:- Daily , Weekly | |
| Add BOOT to Watchlist: View: Get Complete BOOT Trend Analysis ➞ | |
 | GRTS Gritstone Oncology, Inc. |
| Sector: Health Care | |
| SubSector: Biotechnology | |
| MarketCap: 240.085 Millions | |
| Recent Price: 0.96 Smart Investing & Trading Score: 59 | |
| Day Percent Change: -0.58% Day Change: -0.01 | |
| Week Change: -0.58% Year-to-date Change: -53.1% | |
| GRTS Links: Profile News Message Board | |
| Charts:- Daily , Weekly | |
| Add GRTS to Watchlist: View: Get Complete GRTS Trend Analysis ➞ | |
 | MCRI Monarch Casino & Resort, Inc. |
| Sector: Services & Goods | |
| SubSector: Resorts & Casinos | |
| MarketCap: 352.894 Millions | |
| Recent Price: 68.60 Smart Investing & Trading Score: 47 | |
| Day Percent Change: -0.59% Day Change: -0.41 | |
| Week Change: -0.59% Year-to-date Change: -0.8% | |
| MCRI Links: Profile News Message Board | |
| Charts:- Daily , Weekly | |
| Add MCRI to Watchlist: View: Get Complete MCRI Trend Analysis ➞ | |
 | JANX Janux Therapeutics, Inc. |
| Sector: Health Care | |
| SubSector: Biotechnology | |
| MarketCap: 496 Millions | |
| Recent Price: 62.24 Smart Investing & Trading Score: 88 | |
| Day Percent Change: -0.60% Day Change: -0.38 | |
| Week Change: -0.6% Year-to-date Change: 479.3% | |
| JANX Links: Profile News Message Board | |
| Charts:- Daily , Weekly | |
| Add JANX to Watchlist: View: Get Complete JANX Trend Analysis ➞ | |
 | SPWH Sportsman s Warehouse Holdings, Inc. |
| Sector: Consumer Staples | |
| SubSector: Sporting Goods | |
| MarketCap: 247.144 Millions | |
| Recent Price: 3.19 Smart Investing & Trading Score: 20 | |
| Day Percent Change: -0.62% Day Change: -0.02 | |
| Week Change: -0.62% Year-to-date Change: -25.1% | |
| SPWH Links: Profile News Message Board | |
| Charts:- Daily , Weekly | |
| Add SPWH to Watchlist: View: Get Complete SPWH Trend Analysis ➞ | |
 | OSG Overseas Shipholding Group, Inc. |
| Sector: Transports | |
| SubSector: Shipping | |
| MarketCap: 184.814 Millions | |
| Recent Price: 6.28 Smart Investing & Trading Score: 73 | |
| Day Percent Change: -0.63% Day Change: -0.04 | |
| Week Change: -0.63% Year-to-date Change: 19.2% | |
| OSG Links: Profile News Message Board | |
| Charts:- Daily , Weekly | |
| Add OSG to Watchlist: View: Get Complete OSG Trend Analysis ➞ | |
 | ADTN ADTRAN, Inc. |
| Sector: Technology | |
| SubSector: Communication Equipment | |
| MarketCap: 303.539 Millions | |
| Recent Price: 4.71 Smart Investing & Trading Score: 60 | |
| Day Percent Change: -0.63% Day Change: -0.03 | |
| Week Change: -0.63% Year-to-date Change: -35.8% | |
| ADTN Links: Profile News Message Board | |
| Charts:- Daily , Weekly | |
| Add ADTN to Watchlist: View: Get Complete ADTN Trend Analysis ➞ | |
| For tabular summary view of above stock list: Summary View ➞ 0 - 25 , 25 - 50 , 50 - 75 , 75 - 100 , 100 - 125 , 125 - 150 , 150 - 175 , 175 - 200 , 200 - 225 , 225 - 250 , 250 - 275 , 275 - 300 , 300 - 325 , 325 - 350 , 350 - 375 , 375 - 400 , 400 - 425 , 425 - 450 , 450 - 475 , 475 - 500 , 500 - 525 | ||
| Click To Change The Sort Order: By Market Cap or Company Size Performance: Year-to-date, Week and Day | |
| Select Chart Type: | ||
| Too many stocks? View smallcap stocks filtered by marketcap & sector |
| Marketcap: All SmallCap Stocks (default-no microcap), Large, Mid-Range, Small & MicroCap |
| Sector: Tech, Finance, Energy, Staples, Retail, Industrial, Materials, Utilities & Medical |
|
Best Stocks Today 12Stocks.com |
© 2024 12Stocks.com Terms & Conditions Privacy Contact Us
All Information Provided Only For Education And Not To Be Used For Investing or Trading. See Terms & Conditions


One More Thing ... Get Best Stocks Delivered Daily!
Never Ever Miss A Move With Our Top Ten Stocks Lists
Find Best Stocks In Any Market - Bull or Bear Market
Take A Peek At Our Top Ten Stocks Lists: Daily, Weekly, Year-to-Date & Top Trends
Find Best Stocks In Any Market - Bull or Bear Market
Take A Peek At Our Top Ten Stocks Lists: Daily, Weekly, Year-to-Date & Top Trends
Smallcap Stocks With Best Up Trends [0-bearish to 100-bullish]: Perficient [100], Outset Medical[100], Lineage Cell[100], Assertio [100], Dakota Gold[100], Loln Educational[100], Twist Bioscience[100], PMV [100], SilverBow Resources[100], Phathom [100], Alexander s[100]
Best Smallcap Stocks Year-to-Date:
CareMax [511.34%], Janux [479.25%], Viking [320.26%], Alpine Immune[239.29%], Longboard [237.32%], Bakkt [197.53%], Vera [194.15%], Super Micro[192.11%], Avidity Biosciences[189.6%], Cullinan Oncology[178.76%], Y-mAbs [152.79%] Best Smallcap Stocks This Week:
Perficient [52.28%], P3 Health[25.16%], Outset Medical[23%], Lineage Cell[22.64%], Workhorse Group[20.5%], SoundHound AI[19.54%], DASAN Zhone[19.25%], BioCryst [18.43%], Marathon Patent[17.98%], Assertio [16.99%], Aceto [16.55%] Best Smallcap Stocks Daily:
Perficient [52.28%], P3 Health[25.16%], Outset Medical[23.00%], Lineage Cell[22.64%], Workhorse Group[20.50%], SoundHound AI[19.54%], DASAN Zhone[19.25%], BioCryst [18.43%], Marathon Patent[17.98%], Assertio [16.99%], Aceto [16.55%]