
 Login Sign Up


| |||||
 |  | ||||

| 12Stocks.com Market Intelligence |
Best SmallCap Stocks
|
| In a hurry? Small Cap Stock Lists: Performance Trends Table, Stock Charts
Sort Small Cap stocks: Daily, Weekly, Year-to-Date, Market Cap & Trends. Filter Small Cap stocks list by sector: Show all, Tech, Finance, Energy, Staples, Retail, Industrial, Materials, Utilities and HealthCare Filter Small Cap stocks list by size: All Large Medium Small and MicroCap |
| 12Stocks.com Small Cap Stocks Performances & Trends Daily | |||||||||
|
|  The overall Smart Investing & Trading Score is 76 (0-bearish to 100-bullish) which puts Small Cap index in short term neutral to bullish trend. The Smart Investing & Trading Score from previous trading session is 90 and hence a deterioration of trend.
| ||||||||
Here are the Smart Investing & Trading Scores of the most requested small cap stocks at 12Stocks.com (click stock name for detailed review):
|


| 12Stocks.com: Investing in Smallcap Index with Stocks | |
|
The following table helps investors and traders sort through current performance and trends (as measured by Smart Investing & Trading Score) of various
stocks in the Smallcap Index. Quick View: Move mouse or cursor over stock symbol (ticker) to view short-term technical chart and over stock name to view long term chart. Click on  to add stock symbol to your watchlist and to add stock symbol to your watchlist and  to view watchlist. Click on any ticker or stock name for detailed market intelligence report for that stock. to view watchlist. Click on any ticker or stock name for detailed market intelligence report for that stock. |
12Stocks.com Performance of Stocks in Smallcap Index
| Ticker | Stock Name | Watchlist | Category | Recent Price | Smart Investing & Trading Score | Change % | YTD Change% |
| GNE | Genie Energy |   | Energy | 15.31 | 17 | -1.35 | -45.57% |
| IESC | IES | | Industrials | 159.95 | 51 | -1.39 | 101.91% |
| SIBN | SI-BONE | | Health Care | 14.92 | 40 | -1.39 | -28.92% |
| HUMA | Humacyte | | Health Care | 6.33 | 68 | -1.40 | 122.89% |
| STKL | SunOpta | | Consumer Staples | 5.54 | 7 | -1.42 | 1.28% |
| METCB | Ramaco Resources | | Materials | 10.90 | 25 | -1.45 | -17.74% |
| MOD | Modine | | Consumer Staples | 102.22 | 58 | -1.49 | 71.22% |
| DVAX | Dynavax | | Health Care | 11.11 | 42 | -1.51 | -20.53% |
| CHEF | Chefs | | Consumer Staples | 38.92 | 76 | -1.52 | 32.25% |
| HLLY | Holley | | Services & Goods | 3.85 | 0 | -1.53 | -22.46% |
| BTMD | biote | | Health Care | 5.75 | 25 | -1.54 | 15.93% |
| SMMT | Summit | | Health Care | 4.44 | 37 | -1.55 | 70.11% |
| ANAB | AnaptysBio | | Health Care | 25.07 | 50 | -1.57 | 17.04% |
| BBCP | Concrete Pumping | | Industrials | 6.84 | 25 | -1.58 | -16.59% |
| OCUL | Ocular Therapeutix | | Health Care | 6.17 | 52 | -1.59 | 38.34% |
| TDW | Tidewater | | Energy | 105.28 | 51 | -1.61 | 46.00% |
| ONL | Orion Office | | Financials | 3.66 | 68 | -1.61 | -36.01% |
| GIII | G-III Apparel | | Consumer Staples | 27.76 | 10 | -1.63 | -18.30% |
| SLDP | Solid Power | | Industrials | 1.75 | 58 | -1.69 | 22.81% |
| MCS | Marcus | | Services & Goods | 10.90 | 0 | -1.71 | -25.24% |
| CUE | Cue Biopharma | | Health Care | 1.71 | 50 | -1.72 | -35.23% |
| AKYA | Akoya Biosciences | | Health Care | 2.85 | 7 | -1.72 | -41.72% |
| FLGT | Fulgent Genetics | | Health Care | 22.11 | 42 | -1.73 | -23.52% |
| SPWH | Sportsman s | | Consumer Staples | 3.37 | 49 | -1.75 | -20.89% |
| LNTH | Lantheus | | Health Care | 79.67 | 90 | -1.76 | 28.50% |
| For chart view version of above stock list: Chart View ➞ 0 - 25 , 25 - 50 , 50 - 75 , 75 - 100 , 100 - 125 , 125 - 150 , 150 - 175 , 175 - 200 , 200 - 225 , 225 - 250 , 250 - 275 , 275 - 300 , 300 - 325 , 325 - 350 , 350 - 375 , 375 - 400 , 400 - 425 , 425 - 450 , 450 - 475 , 475 - 500 , 500 - 525 | ||
 | Click To Change The Sort Order: By Market Cap or Company Size Performance: Year-to-date, Week and Day |  |
| Too many stocks? View smallcap stocks filtered by marketcap & sector |
| Marketcap: All SmallCap Stocks (default-no microcap), Large, Mid-Range, Small |
| Smallcap Sector: Tech, Finance, Energy, Staples, Retail, Industrial, Materials, & Medical |
|
Get the most comprehensive stock market coverage daily at 12Stocks.com ➞ Best Stocks Today ➞ Best Stocks Weekly ➞ Best Stocks Year-to-Date ➞ Best Stocks Trends ➞  Best Stocks Today 12Stocks.com Best Nasdaq Stocks ➞ Best S&P 500 Stocks ➞ Best Tech Stocks ➞ Best Biotech Stocks ➞ |
| Detailed Overview of SmallCap Stocks |
| SmallCap Technical Overview, Leaders & Laggards, Top SmallCap ETF Funds & Detailed SmallCap Stocks List, Charts, Trends & More |
| Smallcap: Technical Analysis, Trends & YTD Performance | |
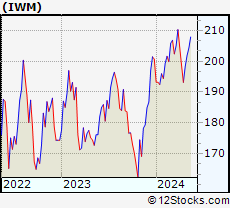
| SmallCap segment as represented by
IWM, an exchange-traded fund [ETF], holds basket of thousands of smallcap stocks from across all major sectors of the US stock market. The smallcap index (contains stocks like Riverbed & Sotheby's) is up by 3.67% and is currently underperforming the overall market by -6.9% year-to-date. Below is a quick view of technical charts and trends: | |
 IWM Weekly Chart |
|
| Long Term Trend: Very Good | |
| Medium Term Trend: Very Good | |
 IWM Daily Chart |
|
| Short Term Trend: Good | |
| Overall Trend Score: 76 | |
| YTD Performance: 3.67% | |
| **Trend Scores & Views Are Only For Educational Purposes And Not For Investing | |
| 12Stocks.com: Top Performing Small Cap Index Stocks | ||||||||||||||||||||||||||||||||||||||||||||||||
 The top performing Small Cap Index stocks year to date are
Now, more recently, over last week, the top performing Small Cap Index stocks on the move are


|
||||||||||||||||||||||||||||||||||||||||||||||||
| 12Stocks.com: Investing in Smallcap Index using Exchange Traded Funds | |
|
The following table shows list of key exchange traded funds (ETF) that
help investors track Smallcap index. The following list also includes leveraged ETF funds that track twice or thrice the daily returns of Smallcap indices. Short or inverse ETF funds move in the opposite direction to the index they track and are useful during market pullbacks or during bear markets. Quick View: Move mouse or cursor over ETF symbol (ticker) to view short-term technical chart and over ETF name to view long term chart. Click on ticker or stock name for detailed view. Click on to add stock symbol to your watchlist and to view watchlist. |
12Stocks.com List of ETFs that track Smallcap Index
| Ticker | ETF Name | Watchlist | Recent Price | Smart Investing & Trading Score | Change % | Week % | Year-to-date % |
| IWM | iShares Russell 2000 | | 208.08 | 76 | 0.07 | 1.85 | 3.67% |
| VTWO | Vanguard Russell 2000 ETF | | 84.11 | 71 | 0.00 | 1.8 | 3.71% |
| IJR | iShares Core S&P Small-Cap | | 110.39 | 68 | -0.22 | 1.29 | 1.98% |
| IWN | iShares Russell 2000 Value | | 158.71 | 76 | -0.07 | 1.61 | 2.18% |
| IWO | iShares Russell 2000 Growth | | 265.15 | 63 | -0.75 | 2.01 | 5.13% |
| IJS | iShares S&P Small-Cap 600 Value | | 101.87 | 76 | -0.15 | 1.34 | -1.16% |
| IJT | iShares S&P Small-Cap 600 Growth | | 131.34 | 71 | 0.04 | 1.14 | 4.95% |
| XSLV | PowerShares S&P SmallCap Low Volatil ETF | | 44.48 | 83 | -0.01 | 0.55 | 0.74% |
| SAA | ProShares Ultra SmallCap600 | | 24.90 | 71 | 0.50 | 2.28 | -0.18% |
| SMLV | SPDR SSGA US Small Cap Low Volatil ETF | | 113.28 | 95 | 0.43 | 1.85 | 0.68% |
| SDD | ProShares UltraShort SmallCap600 | | 17.84 | 35 | 0.96 | -2.41 | -3.19% |
| SBB | ProShares Short SmallCap600 | | 15.77 | 25 | 0.41 | -1.14 | -0.98% |
| 12Stocks.com: Charts, Trends, Fundamental Data and Performances of SmallCap Stocks | |
|
We now take in-depth look at all SmallCap stocks including charts, multi-period performances and overall trends (as measured by Smart Investing & Trading Score). One can sort SmallCap stocks (click link to choose) by Daily, Weekly and by Year-to-Date performances. Also, one can sort by size of the company or by market capitalization. |
| Select Your Default Chart Type: | |||||
| |||||
| Click on stock symbol or name for detailed view. Click on to add stock symbol to your watchlist and to view watchlist. Quick View: Move mouse or cursor over "Daily" to quickly view daily technical stock chart and over "Weekly" to view weekly technical stock chart. | |||||

 | GNE Genie Energy Ltd. |
| Sector: Energy | |
| SubSector: Independent Oil & Gas | |
| MarketCap: 177.293 Millions | |
| Recent Price: 15.31 Smart Investing & Trading Score: 17 | |
| Day Percent Change: -1.35% Day Change: -0.21 | |
| Week Change: 0.92% Year-to-date Change: -45.6% | |
| GNE Links: Profile News Message Board | |
| Charts:- Daily , Weekly | |
| Add GNE to Watchlist: View: Get Complete GNE Trend Analysis ➞ | |
 | IESC IES Holdings, Inc. |
| Sector: Industrials | |
| SubSector: General Contractors | |
| MarketCap: 380.963 Millions | |
| Recent Price: 159.95 Smart Investing & Trading Score: 51 | |
| Day Percent Change: -1.39% Day Change: -2.25 | |
| Week Change: -12.26% Year-to-date Change: 101.9% | |
| IESC Links: Profile News Message Board | |
| Charts:- Daily , Weekly | |
| Add IESC to Watchlist: View: Get Complete IESC Trend Analysis ➞ | |
 | SIBN SI-BONE, Inc. |
| Sector: Health Care | |
| SubSector: Medical Appliances & Equipment | |
| MarketCap: 234.78 Millions | |
| Recent Price: 14.92 Smart Investing & Trading Score: 40 | |
| Day Percent Change: -1.39% Day Change: -0.21 | |
| Week Change: -2.67% Year-to-date Change: -28.9% | |
| SIBN Links: Profile News Message Board | |
| Charts:- Daily , Weekly | |
| Add SIBN to Watchlist: View: Get Complete SIBN Trend Analysis ➞ | |
 | HUMA Humacyte, Inc. |
| Sector: Health Care | |
| SubSector: Biotechnology | |
| MarketCap: 297 Millions | |
| Recent Price: 6.33 Smart Investing & Trading Score: 68 | |
| Day Percent Change: -1.40% Day Change: -0.09 | |
| Week Change: 34.68% Year-to-date Change: 122.9% | |
| HUMA Links: Profile News Message Board | |
| Charts:- Daily , Weekly | |
| Add HUMA to Watchlist: View: Get Complete HUMA Trend Analysis ➞ | |
 | STKL SunOpta Inc. |
| Sector: Consumer Staples | |
| SubSector: Processed & Packaged Goods | |
| MarketCap: 174.548 Millions | |
| Recent Price: 5.54 Smart Investing & Trading Score: 7 | |
| Day Percent Change: -1.42% Day Change: -0.08 | |
| Week Change: -5.14% Year-to-date Change: 1.3% | |
| STKL Links: Profile News Message Board | |
| Charts:- Daily , Weekly | |
| Add STKL to Watchlist: View: Get Complete STKL Trend Analysis ➞ | |
 | METCB Ramaco Resources, Inc. |
| Sector: Materials | |
| SubSector: Coking Coal | |
| MarketCap: 469 Millions | |
| Recent Price: 10.90 Smart Investing & Trading Score: 25 | |
| Day Percent Change: -1.45% Day Change: -0.16 | |
| Week Change: -2.68% Year-to-date Change: -17.7% | |
| METCB Links: Profile News Message Board | |
| Charts:- Daily , Weekly | |
| Add METCB to Watchlist: View: Get Complete METCB Trend Analysis ➞ | |
 | MOD Modine Manufacturing Company |
| Sector: Consumer Staples | |
| SubSector: Auto Parts | |
| MarketCap: 177.339 Millions | |
| Recent Price: 102.22 Smart Investing & Trading Score: 58 | |
| Day Percent Change: -1.49% Day Change: -1.55 | |
| Week Change: -0.88% Year-to-date Change: 71.2% | |
| MOD Links: Profile News Message Board | |
| Charts:- Daily , Weekly | |
| Add MOD to Watchlist: View: Get Complete MOD Trend Analysis ➞ | |
 | DVAX Dynavax Technologies Corporation |
| Sector: Health Care | |
| SubSector: Biotechnology | |
| MarketCap: 276.885 Millions | |
| Recent Price: 11.11 Smart Investing & Trading Score: 42 | |
| Day Percent Change: -1.51% Day Change: -0.17 | |
| Week Change: 3.54% Year-to-date Change: -20.5% | |
| DVAX Links: Profile News Message Board | |
| Charts:- Daily , Weekly | |
| Add DVAX to Watchlist: View: Get Complete DVAX Trend Analysis ➞ | |
 | CHEF The Chefs Warehouse, Inc. |
| Sector: Consumer Staples | |
| SubSector: Food Wholesale | |
| MarketCap: 207.529 Millions | |
| Recent Price: 38.92 Smart Investing & Trading Score: 76 | |
| Day Percent Change: -1.52% Day Change: -0.60 | |
| Week Change: 1.09% Year-to-date Change: 32.3% | |
| CHEF Links: Profile News Message Board | |
| Charts:- Daily , Weekly | |
| Add CHEF to Watchlist: View: Get Complete CHEF Trend Analysis ➞ | |
 | HLLY Holley Inc. |
| Sector: Services & Goods | |
| SubSector: Auto Parts | |
| MarketCap: 469 Millions | |
| Recent Price: 3.85 Smart Investing & Trading Score: 0 | |
| Day Percent Change: -1.53% Day Change: -0.06 | |
| Week Change: -3.51% Year-to-date Change: -22.5% | |
| HLLY Links: Profile News Message Board | |
| Charts:- Daily , Weekly | |
| Add HLLY to Watchlist: View: Get Complete HLLY Trend Analysis ➞ | |
 | BTMD biote Corp. |
| Sector: Health Care | |
| SubSector: Medical Care Facilities | |
| MarketCap: 468 Millions | |
| Recent Price: 5.75 Smart Investing & Trading Score: 25 | |
| Day Percent Change: -1.54% Day Change: -0.09 | |
| Week Change: -6.05% Year-to-date Change: 15.9% | |
| BTMD Links: Profile News Message Board | |
| Charts:- Daily , Weekly | |
| Add BTMD to Watchlist: View: Get Complete BTMD Trend Analysis ➞ | |
 | SMMT Summit Therapeutics plc |
| Sector: Health Care | |
| SubSector: Biotechnology | |
| MarketCap: 156.985 Millions | |
| Recent Price: 4.44 Smart Investing & Trading Score: 37 | |
| Day Percent Change: -1.55% Day Change: -0.07 | |
| Week Change: -4.52% Year-to-date Change: 70.1% | |
| SMMT Links: Profile News Message Board | |
| Charts:- Daily , Weekly | |
| Add SMMT to Watchlist: View: Get Complete SMMT Trend Analysis ➞ | |
 | ANAB AnaptysBio, Inc. |
| Sector: Health Care | |
| SubSector: Biotechnology | |
| MarketCap: 405.985 Millions | |
| Recent Price: 25.07 Smart Investing & Trading Score: 50 | |
| Day Percent Change: -1.57% Day Change: -0.40 | |
| Week Change: 7.09% Year-to-date Change: 17.0% | |
| ANAB Links: Profile News Message Board | |
| Charts:- Daily , Weekly | |
| Add ANAB to Watchlist: View: Get Complete ANAB Trend Analysis ➞ | |
 | BBCP Concrete Pumping Holdings, Inc. |
| Sector: Industrials | |
| SubSector: General Building Materials | |
| MarketCap: 263.653 Millions | |
| Recent Price: 6.84 Smart Investing & Trading Score: 25 | |
| Day Percent Change: -1.58% Day Change: -0.11 | |
| Week Change: -1.16% Year-to-date Change: -16.6% | |
| BBCP Links: Profile News Message Board | |
| Charts:- Daily , Weekly | |
| Add BBCP to Watchlist: View: Get Complete BBCP Trend Analysis ➞ | |
 | OCUL Ocular Therapeutix, Inc. |
| Sector: Health Care | |
| SubSector: Biotechnology | |
| MarketCap: 249.985 Millions | |
| Recent Price: 6.17 Smart Investing & Trading Score: 52 | |
| Day Percent Change: -1.59% Day Change: -0.10 | |
| Week Change: 9.01% Year-to-date Change: 38.3% | |
| OCUL Links: Profile News Message Board | |
| Charts:- Daily , Weekly | |
| Add OCUL to Watchlist: View: Get Complete OCUL Trend Analysis ➞ | |
 | TDW Tidewater Inc. |
| Sector: Energy | |
| SubSector: Oil & Gas Equipment & Services | |
| MarketCap: 295.061 Millions | |
| Recent Price: 105.28 Smart Investing & Trading Score: 51 | |
| Day Percent Change: -1.61% Day Change: -1.72 | |
| Week Change: 0.5% Year-to-date Change: 46.0% | |
| TDW Links: Profile News Message Board | |
| Charts:- Daily , Weekly | |
| Add TDW to Watchlist: View: Get Complete TDW Trend Analysis ➞ | |
 | ONL Orion Office REIT Inc. |
| Sector: Financials | |
| SubSector: REIT - Office | |
| MarketCap: 375 Millions | |
| Recent Price: 3.66 Smart Investing & Trading Score: 68 | |
| Day Percent Change: -1.61% Day Change: -0.06 | |
| Week Change: -1.61% Year-to-date Change: -36.0% | |
| ONL Links: Profile News Message Board | |
| Charts:- Daily , Weekly | |
| Add ONL to Watchlist: View: Get Complete ONL Trend Analysis ➞ | |
 | GIII G-III Apparel Group, Ltd. |
| Sector: Consumer Staples | |
| SubSector: Textile - Apparel Clothing | |
| MarketCap: 354.365 Millions | |
| Recent Price: 27.76 Smart Investing & Trading Score: 10 | |
| Day Percent Change: -1.63% Day Change: -0.46 | |
| Week Change: -0.82% Year-to-date Change: -18.3% | |
| GIII Links: Profile News Message Board | |
| Charts:- Daily , Weekly | |
| Add GIII to Watchlist: View: Get Complete GIII Trend Analysis ➞ | |
 | SLDP Solid Power, Inc. |
| Sector: Industrials | |
| SubSector: Electrical Equipment & Parts | |
| MarketCap: 445 Millions | |
| Recent Price: 1.75 Smart Investing & Trading Score: 58 | |
| Day Percent Change: -1.69% Day Change: -0.03 | |
| Week Change: 1.74% Year-to-date Change: 22.8% | |
| SLDP Links: Profile News Message Board | |
| Charts:- Daily , Weekly | |
| Add SLDP to Watchlist: View: Get Complete SLDP Trend Analysis ➞ | |
 | MCS The Marcus Corporation |
| Sector: Services & Goods | |
| SubSector: Entertainment - Diversified | |
| MarketCap: 441.437 Millions | |
| Recent Price: 10.90 Smart Investing & Trading Score: 0 | |
| Day Percent Change: -1.71% Day Change: -0.19 | |
| Week Change: -5.63% Year-to-date Change: -25.2% | |
| MCS Links: Profile News Message Board | |
| Charts:- Daily , Weekly | |
| Add MCS to Watchlist: View: Get Complete MCS Trend Analysis ➞ | |
 | CUE Cue Biopharma, Inc. |
| Sector: Health Care | |
| SubSector: Biotechnology | |
| MarketCap: 352.785 Millions | |
| Recent Price: 1.71 Smart Investing & Trading Score: 50 | |
| Day Percent Change: -1.72% Day Change: -0.03 | |
| Week Change: -1.72% Year-to-date Change: -35.2% | |
| CUE Links: Profile News Message Board | |
| Charts:- Daily , Weekly | |
| Add CUE to Watchlist: View: Get Complete CUE Trend Analysis ➞ | |
 | AKYA Akoya Biosciences, Inc. |
| Sector: Health Care | |
| SubSector: Medical Instruments & Supplies | |
| MarketCap: 340 Millions | |
| Recent Price: 2.85 Smart Investing & Trading Score: 7 | |
| Day Percent Change: -1.72% Day Change: -0.05 | |
| Week Change: -33.18% Year-to-date Change: -41.7% | |
| AKYA Links: Profile News Message Board | |
| Charts:- Daily , Weekly | |
| Add AKYA to Watchlist: View: Get Complete AKYA Trend Analysis ➞ | |
 | FLGT Fulgent Genetics, Inc. |
| Sector: Health Care | |
| SubSector: Medical Laboratories & Research | |
| MarketCap: 222.2 Millions | |
| Recent Price: 22.11 Smart Investing & Trading Score: 42 | |
| Day Percent Change: -1.73% Day Change: -0.39 | |
| Week Change: 1.66% Year-to-date Change: -23.5% | |
| FLGT Links: Profile News Message Board | |
| Charts:- Daily , Weekly | |
| Add FLGT to Watchlist: View: Get Complete FLGT Trend Analysis ➞ | |
 | SPWH Sportsman s Warehouse Holdings, Inc. |
| Sector: Consumer Staples | |
| SubSector: Sporting Goods | |
| MarketCap: 247.144 Millions | |
| Recent Price: 3.37 Smart Investing & Trading Score: 49 | |
| Day Percent Change: -1.75% Day Change: -0.06 | |
| Week Change: 5.97% Year-to-date Change: -20.9% | |
| SPWH Links: Profile News Message Board | |
| Charts:- Daily , Weekly | |
| Add SPWH to Watchlist: View: Get Complete SPWH Trend Analysis ➞ | |
 | LNTH Lantheus Holdings, Inc. |
| Sector: Health Care | |
| SubSector: Medical Appliances & Equipment | |
| MarketCap: 467.18 Millions | |
| Recent Price: 79.67 Smart Investing & Trading Score: 90 | |
| Day Percent Change: -1.76% Day Change: -1.43 | |
| Week Change: 4.8% Year-to-date Change: 28.5% | |
| LNTH Links: Profile News Message Board | |
| Charts:- Daily , Weekly | |
| Add LNTH to Watchlist: View: Get Complete LNTH Trend Analysis ➞ | |
| For tabular summary view of above stock list: Summary View ➞ 0 - 25 , 25 - 50 , 50 - 75 , 75 - 100 , 100 - 125 , 125 - 150 , 150 - 175 , 175 - 200 , 200 - 225 , 225 - 250 , 250 - 275 , 275 - 300 , 300 - 325 , 325 - 350 , 350 - 375 , 375 - 400 , 400 - 425 , 425 - 450 , 450 - 475 , 475 - 500 , 500 - 525 | ||
| Click To Change The Sort Order: By Market Cap or Company Size Performance: Year-to-date, Week and Day | |
| Select Chart Type: | ||
| Too many stocks? View smallcap stocks filtered by marketcap & sector |
| Marketcap: All SmallCap Stocks (default-no microcap), Large, Mid-Range, Small & MicroCap |
| Sector: Tech, Finance, Energy, Staples, Retail, Industrial, Materials, Utilities & Medical |
|
Best Stocks Today 12Stocks.com |
© 2024 12Stocks.com Terms & Conditions Privacy Contact Us
All Information Provided Only For Education And Not To Be Used For Investing or Trading. See Terms & Conditions


One More Thing ... Get Best Stocks Delivered Daily!
Never Ever Miss A Move With Our Top Ten Stocks Lists
Find Best Stocks In Any Market - Bull or Bear Market
Take A Peek At Our Top Ten Stocks Lists: Daily, Weekly, Year-to-Date & Top Trends
Find Best Stocks In Any Market - Bull or Bear Market
Take A Peek At Our Top Ten Stocks Lists: Daily, Weekly, Year-to-Date & Top Trends
Smallcap Stocks With Best Up Trends [0-bearish to 100-bullish]: CommScope Holding[100], Coeur Mining[100], Hecla Mining[100], MicroStrategy [100], Enovix [100], Rayonier Advanced[100], Nurix [100], Energy Fuels[100], NovaGold Resources[100], Piedmont Lithium[100], Wave Life[100]
Best Smallcap Stocks Year-to-Date:
CareMax [495.88%], Bakkt [413.9%], Janux [338.34%], Viking [260.02%], Alpine Immune[241.23%], Longboard [238.63%], Avidity Biosciences[226.33%], Super Micro[212.35%], Arcutis Bio[184.83%], Sweetgreen [180.97%], Novavax [171.04%] Best Smallcap Stocks This Week:
Vaxxinity [58.82%], Novavax [46.51%], Vicarious Surgical[45.62%], Harrow Health[44.48%], ProKidney [44.31%], Workhorse Group[36.06%], Maxeon Solar[35.94%], Fossil Group[35.44%], Humacyte [34.68%], MicroStrategy [34.23%], Cadiz [33.48%] Best Smallcap Stocks Daily:
Vaxxinity [45.95%], Presto Automation[31.90%], Vicarious Surgical[27.93%], Orchestra BioMed[12.77%], CommScope Holding[11.86%], Coeur Mining[11.57%], Hecla Mining[11.11%], MicroStrategy [10.04%], Tenaya [9.65%], Bakkt [9.25%], Enovix [9.25%]