
 Login Sign Up


| |||||
 |  | ||||

| 12Stocks.com Market Intelligence |
Best SmallCap Stocks
|
| In a hurry? Small Cap Stock Lists: Performance Trends Table, Stock Charts
Sort Small Cap stocks: Daily, Weekly, Year-to-Date, Market Cap & Trends. Filter Small Cap stocks list by sector: Show all, Tech, Finance, Energy, Staples, Retail, Industrial, Materials, Utilities and HealthCare Filter Small Cap stocks list by size: All Large Medium Small and MicroCap |
| 12Stocks.com Small Cap Stocks Performances & Trends Daily | |||||||||
|
|  The overall Smart Investing & Trading Score is 76 (0-bearish to 100-bullish) which puts Small Cap index in short term neutral to bullish trend. The Smart Investing & Trading Score from previous trading session is 90 and hence a deterioration of trend.
| ||||||||
Here are the Smart Investing & Trading Scores of the most requested small cap stocks at 12Stocks.com (click stock name for detailed review):
|


| 12Stocks.com: Investing in Smallcap Index with Stocks | |
|
The following table helps investors and traders sort through current performance and trends (as measured by Smart Investing & Trading Score) of various
stocks in the Smallcap Index. Quick View: Move mouse or cursor over stock symbol (ticker) to view short-term technical chart and over stock name to view long term chart. Click on  to add stock symbol to your watchlist and to add stock symbol to your watchlist and  to view watchlist. Click on any ticker or stock name for detailed market intelligence report for that stock. to view watchlist. Click on any ticker or stock name for detailed market intelligence report for that stock. |
12Stocks.com Performance of Stocks in Smallcap Index
| Ticker | Stock Name | Watchlist | Category | Recent Price | Smart Investing & Trading Score | Change % | YTD Change% |
| SGRY | Surgery Partners |   | Health Care | 25.83 | 32 | -2.34 | -19.26% |
| ERII | Energy Recovery | | Industrials | 13.71 | 20 | -2.35 | -27.23% |
| ELF | e.l.f. Beauty | | Consumer Staples | 158.45 | 0 | -2.35 | 9.78% |
| ARCT | Arcturus | | Health Care | 29.78 | 45 | -2.36 | -5.55% |
| ARAY | Accuray | | Health Care | 1.63 | 35 | -2.40 | -42.40% |
| RAPT | RAPT | | Health Care | 4.04 | 28 | -2.42 | -83.74% |
| GSAT | Globalstar | | Technology | 1.20 | 10 | -2.44 | -38.14% |
| GDYN | Grid Dynamics | | Technology | 10.22 | 25 | -2.48 | -23.33% |
| ATRO | Astronics | | Industrials | 20.36 | 83 | -2.49 | 16.88% |
| NEWT | Newtek Business | | Services & Goods | 13.67 | 68 | -2.50 | -0.94% |
| CHUY | Chuy s | | Services & Goods | 27.47 | 0 | -2.55 | -28.15% |
| OMI | Owens & Minor | | Services & Goods | 18.62 | 17 | -2.56 | -3.37% |
| THRD | Third Harmonic | | Health Care | 13.87 | 100 | -2.57 | 25.87% |
| EXTR | Extreme s | | Technology | 11.67 | 74 | -2.59 | -33.84% |
| NUVB | Nuvation Bio | | Health Care | 3.32 | 65 | -2.64 | 119.14% |
| CGEM | Cullinan Oncology | | Health Care | 23.17 | 36 | -2.69 | 127.27% |
| CYH | Community Health | | Health Care | 3.61 | 68 | -2.70 | 15.34% |
| MIRM | Mirum | | Health Care | 24.07 | 10 | -2.75 | -18.46% |
| BSIG | BrightSphere | | Financials | 22.81 | 53 | -2.77 | 19.05% |
| ACMR | ACM Research | | Technology | 23.80 | 25 | -2.82 | 21.80% |
| BCRX | BioCryst | | Health Care | 6.28 | 90 | -2.94 | 4.84% |
| SNDX | Syndax | | Health Care | 20.29 | 0 | -3.01 | -6.11% |
| ARLO | Arlo | | Technology | 11.91 | 49 | -3.17 | 25.11% |
| BBAI | BigBear.ai | | Technology | 1.51 | 17 | -3.21 | -29.11% |
| WNC | Wabash National | | Consumer Staples | 22.47 | 0 | -3.23 | -12.30% |
| For chart view version of above stock list: Chart View ➞ 0 - 25 , 25 - 50 , 50 - 75 , 75 - 100 , 100 - 125 , 125 - 150 , 150 - 175 , 175 - 200 , 200 - 225 , 225 - 250 , 250 - 275 , 275 - 300 , 300 - 325 , 325 - 350 , 350 - 375 , 375 - 400 , 400 - 425 , 425 - 450 , 450 - 475 , 475 - 500 , 500 - 525 | ||
 | Click To Change The Sort Order: By Market Cap or Company Size Performance: Year-to-date, Week and Day |  |
| Too many stocks? View smallcap stocks filtered by marketcap & sector |
| Marketcap: All SmallCap Stocks (default-no microcap), Large, Mid-Range, Small |
| Smallcap Sector: Tech, Finance, Energy, Staples, Retail, Industrial, Materials, & Medical |
|
Get the most comprehensive stock market coverage daily at 12Stocks.com ➞ Best Stocks Today ➞ Best Stocks Weekly ➞ Best Stocks Year-to-Date ➞ Best Stocks Trends ➞  Best Stocks Today 12Stocks.com Best Nasdaq Stocks ➞ Best S&P 500 Stocks ➞ Best Tech Stocks ➞ Best Biotech Stocks ➞ |
| Detailed Overview of SmallCap Stocks |
| SmallCap Technical Overview, Leaders & Laggards, Top SmallCap ETF Funds & Detailed SmallCap Stocks List, Charts, Trends & More |
| Smallcap: Technical Analysis, Trends & YTD Performance | |
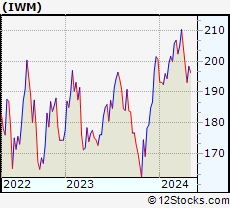
| SmallCap segment as represented by
IWM, an exchange-traded fund [ETF], holds basket of thousands of smallcap stocks from across all major sectors of the US stock market. The smallcap index (contains stocks like Riverbed & Sotheby's) is up by 3.67% and is currently underperforming the overall market by -6.9% year-to-date. Below is a quick view of technical charts and trends: | |
 IWM Weekly Chart |
|
| Long Term Trend: Very Good | |
| Medium Term Trend: Very Good | |
 IWM Daily Chart |
|
| Short Term Trend: Good | |
| Overall Trend Score: 76 | |
| YTD Performance: 3.67% | |
| **Trend Scores & Views Are Only For Educational Purposes And Not For Investing | |
| 12Stocks.com: Top Performing Small Cap Index Stocks | ||||||||||||||||||||||||||||||||||||||||||||||||
 The top performing Small Cap Index stocks year to date are
Now, more recently, over last week, the top performing Small Cap Index stocks on the move are


|
||||||||||||||||||||||||||||||||||||||||||||||||
| 12Stocks.com: Investing in Smallcap Index using Exchange Traded Funds | |
|
The following table shows list of key exchange traded funds (ETF) that
help investors track Smallcap index. The following list also includes leveraged ETF funds that track twice or thrice the daily returns of Smallcap indices. Short or inverse ETF funds move in the opposite direction to the index they track and are useful during market pullbacks or during bear markets. Quick View: Move mouse or cursor over ETF symbol (ticker) to view short-term technical chart and over ETF name to view long term chart. Click on ticker or stock name for detailed view. Click on to add stock symbol to your watchlist and to view watchlist. |
12Stocks.com List of ETFs that track Smallcap Index
| Ticker | ETF Name | Watchlist | Recent Price | Smart Investing & Trading Score | Change % | Week % | Year-to-date % |
| IWM | iShares Russell 2000 | | 208.08 | 76 | 0.07 | 1.85 | 3.67% |
| VTWO | Vanguard Russell 2000 ETF | | 84.11 | 71 | 0.00 | 1.8 | 3.71% |
| IJR | iShares Core S&P Small-Cap | | 110.39 | 68 | -0.22 | 1.29 | 1.98% |
| IWN | iShares Russell 2000 Value | | 158.71 | 76 | -0.07 | 1.61 | 2.18% |
| IWO | iShares Russell 2000 Growth | | 265.15 | 63 | -0.75 | 2.01 | 5.13% |
| IJS | iShares S&P Small-Cap 600 Value | | 101.87 | 76 | -0.15 | 1.34 | -1.16% |
| IJT | iShares S&P Small-Cap 600 Growth | | 131.34 | 71 | 0.04 | 1.14 | 4.95% |
| XSLV | PowerShares S&P SmallCap Low Volatil ETF | | 44.48 | 83 | -0.01 | 0.55 | 0.74% |
| SAA | ProShares Ultra SmallCap600 | | 24.90 | 71 | 0.50 | 2.28 | -0.18% |
| SMLV | SPDR SSGA US Small Cap Low Volatil ETF | | 113.28 | 95 | 0.43 | 1.85 | 0.68% |
| SDD | ProShares UltraShort SmallCap600 | | 17.84 | 35 | 0.96 | -2.41 | -3.19% |
| SBB | ProShares Short SmallCap600 | | 15.77 | 25 | 0.41 | -1.14 | -0.98% |
| 12Stocks.com: Charts, Trends, Fundamental Data and Performances of SmallCap Stocks | |
|
We now take in-depth look at all SmallCap stocks including charts, multi-period performances and overall trends (as measured by Smart Investing & Trading Score). One can sort SmallCap stocks (click link to choose) by Daily, Weekly and by Year-to-Date performances. Also, one can sort by size of the company or by market capitalization. |
| Select Your Default Chart Type: | |||||
| |||||
| Click on stock symbol or name for detailed view. Click on to add stock symbol to your watchlist and to view watchlist. Quick View: Move mouse or cursor over "Daily" to quickly view daily technical stock chart and over "Weekly" to view weekly technical stock chart. | |||||

 | SGRY Surgery Partners, Inc. |
| Sector: Health Care | |
| SubSector: Hospitals | |
| MarketCap: 328.446 Millions | |
| Recent Price: 25.83 Smart Investing & Trading Score: 32 | |
| Day Percent Change: -2.34% Day Change: -0.62 | |
| Week Change: -2.86% Year-to-date Change: -19.3% | |
| SGRY Links: Profile News Message Board | |
| Charts:- Daily , Weekly | |
| Add SGRY to Watchlist: View: Get Complete SGRY Trend Analysis ➞ | |
 | ERII Energy Recovery, Inc. |
| Sector: Industrials | |
| SubSector: Pollution & Treatment Controls | |
| MarketCap: 429.375 Millions | |
| Recent Price: 13.71 Smart Investing & Trading Score: 20 | |
| Day Percent Change: -2.35% Day Change: -0.33 | |
| Week Change: -1.79% Year-to-date Change: -27.2% | |
| ERII Links: Profile News Message Board | |
| Charts:- Daily , Weekly | |
| Add ERII to Watchlist: View: Get Complete ERII Trend Analysis ➞ | |
 | ELF e.l.f. Beauty, Inc. |
| Sector: Consumer Staples | |
| SubSector: Personal Products | |
| MarketCap: 497.985 Millions | |
| Recent Price: 158.45 Smart Investing & Trading Score: 0 | |
| Day Percent Change: -2.35% Day Change: -3.81 | |
| Week Change: -3.44% Year-to-date Change: 9.8% | |
| ELF Links: Profile News Message Board | |
| Charts:- Daily , Weekly | |
| Add ELF to Watchlist: View: Get Complete ELF Trend Analysis ➞ | |
 | ARCT Arcturus Therapeutics Holdings Inc. |
| Sector: Health Care | |
| SubSector: Biotechnology | |
| MarketCap: 241.385 Millions | |
| Recent Price: 29.78 Smart Investing & Trading Score: 45 | |
| Day Percent Change: -2.36% Day Change: -0.72 | |
| Week Change: 9.24% Year-to-date Change: -5.6% | |
| ARCT Links: Profile News Message Board | |
| Charts:- Daily , Weekly | |
| Add ARCT to Watchlist: View: Get Complete ARCT Trend Analysis ➞ | |
 | ARAY Accuray Incorporated |
| Sector: Health Care | |
| SubSector: Medical Appliances & Equipment | |
| MarketCap: 169.58 Millions | |
| Recent Price: 1.63 Smart Investing & Trading Score: 35 | |
| Day Percent Change: -2.40% Day Change: -0.04 | |
| Week Change: 0.62% Year-to-date Change: -42.4% | |
| ARAY Links: Profile News Message Board | |
| Charts:- Daily , Weekly | |
| Add ARAY to Watchlist: View: Get Complete ARAY Trend Analysis ➞ | |
 | RAPT RAPT Therapeutics, Inc. |
| Sector: Health Care | |
| SubSector: Biotechnology | |
| MarketCap: 368.785 Millions | |
| Recent Price: 4.04 Smart Investing & Trading Score: 28 | |
| Day Percent Change: -2.42% Day Change: -0.10 | |
| Week Change: -6.7% Year-to-date Change: -83.7% | |
| RAPT Links: Profile News Message Board | |
| Charts:- Daily , Weekly | |
| Add RAPT to Watchlist: View: Get Complete RAPT Trend Analysis ➞ | |
 | GSAT Globalstar, Inc. |
| Sector: Technology | |
| SubSector: Wireless Communications | |
| MarketCap: 485.127 Millions | |
| Recent Price: 1.20 Smart Investing & Trading Score: 10 | |
| Day Percent Change: -2.44% Day Change: -0.03 | |
| Week Change: -2.44% Year-to-date Change: -38.1% | |
| GSAT Links: Profile News Message Board | |
| Charts:- Daily , Weekly | |
| Add GSAT to Watchlist: View: Get Complete GSAT Trend Analysis ➞ | |
 | GDYN Grid Dynamics Holdings, Inc. |
| Sector: Technology | |
| SubSector: Information Technology Services | |
| MarketCap: 318.968 Millions | |
| Recent Price: 10.22 Smart Investing & Trading Score: 25 | |
| Day Percent Change: -2.48% Day Change: -0.26 | |
| Week Change: -0.1% Year-to-date Change: -23.3% | |
| GDYN Links: Profile News Message Board | |
| Charts:- Daily , Weekly | |
| Add GDYN to Watchlist: View: Get Complete GDYN Trend Analysis ➞ | |
 | ATRO Astronics Corporation |
| Sector: Industrials | |
| SubSector: Aerospace/Defense Products & Services | |
| MarketCap: 287.201 Millions | |
| Recent Price: 20.36 Smart Investing & Trading Score: 83 | |
| Day Percent Change: -2.49% Day Change: -0.52 | |
| Week Change: 10.23% Year-to-date Change: 16.9% | |
| ATRO Links: Profile News Message Board | |
| Charts:- Daily , Weekly | |
| Add ATRO to Watchlist: View: Get Complete ATRO Trend Analysis ➞ | |
 | NEWT Newtek Business Services Corp. |
| Sector: Services & Goods | |
| SubSector: Business Services | |
| MarketCap: 243.982 Millions | |
| Recent Price: 13.67 Smart Investing & Trading Score: 68 | |
| Day Percent Change: -2.50% Day Change: -0.35 | |
| Week Change: 6.96% Year-to-date Change: -0.9% | |
| NEWT Links: Profile News Message Board | |
| Charts:- Daily , Weekly | |
| Add NEWT to Watchlist: View: Get Complete NEWT Trend Analysis ➞ | |
 | CHUY Chuy s Holdings, Inc. |
| Sector: Services & Goods | |
| SubSector: Restaurants | |
| MarketCap: 159.17 Millions | |
| Recent Price: 27.47 Smart Investing & Trading Score: 0 | |
| Day Percent Change: -2.55% Day Change: -0.72 | |
| Week Change: -2.24% Year-to-date Change: -28.2% | |
| CHUY Links: Profile News Message Board | |
| Charts:- Daily , Weekly | |
| Add CHUY to Watchlist: View: Get Complete CHUY Trend Analysis ➞ | |
 | OMI Owens & Minor, Inc. |
| Sector: Services & Goods | |
| SubSector: Medical Equipment Wholesale | |
| MarketCap: 403.92 Millions | |
| Recent Price: 18.62 Smart Investing & Trading Score: 17 | |
| Day Percent Change: -2.56% Day Change: -0.49 | |
| Week Change: -0.05% Year-to-date Change: -3.4% | |
| OMI Links: Profile News Message Board | |
| Charts:- Daily , Weekly | |
| Add OMI to Watchlist: View: Get Complete OMI Trend Analysis ➞ | |
 | THRD Third Harmonic Bio, Inc. |
| Sector: Health Care | |
| SubSector: Biotechnology | |
| MarketCap: 190 Millions | |
| Recent Price: 13.87 Smart Investing & Trading Score: 100 | |
| Day Percent Change: -2.57% Day Change: -0.37 | |
| Week Change: 16.51% Year-to-date Change: 25.9% | |
| THRD Links: Profile News Message Board | |
| Charts:- Daily , Weekly | |
| Add THRD to Watchlist: View: Get Complete THRD Trend Analysis ➞ | |
 | EXTR Extreme Networks, Inc. |
| Sector: Technology | |
| SubSector: Communication Equipment | |
| MarketCap: 339.939 Millions | |
| Recent Price: 11.67 Smart Investing & Trading Score: 74 | |
| Day Percent Change: -2.59% Day Change: -0.31 | |
| Week Change: 7.96% Year-to-date Change: -33.8% | |
| EXTR Links: Profile News Message Board | |
| Charts:- Daily , Weekly | |
| Add EXTR to Watchlist: View: Get Complete EXTR Trend Analysis ➞ | |
 | NUVB Nuvation Bio Inc. |
| Sector: Health Care | |
| SubSector: Biotechnology | |
| MarketCap: 381 Millions | |
| Recent Price: 3.32 Smart Investing & Trading Score: 65 | |
| Day Percent Change: -2.64% Day Change: -0.09 | |
| Week Change: 2.15% Year-to-date Change: 119.1% | |
| NUVB Links: Profile News Message Board | |
| Charts:- Daily , Weekly | |
| Add NUVB to Watchlist: View: Get Complete NUVB Trend Analysis ➞ | |
 | CGEM Cullinan Oncology, Inc. |
| Sector: Health Care | |
| SubSector: Biotechnology | |
| MarketCap: 433 Millions | |
| Recent Price: 23.17 Smart Investing & Trading Score: 36 | |
| Day Percent Change: -2.69% Day Change: -0.64 | |
| Week Change: -12.8% Year-to-date Change: 127.3% | |
| CGEM Links: Profile News Message Board | |
| Charts:- Daily , Weekly | |
| Add CGEM to Watchlist: View: Get Complete CGEM Trend Analysis ➞ | |
 | CYH Community Health Systems, Inc. |
| Sector: Health Care | |
| SubSector: Hospitals | |
| MarketCap: 371.546 Millions | |
| Recent Price: 3.61 Smart Investing & Trading Score: 68 | |
| Day Percent Change: -2.70% Day Change: -0.10 | |
| Week Change: 11.76% Year-to-date Change: 15.3% | |
| CYH Links: Profile News Message Board | |
| Charts:- Daily , Weekly | |
| Add CYH to Watchlist: View: Get Complete CYH Trend Analysis ➞ | |
 | MIRM Mirum Pharmaceuticals, Inc. |
| Sector: Health Care | |
| SubSector: Biotechnology | |
| MarketCap: 309.585 Millions | |
| Recent Price: 24.07 Smart Investing & Trading Score: 10 | |
| Day Percent Change: -2.75% Day Change: -0.68 | |
| Week Change: -2.79% Year-to-date Change: -18.5% | |
| MIRM Links: Profile News Message Board | |
| Charts:- Daily , Weekly | |
| Add MIRM to Watchlist: View: Get Complete MIRM Trend Analysis ➞ | |
 | BSIG BrightSphere Investment Group Inc. |
| Sector: Financials | |
| SubSector: Asset Management | |
| MarketCap: 430.103 Millions | |
| Recent Price: 22.81 Smart Investing & Trading Score: 53 | |
| Day Percent Change: -2.77% Day Change: -0.65 | |
| Week Change: 0.46% Year-to-date Change: 19.1% | |
| BSIG Links: Profile News Message Board | |
| Charts:- Daily , Weekly | |
| Add BSIG to Watchlist: View: Get Complete BSIG Trend Analysis ➞ | |
 | ACMR ACM Research, Inc. |
| Sector: Technology | |
| SubSector: Semiconductor Equipment & Materials | |
| MarketCap: 438.718 Millions | |
| Recent Price: 23.80 Smart Investing & Trading Score: 25 | |
| Day Percent Change: -2.82% Day Change: -0.69 | |
| Week Change: 2.76% Year-to-date Change: 21.8% | |
| ACMR Links: Profile News Message Board | |
| Charts:- Daily , Weekly | |
| Add ACMR to Watchlist: View: Get Complete ACMR Trend Analysis ➞ | |
 | BCRX BioCryst Pharmaceuticals, Inc. |
| Sector: Health Care | |
| SubSector: Biotechnology | |
| MarketCap: 369.385 Millions | |
| Recent Price: 6.28 Smart Investing & Trading Score: 90 | |
| Day Percent Change: -2.94% Day Change: -0.19 | |
| Week Change: 18.05% Year-to-date Change: 4.8% | |
| BCRX Links: Profile News Message Board | |
| Charts:- Daily , Weekly | |
| Add BCRX to Watchlist: View: Get Complete BCRX Trend Analysis ➞ | |
 | SNDX Syndax Pharmaceuticals, Inc. |
| Sector: Health Care | |
| SubSector: Biotechnology | |
| MarketCap: 365.985 Millions | |
| Recent Price: 20.29 Smart Investing & Trading Score: 0 | |
| Day Percent Change: -3.01% Day Change: -0.63 | |
| Week Change: -6.71% Year-to-date Change: -6.1% | |
| SNDX Links: Profile News Message Board | |
| Charts:- Daily , Weekly | |
| Add SNDX to Watchlist: View: Get Complete SNDX Trend Analysis ➞ | |
 | ARLO Arlo Technologies, Inc. |
| Sector: Technology | |
| SubSector: Security Software & Services | |
| MarketCap: 163.317 Millions | |
| Recent Price: 11.91 Smart Investing & Trading Score: 49 | |
| Day Percent Change: -3.17% Day Change: -0.39 | |
| Week Change: 4.11% Year-to-date Change: 25.1% | |
| ARLO Links: Profile News Message Board | |
| Charts:- Daily , Weekly | |
| Add ARLO to Watchlist: View: Get Complete ARLO Trend Analysis ➞ | |
 | BBAI BigBear.ai Holdings, Inc. |
| Sector: Technology | |
| SubSector: Information Technology Services | |
| MarketCap: 339 Millions | |
| Recent Price: 1.51 Smart Investing & Trading Score: 17 | |
| Day Percent Change: -3.21% Day Change: -0.05 | |
| Week Change: 8.63% Year-to-date Change: -29.1% | |
| BBAI Links: Profile News Message Board | |
| Charts:- Daily , Weekly | |
| Add BBAI to Watchlist: View: Get Complete BBAI Trend Analysis ➞ | |
 | WNC Wabash National Corporation |
| Sector: Consumer Staples | |
| SubSector: Trucks & Other Vehicles | |
| MarketCap: 482.597 Millions | |
| Recent Price: 22.47 Smart Investing & Trading Score: 0 | |
| Day Percent Change: -3.23% Day Change: -0.75 | |
| Week Change: -3.48% Year-to-date Change: -12.3% | |
| WNC Links: Profile News Message Board | |
| Charts:- Daily , Weekly | |
| Add WNC to Watchlist: View: Get Complete WNC Trend Analysis ➞ | |
| For tabular summary view of above stock list: Summary View ➞ 0 - 25 , 25 - 50 , 50 - 75 , 75 - 100 , 100 - 125 , 125 - 150 , 150 - 175 , 175 - 200 , 200 - 225 , 225 - 250 , 250 - 275 , 275 - 300 , 300 - 325 , 325 - 350 , 350 - 375 , 375 - 400 , 400 - 425 , 425 - 450 , 450 - 475 , 475 - 500 , 500 - 525 | ||
| Click To Change The Sort Order: By Market Cap or Company Size Performance: Year-to-date, Week and Day | |
| Select Chart Type: | ||
| Too many stocks? View smallcap stocks filtered by marketcap & sector |
| Marketcap: All SmallCap Stocks (default-no microcap), Large, Mid-Range, Small & MicroCap |
| Sector: Tech, Finance, Energy, Staples, Retail, Industrial, Materials, Utilities & Medical |
|
Best Stocks Today 12Stocks.com |
© 2024 12Stocks.com Terms & Conditions Privacy Contact Us
All Information Provided Only For Education And Not To Be Used For Investing or Trading. See Terms & Conditions


One More Thing ... Get Best Stocks Delivered Daily!
Never Ever Miss A Move With Our Top Ten Stocks Lists
Find Best Stocks In Any Market - Bull or Bear Market
Take A Peek At Our Top Ten Stocks Lists: Daily, Weekly, Year-to-Date & Top Trends
Find Best Stocks In Any Market - Bull or Bear Market
Take A Peek At Our Top Ten Stocks Lists: Daily, Weekly, Year-to-Date & Top Trends
Smallcap Stocks With Best Up Trends [0-bearish to 100-bullish]: CommScope Holding[100], Coeur Mining[100], Hecla Mining[100], MicroStrategy [100], Enovix [100], Rayonier Advanced[100], Nurix [100], Energy Fuels[100], NovaGold Resources[100], Piedmont Lithium[100], Wave Life[100]
Best Smallcap Stocks Year-to-Date:
CareMax [495.88%], Bakkt [413.9%], Janux [338.34%], Viking [260.02%], Alpine Immune[241.23%], Longboard [238.63%], Avidity Biosciences[226.33%], Super Micro[212.35%], Arcutis Bio[184.83%], Sweetgreen [180.97%], Novavax [171.04%] Best Smallcap Stocks This Week:
Vaxxinity [58.82%], Novavax [46.51%], Vicarious Surgical[45.62%], Harrow Health[44.48%], ProKidney [44.31%], Workhorse Group[36.06%], Maxeon Solar[35.94%], Fossil Group[35.44%], Humacyte [34.68%], MicroStrategy [34.23%], Cadiz [33.48%] Best Smallcap Stocks Daily:
Vaxxinity [45.95%], Presto Automation[31.90%], Vicarious Surgical[27.93%], Orchestra BioMed[12.77%], CommScope Holding[11.86%], Coeur Mining[11.57%], Hecla Mining[11.11%], MicroStrategy [10.04%], Tenaya [9.65%], Bakkt [9.25%], Enovix [9.25%]