
 Login Sign Up


| |||||
 |  | ||||

| 12Stocks.com Market Intelligence |
Best SmallCap Stocks
|
| In a hurry? Small Cap Stock Lists: Performance Trends Table, Stock Charts
Sort Small Cap stocks: Daily, Weekly, Year-to-Date, Market Cap & Trends. Filter Small Cap stocks list by sector: Show all, Tech, Finance, Energy, Staples, Retail, Industrial, Materials, Utilities and HealthCare Filter Small Cap stocks list by size: All Large Medium Small and MicroCap |
| 12Stocks.com Small Cap Stocks Performances & Trends Daily | |||||||||
|
|  The overall Smart Investing & Trading Score is 76 (0-bearish to 100-bullish) which puts Small Cap index in short term neutral to bullish trend. The Smart Investing & Trading Score from previous trading session is 90 and hence a deterioration of trend.
| ||||||||
Here are the Smart Investing & Trading Scores of the most requested small cap stocks at 12Stocks.com (click stock name for detailed review):
|


| 12Stocks.com: Investing in Smallcap Index with Stocks | |
|
The following table helps investors and traders sort through current performance and trends (as measured by Smart Investing & Trading Score) of various
stocks in the Smallcap Index. Quick View: Move mouse or cursor over stock symbol (ticker) to view short-term technical chart and over stock name to view long term chart. Click on  to add stock symbol to your watchlist and to add stock symbol to your watchlist and  to view watchlist. Click on any ticker or stock name for detailed market intelligence report for that stock. to view watchlist. Click on any ticker or stock name for detailed market intelligence report for that stock. |
12Stocks.com Performance of Stocks in Smallcap Index
| Ticker | Stock Name | Watchlist | Category | Recent Price | Smart Investing & Trading Score | Change % | YTD Change% |
| VAXX | Vaxxinity |   | Health Care | 0.08 | 42 | 45.95 | -90.36% |
| PRST | Presto Automation | | Technology | 0.22 | 69 | 31.90 | -59.31% |
| RBOT | Vicarious Surgical | | Health Care | 0.42 | 74 | 27.93 | 15.13% |
| OBIO | Orchestra BioMed | | Health Care | 5.21 | 59 | 12.77 | -42.81% |
| TNYA | Tenaya | | Health Care | 4.66 | 69 | 9.65 | 46.54% |
| BKKT | Bakkt | | Technology | 11.46 | 90 | 9.25 | 413.90% |
| AIRS | AirSculpt | | Health Care | 4.66 | 32 | 7.87 | -37.78% |
| SKYT | SkyWater | | Technology | 8.67 | 32 | 6.91 | -10.06% |
| ERAS | Erasca | | Health Care | 1.97 | 52 | 6.49 | -7.51% |
| WVE | Wave Life | | Health Care | 6.26 | 100 | 6.10 | 23.96% |
| FFWM | First Foundation | | Financials | 6.27 | 74 | 6.09 | -35.23% |
| MRSN | Mersana | | Health Care | 2.73 | 32 | 5.81 | 17.67% |
| GRTS | Gritstone Oncology | | Health Care | 0.79 | 37 | 5.46 | -61.40% |
| GWH | ESS Tech | | Industrials | 0.78 | 40 | 5.46 | -31.83% |
| RPHM | Reneo | | Health Care | 1.75 | 88 | 5.42 | 8.02% |
| FOSL | Fossil Group | | Consumer Staples | 1.31 | 100 | 5.22 | -10.27% |
| CIX | CompX | | Services & Goods | 24.62 | 58 | 5.17 | -2.61% |
| LUNA | Luna Innovations | | Technology | 3.00 | 52 | 5.08 | -54.89% |
| TRUE | TrueCar | | Technology | 3.01 | 64 | 4.88 | -13.01% |
| DSP | Viant | | Technology | 10.19 | 95 | 4.84 | 46.83% |
| GCI | Gannett Co | | Services & Goods | 3.72 | 100 | 4.79 | 61.74% |
| CZNC | Citizens & Northern | | Financials | 18.81 | 100 | 4.62 | -16.14% |
| RCEL | Avita Medical | | Health Care | 8.27 | 15 | 4.42 | -39.72% |
| CMAX | CareMax | | Health Care | 2.89 | 35 | 4.33 | 495.88% |
| SFST | Southern First | | Financials | 29.00 | 64 | 4.20 | -21.83% |
| For chart view version of above stock list: Chart View ➞ 0 - 25 , 25 - 50 , 50 - 75 , 75 - 100 , 100 - 125 , 125 - 150 , 150 - 175 , 175 - 200 , 200 - 225 , 225 - 250 , 250 - 275 , 275 - 300 , 300 - 325 , 325 - 350 , 350 - 375 , 375 - 400 , 400 - 425 , 425 - 450 , 450 - 475 , 475 - 500 , 500 - 525 | ||
 | Click To Change The Sort Order: By Market Cap or Company Size Performance: Year-to-date, Week and Day |  |
| Too many stocks? View smallcap stocks filtered by marketcap & sector |
| Marketcap: All SmallCap Stocks (default-no microcap), Large, Mid-Range, Small |
| Smallcap Sector: Tech, Finance, Energy, Staples, Retail, Industrial, Materials, & Medical |
|
Get the most comprehensive stock market coverage daily at 12Stocks.com ➞ Best Stocks Today ➞ Best Stocks Weekly ➞ Best Stocks Year-to-Date ➞ Best Stocks Trends ➞  Best Stocks Today 12Stocks.com Best Nasdaq Stocks ➞ Best S&P 500 Stocks ➞ Best Tech Stocks ➞ Best Biotech Stocks ➞ |
| Detailed Overview of SmallCap Stocks |
| SmallCap Technical Overview, Leaders & Laggards, Top SmallCap ETF Funds & Detailed SmallCap Stocks List, Charts, Trends & More |
| Smallcap: Technical Analysis, Trends & YTD Performance | |
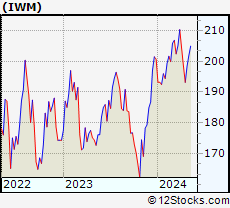
| SmallCap segment as represented by
IWM, an exchange-traded fund [ETF], holds basket of thousands of smallcap stocks from across all major sectors of the US stock market. The smallcap index (contains stocks like Riverbed & Sotheby's) is up by 3.67% and is currently underperforming the overall market by -6.9% year-to-date. Below is a quick view of technical charts and trends: | |
 IWM Weekly Chart |
|
| Long Term Trend: Very Good | |
| Medium Term Trend: Very Good | |
 IWM Daily Chart |
|
| Short Term Trend: Good | |
| Overall Trend Score: 76 | |
| YTD Performance: 3.67% | |
| **Trend Scores & Views Are Only For Educational Purposes And Not For Investing | |
| 12Stocks.com: Top Performing Small Cap Index Stocks | ||||||||||||||||||||||||||||||||||||||||||||||||
 The top performing Small Cap Index stocks year to date are
Now, more recently, over last week, the top performing Small Cap Index stocks on the move are


|
||||||||||||||||||||||||||||||||||||||||||||||||
| 12Stocks.com: Investing in Smallcap Index using Exchange Traded Funds | |
|
The following table shows list of key exchange traded funds (ETF) that
help investors track Smallcap index. The following list also includes leveraged ETF funds that track twice or thrice the daily returns of Smallcap indices. Short or inverse ETF funds move in the opposite direction to the index they track and are useful during market pullbacks or during bear markets. Quick View: Move mouse or cursor over ETF symbol (ticker) to view short-term technical chart and over ETF name to view long term chart. Click on ticker or stock name for detailed view. Click on to add stock symbol to your watchlist and to view watchlist. |
12Stocks.com List of ETFs that track Smallcap Index
| Ticker | ETF Name | Watchlist | Recent Price | Smart Investing & Trading Score | Change % | Week % | Year-to-date % |
| IWM | iShares Russell 2000 | | 208.08 | 76 | 0.07 | 1.85 | 3.67% |
| VTWO | Vanguard Russell 2000 ETF | | 84.11 | 71 | 0.00 | 1.8 | 3.71% |
| IJR | iShares Core S&P Small-Cap | | 110.39 | 68 | -0.22 | 1.29 | 1.98% |
| IWN | iShares Russell 2000 Value | | 158.71 | 76 | -0.07 | 1.61 | 2.18% |
| IWO | iShares Russell 2000 Growth | | 265.15 | 63 | -0.75 | 2.01 | 5.13% |
| IJS | iShares S&P Small-Cap 600 Value | | 101.87 | 76 | -0.15 | 1.34 | -1.16% |
| IJT | iShares S&P Small-Cap 600 Growth | | 131.34 | 71 | 0.04 | 1.14 | 4.95% |
| XSLV | PowerShares S&P SmallCap Low Volatil ETF | | 44.48 | 83 | -0.01 | 0.55 | 0.74% |
| SAA | ProShares Ultra SmallCap600 | | 24.90 | 71 | 0.50 | 2.28 | -0.18% |
| SMLV | SPDR SSGA US Small Cap Low Volatil ETF | | 113.28 | 95 | 0.43 | 1.85 | 0.68% |
| SDD | ProShares UltraShort SmallCap600 | | 17.84 | 35 | 0.96 | -2.41 | -3.19% |
| SBB | ProShares Short SmallCap600 | | 15.77 | 25 | 0.41 | -1.14 | -0.98% |
| 12Stocks.com: Charts, Trends, Fundamental Data and Performances of SmallCap Stocks | |
|
We now take in-depth look at all SmallCap stocks including charts, multi-period performances and overall trends (as measured by Smart Investing & Trading Score). One can sort SmallCap stocks (click link to choose) by Daily, Weekly and by Year-to-Date performances. Also, one can sort by size of the company or by market capitalization. |
| Select Your Default Chart Type: | |||||
| |||||
| Click on stock symbol or name for detailed view. Click on to add stock symbol to your watchlist and to view watchlist. Quick View: Move mouse or cursor over "Daily" to quickly view daily technical stock chart and over "Weekly" to view weekly technical stock chart. | |||||

 | VAXX Vaxxinity, Inc. |
| Sector: Health Care | |
| SubSector: Biotechnology | |
| MarketCap: 320 Millions | |
| Recent Price: 0.08 Smart Investing & Trading Score: 42 | |
| Day Percent Change: 45.95% Day Change: 0.03 | |
| Week Change: 58.82% Year-to-date Change: -90.4% | |
| VAXX Links: Profile News Message Board | |
| Charts:- Daily , Weekly | |
| Add VAXX to Watchlist: View: Get Complete VAXX Trend Analysis ➞ | |
 | PRST Presto Automation Inc. |
| Sector: Technology | |
| SubSector: Software - Application | |
| MarketCap: 238 Millions | |
| Recent Price: 0.22 Smart Investing & Trading Score: 69 | |
| Day Percent Change: 31.90% Day Change: 0.05 | |
| Week Change: 29.52% Year-to-date Change: -59.3% | |
| PRST Links: Profile News Message Board | |
| Charts:- Daily , Weekly | |
| Add PRST to Watchlist: View: Get Complete PRST Trend Analysis ➞ | |
 | RBOT Vicarious Surgical Inc. |
| Sector: Health Care | |
| SubSector: Medical Devices | |
| MarketCap: 241 Millions | |
| Recent Price: 0.42 Smart Investing & Trading Score: 74 | |
| Day Percent Change: 27.93% Day Change: 0.09 | |
| Week Change: 45.62% Year-to-date Change: 15.1% | |
| RBOT Links: Profile News Message Board | |
| Charts:- Daily , Weekly | |
| Add RBOT to Watchlist: View: Get Complete RBOT Trend Analysis ➞ | |
 | OBIO Orchestra BioMed Holdings, Inc. |
| Sector: Health Care | |
| SubSector: Biotechnology | |
| MarketCap: 271 Millions | |
| Recent Price: 5.21 Smart Investing & Trading Score: 59 | |
| Day Percent Change: 12.77% Day Change: 0.59 | |
| Week Change: 10.62% Year-to-date Change: -42.8% | |
| OBIO Links: Profile News Message Board | |
| Charts:- Daily , Weekly | |
| Add OBIO to Watchlist: View: Get Complete OBIO Trend Analysis ➞ | |
 | TNYA Tenaya Therapeutics, Inc. |
| Sector: Health Care | |
| SubSector: Biotechnology | |
| MarketCap: 395 Millions | |
| Recent Price: 4.66 Smart Investing & Trading Score: 69 | |
| Day Percent Change: 9.65% Day Change: 0.41 | |
| Week Change: 10.95% Year-to-date Change: 46.5% | |
| TNYA Links: Profile News Message Board | |
| Charts:- Daily , Weekly | |
| Add TNYA to Watchlist: View: Get Complete TNYA Trend Analysis ➞ | |
 | BKKT Bakkt Holdings, Inc. |
| Sector: Technology | |
| SubSector: Software - Infrastructure | |
| MarketCap: 335 Millions | |
| Recent Price: 11.46 Smart Investing & Trading Score: 90 | |
| Day Percent Change: 9.25% Day Change: 0.97 | |
| Week Change: 16.46% Year-to-date Change: 413.9% | |
| BKKT Links: Profile News Message Board | |
| Charts:- Daily , Weekly | |
| Add BKKT to Watchlist: View: Get Complete BKKT Trend Analysis ➞ | |
 | AIRS AirSculpt Technologies, Inc. |
| Sector: Health Care | |
| SubSector: Medical Care Facilities | |
| MarketCap: 497 Millions | |
| Recent Price: 4.66 Smart Investing & Trading Score: 32 | |
| Day Percent Change: 7.87% Day Change: 0.34 | |
| Week Change: -1.69% Year-to-date Change: -37.8% | |
| AIRS Links: Profile News Message Board | |
| Charts:- Daily , Weekly | |
| Add AIRS to Watchlist: View: Get Complete AIRS Trend Analysis ➞ | |
 | SKYT SkyWater Technology, Inc. |
| Sector: Technology | |
| SubSector: Semiconductors | |
| MarketCap: 394 Millions | |
| Recent Price: 8.67 Smart Investing & Trading Score: 32 | |
| Day Percent Change: 6.91% Day Change: 0.56 | |
| Week Change: 13.48% Year-to-date Change: -10.1% | |
| SKYT Links: Profile News Message Board | |
| Charts:- Daily , Weekly | |
| Add SKYT to Watchlist: View: Get Complete SKYT Trend Analysis ➞ | |
 | ERAS Erasca, Inc. |
| Sector: Health Care | |
| SubSector: Biotechnology | |
| MarketCap: 419 Millions | |
| Recent Price: 1.97 Smart Investing & Trading Score: 52 | |
| Day Percent Change: 6.49% Day Change: 0.12 | |
| Week Change: 6.49% Year-to-date Change: -7.5% | |
| ERAS Links: Profile News Message Board | |
| Charts:- Daily , Weekly | |
| Add ERAS to Watchlist: View: Get Complete ERAS Trend Analysis ➞ | |
 | WVE Wave Life Sciences Ltd. |
| Sector: Health Care | |
| SubSector: Biotechnology | |
| MarketCap: 452.785 Millions | |
| Recent Price: 6.26 Smart Investing & Trading Score: 100 | |
| Day Percent Change: 6.10% Day Change: 0.36 | |
| Week Change: 11.39% Year-to-date Change: 24.0% | |
| WVE Links: Profile News Message Board | |
| Charts:- Daily , Weekly | |
| Add WVE to Watchlist: View: Get Complete WVE Trend Analysis ➞ | |
 | FFWM First Foundation Inc. |
| Sector: Financials | |
| SubSector: Regional - Midwest Banks | |
| MarketCap: 457.17 Millions | |
| Recent Price: 6.27 Smart Investing & Trading Score: 74 | |
| Day Percent Change: 6.09% Day Change: 0.36 | |
| Week Change: 18.98% Year-to-date Change: -35.2% | |
| FFWM Links: Profile News Message Board | |
| Charts:- Daily , Weekly | |
| Add FFWM to Watchlist: View: Get Complete FFWM Trend Analysis ➞ | |
 | MRSN Mersana Therapeutics, Inc. |
| Sector: Health Care | |
| SubSector: Biotechnology | |
| MarketCap: 224.385 Millions | |
| Recent Price: 2.73 Smart Investing & Trading Score: 32 | |
| Day Percent Change: 5.81% Day Change: 0.15 | |
| Week Change: 0.74% Year-to-date Change: 17.7% | |
| MRSN Links: Profile News Message Board | |
| Charts:- Daily , Weekly | |
| Add MRSN to Watchlist: View: Get Complete MRSN Trend Analysis ➞ | |
 | GRTS Gritstone Oncology, Inc. |
| Sector: Health Care | |
| SubSector: Biotechnology | |
| MarketCap: 240.085 Millions | |
| Recent Price: 0.79 Smart Investing & Trading Score: 37 | |
| Day Percent Change: 5.46% Day Change: 0.04 | |
| Week Change: 0.37% Year-to-date Change: -61.4% | |
| GRTS Links: Profile News Message Board | |
| Charts:- Daily , Weekly | |
| Add GRTS to Watchlist: View: Get Complete GRTS Trend Analysis ➞ | |
 | GWH ESS Tech, Inc. |
| Sector: Industrials | |
| SubSector: Electrical Equipment & Parts | |
| MarketCap: 239 Millions | |
| Recent Price: 0.78 Smart Investing & Trading Score: 40 | |
| Day Percent Change: 5.46% Day Change: 0.04 | |
| Week Change: 5.49% Year-to-date Change: -31.8% | |
| GWH Links: Profile News Message Board | |
| Charts:- Daily , Weekly | |
| Add GWH to Watchlist: View: Get Complete GWH Trend Analysis ➞ | |
 | RPHM Reneo Pharmaceuticals, Inc. |
| Sector: Health Care | |
| SubSector: Biotechnology | |
| MarketCap: 233 Millions | |
| Recent Price: 1.75 Smart Investing & Trading Score: 88 | |
| Day Percent Change: 5.42% Day Change: 0.09 | |
| Week Change: -3.31% Year-to-date Change: 8.0% | |
| RPHM Links: Profile News Message Board | |
| Charts:- Daily , Weekly | |
| Add RPHM to Watchlist: View: Get Complete RPHM Trend Analysis ➞ | |
 | FOSL Fossil Group, Inc. |
| Sector: Consumer Staples | |
| SubSector: Textile - Apparel Footwear & Accessories | |
| MarketCap: 215.87 Millions | |
| Recent Price: 1.31 Smart Investing & Trading Score: 100 | |
| Day Percent Change: 5.22% Day Change: 0.06 | |
| Week Change: 35.44% Year-to-date Change: -10.3% | |
| FOSL Links: Profile News Message Board | |
| Charts:- Daily , Weekly | |
| Add FOSL to Watchlist: View: Get Complete FOSL Trend Analysis ➞ | |
 | CIX CompX International Inc. |
| Sector: Services & Goods | |
| SubSector: Security & Protection Services | |
| MarketCap: 189.603 Millions | |
| Recent Price: 24.62 Smart Investing & Trading Score: 58 | |
| Day Percent Change: 5.17% Day Change: 1.21 | |
| Week Change: -1.32% Year-to-date Change: -2.6% | |
| CIX Links: Profile News Message Board | |
| Charts:- Daily , Weekly | |
| Add CIX to Watchlist: View: Get Complete CIX Trend Analysis ➞ | |
 | LUNA Luna Innovations Incorporated |
| Sector: Technology | |
| SubSector: Scientific & Technical Instruments | |
| MarketCap: 166.353 Millions | |
| Recent Price: 3.00 Smart Investing & Trading Score: 52 | |
| Day Percent Change: 5.08% Day Change: 0.15 | |
| Week Change: 11.11% Year-to-date Change: -54.9% | |
| LUNA Links: Profile News Message Board | |
| Charts:- Daily , Weekly | |
| Add LUNA to Watchlist: View: Get Complete LUNA Trend Analysis ➞ | |
 | TRUE TrueCar, Inc. |
| Sector: Technology | |
| SubSector: Internet Service Providers | |
| MarketCap: 244.18 Millions | |
| Recent Price: 3.01 Smart Investing & Trading Score: 64 | |
| Day Percent Change: 4.88% Day Change: 0.14 | |
| Week Change: 7.89% Year-to-date Change: -13.0% | |
| TRUE Links: Profile News Message Board | |
| Charts:- Daily , Weekly | |
| Add TRUE to Watchlist: View: Get Complete TRUE Trend Analysis ➞ | |
 | DSP Viant Technology Inc. |
| Sector: Technology | |
| SubSector: Software - Application | |
| MarketCap: 279 Millions | |
| Recent Price: 10.19 Smart Investing & Trading Score: 95 | |
| Day Percent Change: 4.84% Day Change: 0.47 | |
| Week Change: 17.13% Year-to-date Change: 46.8% | |
| DSP Links: Profile News Message Board | |
| Charts:- Daily , Weekly | |
| Add DSP to Watchlist: View: Get Complete DSP Trend Analysis ➞ | |
 | GCI Gannett Co., Inc. |
| Sector: Services & Goods | |
| SubSector: Publishing - Newspapers | |
| MarketCap: 222.322 Millions | |
| Recent Price: 3.72 Smart Investing & Trading Score: 100 | |
| Day Percent Change: 4.79% Day Change: 0.17 | |
| Week Change: 15.89% Year-to-date Change: 61.7% | |
| GCI Links: Profile News Message Board | |
| Charts:- Daily , Weekly | |
| Add GCI to Watchlist: View: Get Complete GCI Trend Analysis ➞ | |
 | CZNC Citizens & Northern Corporation |
| Sector: Financials | |
| SubSector: Regional - Mid-Atlantic Banks | |
| MarketCap: 274.459 Millions | |
| Recent Price: 18.81 Smart Investing & Trading Score: 100 | |
| Day Percent Change: 4.62% Day Change: 0.83 | |
| Week Change: 5.14% Year-to-date Change: -16.1% | |
| CZNC Links: Profile News Message Board | |
| Charts:- Daily , Weekly | |
| Add CZNC to Watchlist: View: Get Complete CZNC Trend Analysis ➞ | |
 | RCEL Avita Medical Limited |
| Sector: Health Care | |
| SubSector: Medical Appliances & Equipment | |
| MarketCap: 481.18 Millions | |
| Recent Price: 8.27 Smart Investing & Trading Score: 15 | |
| Day Percent Change: 4.42% Day Change: 0.35 | |
| Week Change: 1.35% Year-to-date Change: -39.7% | |
| RCEL Links: Profile News Message Board | |
| Charts:- Daily , Weekly | |
| Add RCEL to Watchlist: View: Get Complete RCEL Trend Analysis ➞ | |
 | CMAX CareMax, Inc. |
| Sector: Health Care | |
| SubSector: Health Information Services | |
| MarketCap: 371 Millions | |
| Recent Price: 2.89 Smart Investing & Trading Score: 35 | |
| Day Percent Change: 4.33% Day Change: 0.12 | |
| Week Change: -3.34% Year-to-date Change: 495.9% | |
| CMAX Links: Profile News Message Board | |
| Charts:- Daily , Weekly | |
| Add CMAX to Watchlist: View: Get Complete CMAX Trend Analysis ➞ | |
 | SFST Southern First Bancshares, Inc. |
| Sector: Financials | |
| SubSector: Money Center Banks | |
| MarketCap: 189.099 Millions | |
| Recent Price: 29.00 Smart Investing & Trading Score: 64 | |
| Day Percent Change: 4.20% Day Change: 1.17 | |
| Week Change: 5.07% Year-to-date Change: -21.8% | |
| SFST Links: Profile News Message Board | |
| Charts:- Daily , Weekly | |
| Add SFST to Watchlist: View: Get Complete SFST Trend Analysis ➞ | |
| For tabular summary view of above stock list: Summary View ➞ 0 - 25 , 25 - 50 , 50 - 75 , 75 - 100 , 100 - 125 , 125 - 150 , 150 - 175 , 175 - 200 , 200 - 225 , 225 - 250 , 250 - 275 , 275 - 300 , 300 - 325 , 325 - 350 , 350 - 375 , 375 - 400 , 400 - 425 , 425 - 450 , 450 - 475 , 475 - 500 , 500 - 525 | ||
| Click To Change The Sort Order: By Market Cap or Company Size Performance: Year-to-date, Week and Day | |
| Select Chart Type: | ||
| Too many stocks? View smallcap stocks filtered by marketcap & sector |
| Marketcap: All SmallCap Stocks (default-no microcap), Large, Mid-Range, Small & MicroCap |
| Sector: Tech, Finance, Energy, Staples, Retail, Industrial, Materials, Utilities & Medical |
|
Best Stocks Today 12Stocks.com |
© 2024 12Stocks.com Terms & Conditions Privacy Contact Us
All Information Provided Only For Education And Not To Be Used For Investing or Trading. See Terms & Conditions


One More Thing ... Get Best Stocks Delivered Daily!
Never Ever Miss A Move With Our Top Ten Stocks Lists
Find Best Stocks In Any Market - Bull or Bear Market
Take A Peek At Our Top Ten Stocks Lists: Daily, Weekly, Year-to-Date & Top Trends
Find Best Stocks In Any Market - Bull or Bear Market
Take A Peek At Our Top Ten Stocks Lists: Daily, Weekly, Year-to-Date & Top Trends
Smallcap Stocks With Best Up Trends [0-bearish to 100-bullish]: CommScope Holding[100], Coeur Mining[100], Hecla Mining[100], MicroStrategy [100], Enovix [100], Rayonier Advanced[100], Nurix [100], Energy Fuels[100], NovaGold Resources[100], Piedmont Lithium[100], Wave Life[100]
Best Smallcap Stocks Year-to-Date:
CareMax [495.88%], Bakkt [413.9%], Janux [338.34%], Viking [260.02%], Alpine Immune[241.23%], Longboard [238.63%], Avidity Biosciences[226.33%], Super Micro[212.35%], Arcutis Bio[184.83%], Sweetgreen [180.97%], Novavax [171.04%] Best Smallcap Stocks This Week:
Vaxxinity [58.82%], Novavax [46.51%], Vicarious Surgical[45.62%], Harrow Health[44.48%], ProKidney [44.31%], Workhorse Group[36.06%], Maxeon Solar[35.94%], Fossil Group[35.44%], Humacyte [34.68%], MicroStrategy [34.23%], Cadiz [33.48%] Best Smallcap Stocks Daily:
Vaxxinity [45.95%], Presto Automation[31.90%], Vicarious Surgical[27.93%], Orchestra BioMed[12.77%], CommScope Holding[11.86%], Coeur Mining[11.57%], Hecla Mining[11.11%], MicroStrategy [10.04%], Tenaya [9.65%], Bakkt [9.25%], Enovix [9.25%]