
 Login Sign Up


| |||||
 |  | ||||

| 12Stocks.com Market Intelligence |
Best SmallCap Stocks
|
| In a hurry? Small Cap Stock Lists: Performance Trends Table, Stock Charts
Sort Small Cap stocks: Daily, Weekly, Year-to-Date, Market Cap & Trends. Filter Small Cap stocks list by sector: Show all, Tech, Finance, Energy, Staples, Retail, Industrial, Materials, Utilities and HealthCare Filter Small Cap stocks list by size: All Large Medium Small and MicroCap |
| 12Stocks.com Small Cap Stocks Performances & Trends Daily | |||||||||
|
|  The overall Smart Investing & Trading Score is 76 (0-bearish to 100-bullish) which puts Small Cap index in short term neutral to bullish trend. The Smart Investing & Trading Score from previous trading session is 90 and hence a deterioration of trend.
| ||||||||
Here are the Smart Investing & Trading Scores of the most requested small cap stocks at 12Stocks.com (click stock name for detailed review):
|


| 12Stocks.com: Investing in Smallcap Index with Stocks | |
|
The following table helps investors and traders sort through current performance and trends (as measured by Smart Investing & Trading Score) of various
stocks in the Smallcap Index. Quick View: Move mouse or cursor over stock symbol (ticker) to view short-term technical chart and over stock name to view long term chart. Click on  to add stock symbol to your watchlist and to add stock symbol to your watchlist and  to view watchlist. Click on any ticker or stock name for detailed market intelligence report for that stock. to view watchlist. Click on any ticker or stock name for detailed market intelligence report for that stock. |
12Stocks.com Performance of Stocks in Smallcap Index
| Ticker | Stock Name | Watchlist | Category | Recent Price | Smart Investing & Trading Score | Change % | YTD Change% |
| OII | Oceaneering |   | Energy | 23.72 | 68 | 0.81 | 11.47% |
| OSBC | Old Second | | Financials | 14.92 | 100 | 0.81 | -3.37% |
| SMBC | Southern Missouri | | Financials | 43.60 | 100 | 0.81 | -18.34% |
| VGAS | Verde Clean | | Utilities | 4.96 | 95 | 0.81 | 112.88% |
| TRC | Tejon Ranch | | Financials | 17.98 | 100 | 0.78 | 4.53% |
| VRA | Vera Bradley | | Consumer Staples | 7.82 | 72 | 0.77 | 1.56% |
| REFI | Chicago Atlantic | | Financials | 15.71 | 25 | 0.77 | -2.96% |
| TK | Teekay | | Transports | 9.23 | 95 | 0.76 | 29.09% |
| CPRX | Catalyst | | Health Care | 16.50 | 83 | 0.76 | -1.87% |
| FLIC | First of Long Island | | Financials | 10.71 | 74 | 0.75 | -19.11% |
| LCNB | LCNB | | Financials | 14.86 | 78 | 0.75 | -5.77% |
| EBTC | Enterprise Bancorp | | Financials | 26.27 | 74 | 0.73 | -18.57% |
| HONE | HarborOne Bancorp | | Financials | 11.02 | 90 | 0.73 | -8.01% |
| FLNG | Flex LNG | | Energy | 29.43 | 95 | 0.72 | 1.27% |
| MTDR | Matador Resources | | Energy | 62.08 | 0 | 0.70 | 9.18% |
| PDLB | PDL Community | | Financials | 8.78 | 70 | 0.69 | -10.04% |
| FMBH | First Mid | | Financials | 33.22 | 90 | 0.67 | -4.15% |
| CURV | Torrid | | Services & Goods | 6.00 | 90 | 0.67 | 2.56% |
| BLX | Banco Latinoamericano | | Financials | 30.70 | 83 | 0.66 | 24.09% |
| GNK | Genco Shipping | | Transports | 23.18 | 95 | 0.65 | 39.72% |
| NOG | Northern Oil | | Energy | 40.01 | 61 | 0.65 | 7.93% |
| RYI | Ryerson Holding | | Industrials | 9.45 | 39 | 0.64 | -33.82% |
| AXL | American Axle | | Consumer Staples | 7.95 | 95 | 0.63 | -9.76% |
| WOW | WideOpenWest | | Technology | 4.83 | 83 | 0.63 | 19.26% |
| PUMP | ProPetro Holding | | Energy | 9.68 | 69 | 0.62 | 15.51% |
| For chart view version of above stock list: Chart View ➞ 0 - 25 , 25 - 50 , 50 - 75 , 75 - 100 , 100 - 125 , 125 - 150 , 150 - 175 , 175 - 200 , 200 - 225 , 225 - 250 , 250 - 275 , 275 - 300 , 300 - 325 , 325 - 350 , 350 - 375 , 375 - 400 , 400 - 425 , 425 - 450 , 450 - 475 , 475 - 500 , 500 - 525 | ||
 | Click To Change The Sort Order: By Market Cap or Company Size Performance: Year-to-date, Week and Day |  |
| Too many stocks? View smallcap stocks filtered by marketcap & sector |
| Marketcap: All SmallCap Stocks (default-no microcap), Large, Mid-Range, Small |
| Smallcap Sector: Tech, Finance, Energy, Staples, Retail, Industrial, Materials, & Medical |
|
Get the most comprehensive stock market coverage daily at 12Stocks.com ➞ Best Stocks Today ➞ Best Stocks Weekly ➞ Best Stocks Year-to-Date ➞ Best Stocks Trends ➞  Best Stocks Today 12Stocks.com Best Nasdaq Stocks ➞ Best S&P 500 Stocks ➞ Best Tech Stocks ➞ Best Biotech Stocks ➞ |
| Detailed Overview of SmallCap Stocks |
| SmallCap Technical Overview, Leaders & Laggards, Top SmallCap ETF Funds & Detailed SmallCap Stocks List, Charts, Trends & More |
| Smallcap: Technical Analysis, Trends & YTD Performance | |
| SmallCap segment as represented by
IWM, an exchange-traded fund [ETF], holds basket of thousands of smallcap stocks from across all major sectors of the US stock market. The smallcap index (contains stocks like Riverbed & Sotheby's) is up by 3.67% and is currently underperforming the overall market by -6.9% year-to-date. Below is a quick view of technical charts and trends: | |
 IWM Weekly Chart |
|
| Long Term Trend: Very Good | |
| Medium Term Trend: Very Good | |
 IWM Daily Chart |
|
| Short Term Trend: Good | |
| Overall Trend Score: 76 | |
| YTD Performance: 3.67% | |
| **Trend Scores & Views Are Only For Educational Purposes And Not For Investing | |
| 12Stocks.com: Top Performing Small Cap Index Stocks | ||||||||||||||||||||||||||||||||||||||||||||||||
 The top performing Small Cap Index stocks year to date are
Now, more recently, over last week, the top performing Small Cap Index stocks on the move are


|
||||||||||||||||||||||||||||||||||||||||||||||||
| 12Stocks.com: Investing in Smallcap Index using Exchange Traded Funds | |
|
The following table shows list of key exchange traded funds (ETF) that
help investors track Smallcap index. The following list also includes leveraged ETF funds that track twice or thrice the daily returns of Smallcap indices. Short or inverse ETF funds move in the opposite direction to the index they track and are useful during market pullbacks or during bear markets. Quick View: Move mouse or cursor over ETF symbol (ticker) to view short-term technical chart and over ETF name to view long term chart. Click on ticker or stock name for detailed view. Click on to add stock symbol to your watchlist and to view watchlist. |
12Stocks.com List of ETFs that track Smallcap Index
| Ticker | ETF Name | Watchlist | Recent Price | Smart Investing & Trading Score | Change % | Week % | Year-to-date % |
| IWM | iShares Russell 2000 | | 208.08 | 76 | 0.07 | 1.85 | 3.67% |
| VTWO | Vanguard Russell 2000 ETF | | 84.11 | 71 | 0.00 | 1.8 | 3.71% |
| IJR | iShares Core S&P Small-Cap | | 110.39 | 68 | -0.22 | 1.29 | 1.98% |
| IWN | iShares Russell 2000 Value | | 158.71 | 76 | -0.07 | 1.61 | 2.18% |
| IWO | iShares Russell 2000 Growth | | 265.15 | 63 | -0.75 | 2.01 | 5.13% |
| IJS | iShares S&P Small-Cap 600 Value | | 101.87 | 76 | -0.15 | 1.34 | -1.16% |
| IJT | iShares S&P Small-Cap 600 Growth | | 131.34 | 71 | 0.04 | 1.14 | 4.95% |
| XSLV | PowerShares S&P SmallCap Low Volatil ETF | | 44.48 | 83 | -0.01 | 0.55 | 0.74% |
| SAA | ProShares Ultra SmallCap600 | | 24.90 | 71 | 0.50 | 2.28 | -0.18% |
| SMLV | SPDR SSGA US Small Cap Low Volatil ETF | | 113.28 | 95 | 0.43 | 1.85 | 0.68% |
| SDD | ProShares UltraShort SmallCap600 | | 17.84 | 35 | 0.96 | -2.41 | -3.19% |
| SBB | ProShares Short SmallCap600 | | 15.77 | 25 | 0.41 | -1.14 | -0.98% |
| 12Stocks.com: Charts, Trends, Fundamental Data and Performances of SmallCap Stocks | |
|
We now take in-depth look at all SmallCap stocks including charts, multi-period performances and overall trends (as measured by Smart Investing & Trading Score). One can sort SmallCap stocks (click link to choose) by Daily, Weekly and by Year-to-Date performances. Also, one can sort by size of the company or by market capitalization. |
| Select Your Default Chart Type: | |||||
| |||||
| Click on stock symbol or name for detailed view. Click on to add stock symbol to your watchlist and to view watchlist. Quick View: Move mouse or cursor over "Daily" to quickly view daily technical stock chart and over "Weekly" to view weekly technical stock chart. | |||||

 | OII Oceaneering International, Inc. |
| Sector: Energy | |
| SubSector: Oil & Gas Equipment & Services | |
| MarketCap: 324.061 Millions | |
| Recent Price: 23.72 Smart Investing & Trading Score: 68 | |
| Day Percent Change: 0.81% Day Change: 0.19 | |
| Week Change: 1.98% Year-to-date Change: 11.5% | |
| OII Links: Profile News Message Board | |
| Charts:- Daily , Weekly | |
| Add OII to Watchlist: View: Get Complete OII Trend Analysis ➞ | |
 | OSBC Old Second Bancorp, Inc. |
| Sector: Financials | |
| SubSector: Regional - Midwest Banks | |
| MarketCap: 237.17 Millions | |
| Recent Price: 14.92 Smart Investing & Trading Score: 100 | |
| Day Percent Change: 0.81% Day Change: 0.12 | |
| Week Change: 2.4% Year-to-date Change: -3.4% | |
| OSBC Links: Profile News Message Board | |
| Charts:- Daily , Weekly | |
| Add OSBC to Watchlist: View: Get Complete OSBC Trend Analysis ➞ | |
 | SMBC Southern Missouri Bancorp, Inc. |
| Sector: Financials | |
| SubSector: Savings & Loans | |
| MarketCap: 272.53 Millions | |
| Recent Price: 43.60 Smart Investing & Trading Score: 100 | |
| Day Percent Change: 0.81% Day Change: 0.35 | |
| Week Change: 3.56% Year-to-date Change: -18.3% | |
| SMBC Links: Profile News Message Board | |
| Charts:- Daily , Weekly | |
| Add SMBC to Watchlist: View: Get Complete SMBC Trend Analysis ➞ | |
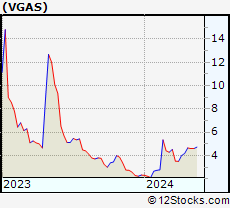 | VGAS Verde Clean Fuels, Inc. |
| Sector: Utilities | |
| SubSector: Utilities - Renewable | |
| MarketCap: 204 Millions | |
| Recent Price: 4.96 Smart Investing & Trading Score: 95 | |
| Day Percent Change: 0.81% Day Change: 0.04 | |
| Week Change: 8.06% Year-to-date Change: 112.9% | |
| VGAS Links: Profile News Message Board | |
| Charts:- Daily , Weekly | |
| Add VGAS to Watchlist: View: Get Complete VGAS Trend Analysis ➞ | |
 | TRC Tejon Ranch Co. |
| Sector: Financials | |
| SubSector: Property Management | |
| MarketCap: 346.442 Millions | |
| Recent Price: 17.98 Smart Investing & Trading Score: 100 | |
| Day Percent Change: 0.78% Day Change: 0.14 | |
| Week Change: 10.58% Year-to-date Change: 4.5% | |
| TRC Links: Profile News Message Board | |
| Charts:- Daily , Weekly | |
| Add TRC to Watchlist: View: Get Complete TRC Trend Analysis ➞ | |
 | VRA Vera Bradley, Inc. |
| Sector: Consumer Staples | |
| SubSector: Textile - Apparel Footwear & Accessories | |
| MarketCap: 151.17 Millions | |
| Recent Price: 7.82 Smart Investing & Trading Score: 72 | |
| Day Percent Change: 0.77% Day Change: 0.06 | |
| Week Change: 4.55% Year-to-date Change: 1.6% | |
| VRA Links: Profile News Message Board | |
| Charts:- Daily , Weekly | |
| Add VRA to Watchlist: View: Get Complete VRA Trend Analysis ➞ | |
 | REFI Chicago Atlantic Financials Finance, Inc. |
| Sector: Financials | |
| SubSector: REIT - Mortgage | |
| MarketCap: 285 Millions | |
| Recent Price: 15.71 Smart Investing & Trading Score: 25 | |
| Day Percent Change: 0.77% Day Change: 0.12 | |
| Week Change: -0.13% Year-to-date Change: -3.0% | |
| REFI Links: Profile News Message Board | |
| Charts:- Daily , Weekly | |
| Add REFI to Watchlist: View: Get Complete REFI Trend Analysis ➞ | |
 | TK Teekay Corporation |
| Sector: Transports | |
| SubSector: Shipping | |
| MarketCap: 257.914 Millions | |
| Recent Price: 9.23 Smart Investing & Trading Score: 95 | |
| Day Percent Change: 0.76% Day Change: 0.07 | |
| Week Change: 5.01% Year-to-date Change: 29.1% | |
| TK Links: Profile News Message Board | |
| Charts:- Daily , Weekly | |
| Add TK to Watchlist: View: Get Complete TK Trend Analysis ➞ | |
 | CPRX Catalyst Pharmaceuticals, Inc. |
| Sector: Health Care | |
| SubSector: Biotechnology | |
| MarketCap: 365.185 Millions | |
| Recent Price: 16.50 Smart Investing & Trading Score: 83 | |
| Day Percent Change: 0.76% Day Change: 0.13 | |
| Week Change: 3.48% Year-to-date Change: -1.9% | |
| CPRX Links: Profile News Message Board | |
| Charts:- Daily , Weekly | |
| Add CPRX to Watchlist: View: Get Complete CPRX Trend Analysis ➞ | |
 | FLIC The First of Long Island Corporation |
| Sector: Financials | |
| SubSector: Regional - Northeast Banks | |
| MarketCap: 352.899 Millions | |
| Recent Price: 10.71 Smart Investing & Trading Score: 74 | |
| Day Percent Change: 0.75% Day Change: 0.08 | |
| Week Change: 2.19% Year-to-date Change: -19.1% | |
| FLIC Links: Profile News Message Board | |
| Charts:- Daily , Weekly | |
| Add FLIC to Watchlist: View: Get Complete FLIC Trend Analysis ➞ | |
 | LCNB LCNB Corp. |
| Sector: Financials | |
| SubSector: Regional - Mid-Atlantic Banks | |
| MarketCap: 176.759 Millions | |
| Recent Price: 14.86 Smart Investing & Trading Score: 78 | |
| Day Percent Change: 0.75% Day Change: 0.11 | |
| Week Change: 1.43% Year-to-date Change: -5.8% | |
| LCNB Links: Profile News Message Board | |
| Charts:- Daily , Weekly | |
| Add LCNB to Watchlist: View: Get Complete LCNB Trend Analysis ➞ | |
 | EBTC Enterprise Bancorp, Inc. |
| Sector: Financials | |
| SubSector: Savings & Loans | |
| MarketCap: 304.53 Millions | |
| Recent Price: 26.27 Smart Investing & Trading Score: 74 | |
| Day Percent Change: 0.73% Day Change: 0.19 | |
| Week Change: 3.75% Year-to-date Change: -18.6% | |
| EBTC Links: Profile News Message Board | |
| Charts:- Daily , Weekly | |
| Add EBTC to Watchlist: View: Get Complete EBTC Trend Analysis ➞ | |
 | HONE HarborOne Bancorp, Inc. |
| Sector: Financials | |
| SubSector: Savings & Loans | |
| MarketCap: 456.03 Millions | |
| Recent Price: 11.02 Smart Investing & Trading Score: 90 | |
| Day Percent Change: 0.73% Day Change: 0.08 | |
| Week Change: 1.57% Year-to-date Change: -8.0% | |
| HONE Links: Profile News Message Board | |
| Charts:- Daily , Weekly | |
| Add HONE to Watchlist: View: Get Complete HONE Trend Analysis ➞ | |
 | FLNG Flex LNG Ltd. |
| Sector: Energy | |
| SubSector: Oil & Gas Equipment & Services | |
| MarketCap: 220.261 Millions | |
| Recent Price: 29.43 Smart Investing & Trading Score: 95 | |
| Day Percent Change: 0.72% Day Change: 0.21 | |
| Week Change: 3.15% Year-to-date Change: 1.3% | |
| FLNG Links: Profile News Message Board | |
| Charts:- Daily , Weekly | |
| Add FLNG to Watchlist: View: Get Complete FLNG Trend Analysis ➞ | |
 | MTDR Matador Resources Company |
| Sector: Energy | |
| SubSector: Independent Oil & Gas | |
| MarketCap: 196.593 Millions | |
| Recent Price: 62.08 Smart Investing & Trading Score: 0 | |
| Day Percent Change: 0.70% Day Change: 0.43 | |
| Week Change: -2.95% Year-to-date Change: 9.2% | |
| MTDR Links: Profile News Message Board | |
| Charts:- Daily , Weekly | |
| Add MTDR to Watchlist: View: Get Complete MTDR Trend Analysis ➞ | |
 | PDLB PDL Community Bancorp |
| Sector: Financials | |
| SubSector: REIT - Retail | |
| MarketCap: 206.114 Millions | |
| Recent Price: 8.78 Smart Investing & Trading Score: 70 | |
| Day Percent Change: 0.69% Day Change: 0.06 | |
| Week Change: 1.86% Year-to-date Change: -10.0% | |
| PDLB Links: Profile News Message Board | |
| Charts:- Daily , Weekly | |
| Add PDLB to Watchlist: View: Get Complete PDLB Trend Analysis ➞ | |
 | FMBH First Mid Bancshares, Inc. |
| Sector: Financials | |
| SubSector: Regional - Midwest Banks | |
| MarketCap: 373.27 Millions | |
| Recent Price: 33.22 Smart Investing & Trading Score: 90 | |
| Day Percent Change: 0.67% Day Change: 0.22 | |
| Week Change: 1.13% Year-to-date Change: -4.2% | |
| FMBH Links: Profile News Message Board | |
| Charts:- Daily , Weekly | |
| Add FMBH to Watchlist: View: Get Complete FMBH Trend Analysis ➞ | |
 | CURV Torrid Holdings Inc. |
| Sector: Services & Goods | |
| SubSector: Apparel Retail | |
| MarketCap: 278 Millions | |
| Recent Price: 6.00 Smart Investing & Trading Score: 90 | |
| Day Percent Change: 0.67% Day Change: 0.04 | |
| Week Change: 8.7% Year-to-date Change: 2.6% | |
| CURV Links: Profile News Message Board | |
| Charts:- Daily , Weekly | |
| Add CURV to Watchlist: View: Get Complete CURV Trend Analysis ➞ | |
 | BLX Banco Latinoamericano de Comercio Exterior, S.A |
| Sector: Financials | |
| SubSector: Foreign Money Center Banks | |
| MarketCap: 390.471 Millions | |
| Recent Price: 30.70 Smart Investing & Trading Score: 83 | |
| Day Percent Change: 0.66% Day Change: 0.20 | |
| Week Change: 1.09% Year-to-date Change: 24.1% | |
| BLX Links: Profile News Message Board | |
| Charts:- Daily , Weekly | |
| Add BLX to Watchlist: View: Get Complete BLX Trend Analysis ➞ | |
 | GNK Genco Shipping & Trading Limited |
| Sector: Transports | |
| SubSector: Shipping | |
| MarketCap: 251.614 Millions | |
| Recent Price: 23.18 Smart Investing & Trading Score: 95 | |
| Day Percent Change: 0.65% Day Change: 0.15 | |
| Week Change: 1.49% Year-to-date Change: 39.7% | |
| GNK Links: Profile News Message Board | |
| Charts:- Daily , Weekly | |
| Add GNK to Watchlist: View: Get Complete GNK Trend Analysis ➞ | |
 | NOG Northern Oil and Gas, Inc. |
| Sector: Energy | |
| SubSector: Oil & Gas Drilling & Exploration | |
| MarketCap: 301.939 Millions | |
| Recent Price: 40.01 Smart Investing & Trading Score: 61 | |
| Day Percent Change: 0.65% Day Change: 0.26 | |
| Week Change: 0.7% Year-to-date Change: 7.9% | |
| NOG Links: Profile News Message Board | |
| Charts:- Daily , Weekly | |
| Add NOG to Watchlist: View: Get Complete NOG Trend Analysis ➞ | |
 | RYI Ryerson Holding Corporation |
| Sector: Industrials | |
| SubSector: Metal Fabrication | |
| MarketCap: 202.55 Millions | |
| Recent Price: 9.45 Smart Investing & Trading Score: 39 | |
| Day Percent Change: 0.64% Day Change: 0.06 | |
| Week Change: 1.32% Year-to-date Change: -33.8% | |
| RYI Links: Profile News Message Board | |
| Charts:- Daily , Weekly | |
| Add RYI to Watchlist: View: Get Complete RYI Trend Analysis ➞ | |
 | AXL American Axle & Manufacturing Holdings, Inc. |
| Sector: Consumer Staples | |
| SubSector: Auto Parts | |
| MarketCap: 407.139 Millions | |
| Recent Price: 7.95 Smart Investing & Trading Score: 95 | |
| Day Percent Change: 0.63% Day Change: 0.05 | |
| Week Change: 4.33% Year-to-date Change: -9.8% | |
| AXL Links: Profile News Message Board | |
| Charts:- Daily , Weekly | |
| Add AXL to Watchlist: View: Get Complete AXL Trend Analysis ➞ | |
 | WOW WideOpenWest, Inc. |
| Sector: Technology | |
| SubSector: CATV Systems | |
| MarketCap: 328.932 Millions | |
| Recent Price: 4.83 Smart Investing & Trading Score: 83 | |
| Day Percent Change: 0.63% Day Change: 0.03 | |
| Week Change: 3.87% Year-to-date Change: 19.3% | |
| WOW Links: Profile News Message Board | |
| Charts:- Daily , Weekly | |
| Add WOW to Watchlist: View: Get Complete WOW Trend Analysis ➞ | |
 | PUMP ProPetro Holding Corp. |
| Sector: Energy | |
| SubSector: Oil & Gas Equipment & Services | |
| MarketCap: 181.261 Millions | |
| Recent Price: 9.68 Smart Investing & Trading Score: 69 | |
| Day Percent Change: 0.62% Day Change: 0.06 | |
| Week Change: 4.76% Year-to-date Change: 15.5% | |
| PUMP Links: Profile News Message Board | |
| Charts:- Daily , Weekly | |
| Add PUMP to Watchlist: View: Get Complete PUMP Trend Analysis ➞ | |
| For tabular summary view of above stock list: Summary View ➞ 0 - 25 , 25 - 50 , 50 - 75 , 75 - 100 , 100 - 125 , 125 - 150 , 150 - 175 , 175 - 200 , 200 - 225 , 225 - 250 , 250 - 275 , 275 - 300 , 300 - 325 , 325 - 350 , 350 - 375 , 375 - 400 , 400 - 425 , 425 - 450 , 450 - 475 , 475 - 500 , 500 - 525 | ||
| Click To Change The Sort Order: By Market Cap or Company Size Performance: Year-to-date, Week and Day | |
| Select Chart Type: | ||
| Too many stocks? View smallcap stocks filtered by marketcap & sector |
| Marketcap: All SmallCap Stocks (default-no microcap), Large, Mid-Range, Small & MicroCap |
| Sector: Tech, Finance, Energy, Staples, Retail, Industrial, Materials, Utilities & Medical |
|
Best Stocks Today 12Stocks.com |
© 2024 12Stocks.com Terms & Conditions Privacy Contact Us
All Information Provided Only For Education And Not To Be Used For Investing or Trading. See Terms & Conditions


One More Thing ... Get Best Stocks Delivered Daily!
Never Ever Miss A Move With Our Top Ten Stocks Lists
Find Best Stocks In Any Market - Bull or Bear Market
Take A Peek At Our Top Ten Stocks Lists: Daily, Weekly, Year-to-Date & Top Trends
Find Best Stocks In Any Market - Bull or Bear Market
Take A Peek At Our Top Ten Stocks Lists: Daily, Weekly, Year-to-Date & Top Trends
Smallcap Stocks With Best Up Trends [0-bearish to 100-bullish]: CommScope Holding[100], Coeur Mining[100], Hecla Mining[100], MicroStrategy [100], Enovix [100], Rayonier Advanced[100], Nurix [100], Energy Fuels[100], NovaGold Resources[100], Piedmont Lithium[100], Wave Life[100]
Best Smallcap Stocks Year-to-Date:
CareMax [495.88%], Bakkt [413.9%], Janux [338.34%], Viking [260.02%], Alpine Immune[241.23%], Longboard [238.63%], Avidity Biosciences[226.33%], Super Micro[212.35%], Arcutis Bio[184.83%], Sweetgreen [180.97%], Novavax [171.04%] Best Smallcap Stocks This Week:
Vaxxinity [58.82%], Novavax [46.51%], Vicarious Surgical[45.62%], Harrow Health[44.48%], ProKidney [44.31%], Workhorse Group[36.06%], Maxeon Solar[35.94%], Fossil Group[35.44%], Humacyte [34.68%], MicroStrategy [34.23%], Cadiz [33.48%] Best Smallcap Stocks Daily:
Vaxxinity [45.95%], Presto Automation[31.90%], Vicarious Surgical[27.93%], Orchestra BioMed[12.77%], CommScope Holding[11.86%], Coeur Mining[11.57%], Hecla Mining[11.11%], MicroStrategy [10.04%], Tenaya [9.65%], Bakkt [9.25%], Enovix [9.25%]