
 Login Sign Up


| |||||
 |  | ||||

| 12Stocks.com Market Intelligence |
Best SmallCap Stocks
|
| In a hurry? Small Cap Stock Lists: Performance Trends Table, Stock Charts
Sort Small Cap stocks: Daily, Weekly, Year-to-Date, Market Cap & Trends. Filter Small Cap stocks list by sector: Show all, Tech, Finance, Energy, Staples, Retail, Industrial, Materials, Utilities and HealthCare Filter Small Cap stocks list by size: All Large Medium Small and MicroCap |
| 12Stocks.com Small Cap Stocks Performances & Trends Daily | |||||||||
|
|  The overall Smart Investing & Trading Score is 82 (0-bearish to 100-bullish) which puts Small Cap index in short term bullish trend. The Smart Investing & Trading Score from previous trading session is 69 and hence an improvement of trend.
| ||||||||
Here are the Smart Investing & Trading Scores of the most requested small cap stocks at 12Stocks.com (click stock name for detailed review):
|


| 12Stocks.com: Investing in Smallcap Index with Stocks | |
|
The following table helps investors and traders sort through current performance and trends (as measured by Smart Investing & Trading Score) of various
stocks in the Smallcap Index. Quick View: Move mouse or cursor over stock symbol (ticker) to view short-term technical chart and over stock name to view long term chart. Click on  to add stock symbol to your watchlist and to add stock symbol to your watchlist and  to view watchlist. Click on any ticker or stock name for detailed market intelligence report for that stock. to view watchlist. Click on any ticker or stock name for detailed market intelligence report for that stock. |
12Stocks.com Performance of Stocks in Smallcap Index
| Ticker | Stock Name | Watchlist | Category | Recent Price | Smart Investing & Trading Score | Change % | YTD Change% |
| ITIC | Investors Title |   | Financials | 161.66 | 66 | 1.46 | -0.30% |
| APPS | Digital Turbine | | Technology | 2.09 | 55 | 1.46 | -69.53% |
| AKTS | Akoustis | | Technology | 0.61 | 57 | 1.45 | -27.01% |
| MOV | Movado Group | | Consumer Staples | 26.41 | 74 | 1.38 | -12.40% |
| FMAO | Farmers & Merchants Bancorp | | Financials | 22.09 | 100 | 1.38 | -10.93% |
| MITK | Mitek Systems | | Technology | 13.56 | 95 | 1.35 | 3.99% |
| BBAI | BigBear.ai | | Technology | 1.51 | 22 | 1.34 | -28.87% |
| FBMS | First Bancshares | | Financials | 25.10 | 100 | 1.33 | -14.42% |
| PI | Impinj | | Technology | 163.33 | 90 | 1.30 | 81.42% |
| MRSN | Mersana | | Health Care | 3.50 | 64 | 1.30 | 51.08% |
| MGTX | MeiraGTx | | Health Care | 5.07 | 50 | 1.30 | -27.85% |
| ODC | Oil-Dri | | Materials | 77.81 | 95 | 1.29 | 16.00% |
| MTDR | Matador Resources | | Energy | 64.08 | 68 | 1.26 | 12.70% |
| OLP | One Liberty | | Financials | 23.44 | 100 | 1.25 | 6.98% |
| DX | Dynex Capital | | Financials | 12.23 | 87 | 1.24 | -2.32% |
| CCNE | CNB Financial | | Financials | 19.80 | 74 | 1.23 | -12.35% |
| THFF | First Financial | | Financials | 38.11 | 100 | 1.22 | -11.43% |
| SCVL | Shoe Carnival | | Services & Goods | 35.02 | 78 | 1.21 | 15.92% |
| IIIN | Insteel Industries | | Materials | 33.46 | 57 | 1.21 | -12.61% |
| TRNS | Transcat | | Technology | 113.60 | 95 | 1.21 | 3.91% |
| CBNK | Capital Bancorp | | Financials | 20.23 | 64 | 1.20 | -16.40% |
| VAXX | Vaxxinity | | Health Care | 0.13 | 32 | 1.18 | -84.70% |
| TBBK | Bancorp | | Financials | 32.29 | 42 | 1.16 | -16.26% |
| THR | Thermon Group | | Industrials | 33.12 | 90 | 1.16 | 1.69% |
| ENVA | Enova | | Financials | 62.73 | 59 | 1.16 | 13.31% |
| For chart view version of above stock list: Chart View ➞ 0 - 25 , 25 - 50 , 50 - 75 , 75 - 100 , 100 - 125 , 125 - 150 , 150 - 175 , 175 - 200 , 200 - 225 , 225 - 250 , 250 - 275 , 275 - 300 , 300 - 325 , 325 - 350 , 350 - 375 , 375 - 400 , 400 - 425 , 425 - 450 , 450 - 475 , 475 - 500 , 500 - 525 | ||
 | Click To Change The Sort Order: By Market Cap or Company Size Performance: Year-to-date, Week and Day |  |
| Too many stocks? View smallcap stocks filtered by marketcap & sector |
| Marketcap: All SmallCap Stocks (default-no microcap), Large, Mid-Range, Small |
| Smallcap Sector: Tech, Finance, Energy, Staples, Retail, Industrial, Materials, & Medical |
|
Get the most comprehensive stock market coverage daily at 12Stocks.com ➞ Best Stocks Today ➞ Best Stocks Weekly ➞ Best Stocks Year-to-Date ➞ Best Stocks Trends ➞  Best Stocks Today 12Stocks.com Best Nasdaq Stocks ➞ Best S&P 500 Stocks ➞ Best Tech Stocks ➞ Best Biotech Stocks ➞ |
| Detailed Overview of SmallCap Stocks |
| SmallCap Technical Overview, Leaders & Laggards, Top SmallCap ETF Funds & Detailed SmallCap Stocks List, Charts, Trends & More |
| Smallcap: Technical Analysis, Trends & YTD Performance | |
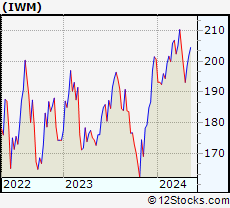
| SmallCap segment as represented by
IWM, an exchange-traded fund [ETF], holds basket of thousands of smallcap stocks from across all major sectors of the US stock market. The smallcap index (contains stocks like Riverbed & Sotheby's) is up by 1.89% and is currently underperforming the overall market by -6.13% year-to-date. Below is a quick view of technical charts and trends: | |
 IWM Weekly Chart |
|
| Long Term Trend: Very Good | |
| Medium Term Trend: Very Good | |
 IWM Daily Chart |
|
| Short Term Trend: Very Good | |
| Overall Trend Score: 82 | |
| YTD Performance: 1.89% | |
| **Trend Scores & Views Are Only For Educational Purposes And Not For Investing | |
| 12Stocks.com: Top Performing Small Cap Index Stocks | ||||||||||||||||||||||||||||||||||||||||||||||||
 The top performing Small Cap Index stocks year to date are
Now, more recently, over last week, the top performing Small Cap Index stocks on the move are


|
||||||||||||||||||||||||||||||||||||||||||||||||
| 12Stocks.com: Investing in Smallcap Index using Exchange Traded Funds | |
|
The following table shows list of key exchange traded funds (ETF) that
help investors track Smallcap index. The following list also includes leveraged ETF funds that track twice or thrice the daily returns of Smallcap indices. Short or inverse ETF funds move in the opposite direction to the index they track and are useful during market pullbacks or during bear markets. Quick View: Move mouse or cursor over ETF symbol (ticker) to view short-term technical chart and over ETF name to view long term chart. Click on ticker or stock name for detailed view. Click on to add stock symbol to your watchlist and to view watchlist. |
12Stocks.com List of ETFs that track Smallcap Index
| Ticker | ETF Name | Watchlist | Recent Price | Smart Investing & Trading Score | Change % | Week % | Year-to-date % |
| IWM | iShares Russell 2000 | | 204.51 | 82 | 1.29 | 1.29 | 1.89% |
| IJR | iShares Core S&P Small-Cap | | 108.26 | 100 | 1.05 | 1.05 | 0.01% |
| VTWO | Vanguard Russell 2000 ETF | | 82.66 | 82 | 1.29 | 1.29 | 1.92% |
| IWN | iShares Russell 2000 Value | | 155.65 | 100 | 0.93 | 0.93 | 0.21% |
| IWO | iShares Russell 2000 Growth | | 261.01 | 69 | 1.61 | 1.61 | 3.49% |
| IJS | iShares S&P Small-Cap 600 Value | | 99.75 | 69 | 1.04 | 1.04 | -3.22% |
| IJT | iShares S&P Small-Cap 600 Growth | | 129.12 | 90 | 1.06 | 1.06 | 3.18% |
| XSLV | PowerShares S&P SmallCap Low Volatil ETF | | 43.58 | 87 | 0.83 | 0.83 | -1.29% |
| SAA | ProShares Ultra SmallCap600 | | 24.11 | 82 | 2.20 | 2.2 | -3.37% |
| SDD | ProShares UltraShort SmallCap600 | | 18.42 | 10 | -2.26 | -2.26 | -0.04% |
| SBB | ProShares Short SmallCap600 | | 16.05 | 13 | -0.67 | -0.67 | 0.76% |
| SMLV | SPDR SSGA US Small Cap Low Volatil ETF | | 110.59 | 100 | 0.83 | 0.83 | -1.72% |
| 12Stocks.com: Charts, Trends, Fundamental Data and Performances of SmallCap Stocks | |
|
We now take in-depth look at all SmallCap stocks including charts, multi-period performances and overall trends (as measured by Smart Investing & Trading Score). One can sort SmallCap stocks (click link to choose) by Daily, Weekly and by Year-to-Date performances. Also, one can sort by size of the company or by market capitalization. |
| Select Your Default Chart Type: | |||||
| |||||
| Click on stock symbol or name for detailed view. Click on to add stock symbol to your watchlist and to view watchlist. Quick View: Move mouse or cursor over "Daily" to quickly view daily technical stock chart and over "Weekly" to view weekly technical stock chart. | |||||

 | ITIC Investors Title Company |
| Sector: Financials | |
| SubSector: Surety & Title Insurance | |
| MarketCap: 219.518 Millions | |
| Recent Price: 161.66 Smart Investing & Trading Score: 66 | |
| Day Percent Change: 1.46% Day Change: 2.32 | |
| Week Change: 1.46% Year-to-date Change: -0.3% | |
| ITIC Links: Profile News Message Board | |
| Charts:- Daily , Weekly | |
| Add ITIC to Watchlist: View: Get Complete ITIC Trend Analysis ➞ | |
 | APPS Digital Turbine, Inc. |
| Sector: Technology | |
| SubSector: Application Software | |
| MarketCap: 437.262 Millions | |
| Recent Price: 2.09 Smart Investing & Trading Score: 55 | |
| Day Percent Change: 1.46% Day Change: 0.03 | |
| Week Change: 1.46% Year-to-date Change: -69.5% | |
| APPS Links: Profile News Message Board | |
| Charts:- Daily , Weekly | |
| Add APPS to Watchlist: View: Get Complete APPS Trend Analysis ➞ | |
 | AKTS Akoustis Technologies, Inc. |
| Sector: Technology | |
| SubSector: Communication Equipment | |
| MarketCap: 197.039 Millions | |
| Recent Price: 0.61 Smart Investing & Trading Score: 57 | |
| Day Percent Change: 1.45% Day Change: 0.01 | |
| Week Change: 1.45% Year-to-date Change: -27.0% | |
| AKTS Links: Profile News Message Board | |
| Charts:- Daily , Weekly | |
| Add AKTS to Watchlist: View: Get Complete AKTS Trend Analysis ➞ | |
 | MOV Movado Group, Inc. |
| Sector: Consumer Staples | |
| SubSector: Recreational Goods, Other | |
| MarketCap: 161.659 Millions | |
| Recent Price: 26.41 Smart Investing & Trading Score: 74 | |
| Day Percent Change: 1.38% Day Change: 0.36 | |
| Week Change: 1.38% Year-to-date Change: -12.4% | |
| MOV Links: Profile News Message Board | |
| Charts:- Daily , Weekly | |
| Add MOV to Watchlist: View: Get Complete MOV Trend Analysis ➞ | |
 | FMAO Farmers & Merchants Bancorp, Inc. |
| Sector: Financials | |
| SubSector: Regional - Midwest Banks | |
| MarketCap: 280.27 Millions | |
| Recent Price: 22.09 Smart Investing & Trading Score: 100 | |
| Day Percent Change: 1.38% Day Change: 0.30 | |
| Week Change: 1.38% Year-to-date Change: -10.9% | |
| FMAO Links: Profile News Message Board | |
| Charts:- Daily , Weekly | |
| Add FMAO to Watchlist: View: Get Complete FMAO Trend Analysis ➞ | |
 | MITK Mitek Systems, Inc. |
| Sector: Technology | |
| SubSector: Application Software | |
| MarketCap: 265.962 Millions | |
| Recent Price: 13.56 Smart Investing & Trading Score: 95 | |
| Day Percent Change: 1.35% Day Change: 0.18 | |
| Week Change: 1.35% Year-to-date Change: 4.0% | |
| MITK Links: Profile News Message Board | |
| Charts:- Daily , Weekly | |
| Add MITK to Watchlist: View: Get Complete MITK Trend Analysis ➞ | |
 | BBAI BigBear.ai Holdings, Inc. |
| Sector: Technology | |
| SubSector: Information Technology Services | |
| MarketCap: 339 Millions | |
| Recent Price: 1.51 Smart Investing & Trading Score: 22 | |
| Day Percent Change: 1.34% Day Change: 0.02 | |
| Week Change: 1.34% Year-to-date Change: -28.9% | |
| BBAI Links: Profile News Message Board | |
| Charts:- Daily , Weekly | |
| Add BBAI to Watchlist: View: Get Complete BBAI Trend Analysis ➞ | |
 | FBMS The First Bancshares, Inc. |
| Sector: Financials | |
| SubSector: Regional - Southeast Banks | |
| MarketCap: 359.535 Millions | |
| Recent Price: 25.10 Smart Investing & Trading Score: 100 | |
| Day Percent Change: 1.33% Day Change: 0.33 | |
| Week Change: 1.33% Year-to-date Change: -14.4% | |
| FBMS Links: Profile News Message Board | |
| Charts:- Daily , Weekly | |
| Add FBMS to Watchlist: View: Get Complete FBMS Trend Analysis ➞ | |
 | PI Impinj, Inc. |
| Sector: Technology | |
| SubSector: Communication Equipment | |
| MarketCap: 364.739 Millions | |
| Recent Price: 163.33 Smart Investing & Trading Score: 90 | |
| Day Percent Change: 1.30% Day Change: 2.10 | |
| Week Change: 1.3% Year-to-date Change: 81.4% | |
| PI Links: Profile News Message Board | |
| Charts:- Daily , Weekly | |
| Add PI to Watchlist: View: Get Complete PI Trend Analysis ➞ | |
 | MRSN Mersana Therapeutics, Inc. |
| Sector: Health Care | |
| SubSector: Biotechnology | |
| MarketCap: 224.385 Millions | |
| Recent Price: 3.50 Smart Investing & Trading Score: 64 | |
| Day Percent Change: 1.30% Day Change: 0.04 | |
| Week Change: 1.3% Year-to-date Change: 51.1% | |
| MRSN Links: Profile News Message Board | |
| Charts:- Daily , Weekly | |
| Add MRSN to Watchlist: View: Get Complete MRSN Trend Analysis ➞ | |
 | MGTX MeiraGTx Holdings plc |
| Sector: Health Care | |
| SubSector: Biotechnology | |
| MarketCap: 402.885 Millions | |
| Recent Price: 5.07 Smart Investing & Trading Score: 50 | |
| Day Percent Change: 1.30% Day Change: 0.07 | |
| Week Change: 1.3% Year-to-date Change: -27.9% | |
| MGTX Links: Profile News Message Board | |
| Charts:- Daily , Weekly | |
| Add MGTX to Watchlist: View: Get Complete MGTX Trend Analysis ➞ | |
 | ODC Oil-Dri Corporation of America |
| Sector: Materials | |
| SubSector: Specialty Chemicals | |
| MarketCap: 249.857 Millions | |
| Recent Price: 77.81 Smart Investing & Trading Score: 95 | |
| Day Percent Change: 1.29% Day Change: 0.99 | |
| Week Change: 1.29% Year-to-date Change: 16.0% | |
| ODC Links: Profile News Message Board | |
| Charts:- Daily , Weekly | |
| Add ODC to Watchlist: View: Get Complete ODC Trend Analysis ➞ | |
 | MTDR Matador Resources Company |
| Sector: Energy | |
| SubSector: Independent Oil & Gas | |
| MarketCap: 196.593 Millions | |
| Recent Price: 64.08 Smart Investing & Trading Score: 68 | |
| Day Percent Change: 1.26% Day Change: 0.80 | |
| Week Change: 1.26% Year-to-date Change: 12.7% | |
| MTDR Links: Profile News Message Board | |
| Charts:- Daily , Weekly | |
| Add MTDR to Watchlist: View: Get Complete MTDR Trend Analysis ➞ | |
 | OLP One Liberty Properties, Inc. |
| Sector: Financials | |
| SubSector: REIT - Diversified | |
| MarketCap: 378.353 Millions | |
| Recent Price: 23.44 Smart Investing & Trading Score: 100 | |
| Day Percent Change: 1.25% Day Change: 0.29 | |
| Week Change: 1.25% Year-to-date Change: 7.0% | |
| OLP Links: Profile News Message Board | |
| Charts:- Daily , Weekly | |
| Add OLP to Watchlist: View: Get Complete OLP Trend Analysis ➞ | |
 | DX Dynex Capital, Inc. |
| Sector: Financials | |
| SubSector: Mortgage Investment | |
| MarketCap: 327.839 Millions | |
| Recent Price: 12.23 Smart Investing & Trading Score: 87 | |
| Day Percent Change: 1.24% Day Change: 0.15 | |
| Week Change: 1.24% Year-to-date Change: -2.3% | |
| DX Links: Profile News Message Board | |
| Charts:- Daily , Weekly | |
| Add DX to Watchlist: View: Get Complete DX Trend Analysis ➞ | |
 | CCNE CNB Financial Corporation |
| Sector: Financials | |
| SubSector: Regional - Northeast Banks | |
| MarketCap: 286.599 Millions | |
| Recent Price: 19.80 Smart Investing & Trading Score: 74 | |
| Day Percent Change: 1.23% Day Change: 0.24 | |
| Week Change: 1.23% Year-to-date Change: -12.4% | |
| CCNE Links: Profile News Message Board | |
| Charts:- Daily , Weekly | |
| Add CCNE to Watchlist: View: Get Complete CCNE Trend Analysis ➞ | |
 | THFF First Financial Corporation |
| Sector: Financials | |
| SubSector: Regional - Midwest Banks | |
| MarketCap: 433.07 Millions | |
| Recent Price: 38.11 Smart Investing & Trading Score: 100 | |
| Day Percent Change: 1.22% Day Change: 0.46 | |
| Week Change: 1.22% Year-to-date Change: -11.4% | |
| THFF Links: Profile News Message Board | |
| Charts:- Daily , Weekly | |
| Add THFF to Watchlist: View: Get Complete THFF Trend Analysis ➞ | |
 | SCVL Shoe Carnival, Inc. |
| Sector: Services & Goods | |
| SubSector: Apparel Stores | |
| MarketCap: 252.508 Millions | |
| Recent Price: 35.02 Smart Investing & Trading Score: 78 | |
| Day Percent Change: 1.21% Day Change: 0.42 | |
| Week Change: 1.21% Year-to-date Change: 15.9% | |
| SCVL Links: Profile News Message Board | |
| Charts:- Daily , Weekly | |
| Add SCVL to Watchlist: View: Get Complete SCVL Trend Analysis ➞ | |
 | IIIN Insteel Industries, Inc. |
| Sector: Materials | |
| SubSector: Steel & Iron | |
| MarketCap: 269.488 Millions | |
| Recent Price: 33.46 Smart Investing & Trading Score: 57 | |
| Day Percent Change: 1.21% Day Change: 0.40 | |
| Week Change: 1.21% Year-to-date Change: -12.6% | |
| IIIN Links: Profile News Message Board | |
| Charts:- Daily , Weekly | |
| Add IIIN to Watchlist: View: Get Complete IIIN Trend Analysis ➞ | |
 | TRNS Transcat, Inc. |
| Sector: Technology | |
| SubSector: Scientific & Technical Instruments | |
| MarketCap: 216.653 Millions | |
| Recent Price: 113.60 Smart Investing & Trading Score: 95 | |
| Day Percent Change: 1.21% Day Change: 1.36 | |
| Week Change: 1.21% Year-to-date Change: 3.9% | |
| TRNS Links: Profile News Message Board | |
| Charts:- Daily , Weekly | |
| Add TRNS to Watchlist: View: Get Complete TRNS Trend Analysis ➞ | |
 | CBNK Capital Bancorp, Inc. |
| Sector: Financials | |
| SubSector: Savings & Loans | |
| MarketCap: 174.93 Millions | |
| Recent Price: 20.23 Smart Investing & Trading Score: 64 | |
| Day Percent Change: 1.20% Day Change: 0.24 | |
| Week Change: 1.2% Year-to-date Change: -16.4% | |
| CBNK Links: Profile News Message Board | |
| Charts:- Daily , Weekly | |
| Add CBNK to Watchlist: View: Get Complete CBNK Trend Analysis ➞ | |
 | VAXX Vaxxinity, Inc. |
| Sector: Health Care | |
| SubSector: Biotechnology | |
| MarketCap: 320 Millions | |
| Recent Price: 0.13 Smart Investing & Trading Score: 32 | |
| Day Percent Change: 1.18% Day Change: 0.00 | |
| Week Change: 1.18% Year-to-date Change: -84.7% | |
| VAXX Links: Profile News Message Board | |
| Charts:- Daily , Weekly | |
| Add VAXX to Watchlist: View: Get Complete VAXX Trend Analysis ➞ | |
 | TBBK The Bancorp, Inc. |
| Sector: Financials | |
| SubSector: Regional - Mid-Atlantic Banks | |
| MarketCap: 267.859 Millions | |
| Recent Price: 32.29 Smart Investing & Trading Score: 42 | |
| Day Percent Change: 1.16% Day Change: 0.37 | |
| Week Change: 1.16% Year-to-date Change: -16.3% | |
| TBBK Links: Profile News Message Board | |
| Charts:- Daily , Weekly | |
| Add TBBK to Watchlist: View: Get Complete TBBK Trend Analysis ➞ | |
 | THR Thermon Group Holdings, Inc. |
| Sector: Industrials | |
| SubSector: Diversified Machinery | |
| MarketCap: 492.816 Millions | |
| Recent Price: 33.12 Smart Investing & Trading Score: 90 | |
| Day Percent Change: 1.16% Day Change: 0.38 | |
| Week Change: 1.16% Year-to-date Change: 1.7% | |
| THR Links: Profile News Message Board | |
| Charts:- Daily , Weekly | |
| Add THR to Watchlist: View: Get Complete THR Trend Analysis ➞ | |
 | ENVA Enova International, Inc. |
| Sector: Financials | |
| SubSector: Credit Services | |
| MarketCap: 345.508 Millions | |
| Recent Price: 62.73 Smart Investing & Trading Score: 59 | |
| Day Percent Change: 1.16% Day Change: 0.72 | |
| Week Change: 1.16% Year-to-date Change: 13.3% | |
| ENVA Links: Profile News Message Board | |
| Charts:- Daily , Weekly | |
| Add ENVA to Watchlist: View: Get Complete ENVA Trend Analysis ➞ | |
| For tabular summary view of above stock list: Summary View ➞ 0 - 25 , 25 - 50 , 50 - 75 , 75 - 100 , 100 - 125 , 125 - 150 , 150 - 175 , 175 - 200 , 200 - 225 , 225 - 250 , 250 - 275 , 275 - 300 , 300 - 325 , 325 - 350 , 350 - 375 , 375 - 400 , 400 - 425 , 425 - 450 , 450 - 475 , 475 - 500 , 500 - 525 | ||
| Click To Change The Sort Order: By Market Cap or Company Size Performance: Year-to-date, Week and Day | |
| Select Chart Type: | ||
| Too many stocks? View smallcap stocks filtered by marketcap & sector |
| Marketcap: All SmallCap Stocks (default-no microcap), Large, Mid-Range, Small & MicroCap |
| Sector: Tech, Finance, Energy, Staples, Retail, Industrial, Materials, Utilities & Medical |
|
Best Stocks Today 12Stocks.com |
© 2024 12Stocks.com Terms & Conditions Privacy Contact Us
All Information Provided Only For Education And Not To Be Used For Investing or Trading. See Terms & Conditions


One More Thing ... Get Best Stocks Delivered Daily!
Never Ever Miss A Move With Our Top Ten Stocks Lists
Find Best Stocks In Any Market - Bull or Bear Market
Take A Peek At Our Top Ten Stocks Lists: Daily, Weekly, Year-to-Date & Top Trends
Find Best Stocks In Any Market - Bull or Bear Market
Take A Peek At Our Top Ten Stocks Lists: Daily, Weekly, Year-to-Date & Top Trends
Smallcap Stocks With Best Up Trends [0-bearish to 100-bullish]: Perficient [100], Outset Medical[100], Lineage Cell[100], Assertio [100], Dakota Gold[100], Loln Educational[100], Twist Bioscience[100], PMV [100], SilverBow Resources[100], Phathom [100], Alexander s[100]
Best Smallcap Stocks Year-to-Date:
CareMax [511.34%], Janux [479.25%], Viking [320.26%], Alpine Immune[239.29%], Longboard [237.32%], Bakkt [197.53%], Vera [194.15%], Super Micro[192.11%], Avidity Biosciences[189.6%], Cullinan Oncology[178.76%], Y-mAbs [152.79%] Best Smallcap Stocks This Week:
Perficient [52.28%], P3 Health[25.16%], Outset Medical[23%], Lineage Cell[22.64%], Workhorse Group[20.5%], SoundHound AI[19.54%], DASAN Zhone[19.25%], BioCryst [18.43%], Marathon Patent[17.98%], Assertio [16.99%], Aceto [16.55%] Best Smallcap Stocks Daily:
Perficient [52.28%], P3 Health[25.16%], Outset Medical[23.00%], Lineage Cell[22.64%], Workhorse Group[20.50%], SoundHound AI[19.54%], DASAN Zhone[19.25%], BioCryst [18.43%], Marathon Patent[17.98%], Assertio [16.99%], Aceto [16.55%]