
 Login Sign Up


| |||||
 |  | ||||

| 12Stocks.com Market Intelligence |
Best SmallCap Stocks
|
| In a hurry? Small Cap Stock Lists: Performance Trends Table, Stock Charts
Sort Small Cap stocks: Daily, Weekly, Year-to-Date, Market Cap & Trends. Filter Small Cap stocks list by sector: Show all, Tech, Finance, Energy, Staples, Retail, Industrial, Materials, Utilities and HealthCare Filter Small Cap stocks list by size: All Large Medium Small and MicroCap |
| 12Stocks.com Small Cap Stocks Performances & Trends Daily | |||||||||
|
|  The overall Smart Investing & Trading Score is 87 (0-bearish to 100-bullish) which puts Small Cap index in short term bullish trend. The Smart Investing & Trading Score from previous trading session is 82 and hence an improvement of trend.
| ||||||||
Here are the Smart Investing & Trading Scores of the most requested small cap stocks at 12Stocks.com (click stock name for detailed review):
|


| 12Stocks.com: Investing in Smallcap Index with Stocks | |
|
The following table helps investors and traders sort through current performance and trends (as measured by Smart Investing & Trading Score) of various
stocks in the Smallcap Index. Quick View: Move mouse or cursor over stock symbol (ticker) to view short-term technical chart and over stock name to view long term chart. Click on  to add stock symbol to your watchlist and to add stock symbol to your watchlist and  to view watchlist. Click on any ticker or stock name for detailed market intelligence report for that stock. to view watchlist. Click on any ticker or stock name for detailed market intelligence report for that stock. |
12Stocks.com Performance of Stocks in Smallcap Index
| Ticker | Stock Name | Watchlist | Category | Recent Price | Smart Investing & Trading Score | Change % | YTD Change% |
| WVE | Wave Life |   | Health Care | 5.79 | 68 | 0.61 | 14.55% |
| III | Information Services | | Technology | 3.38 | 27 | 0.60 | -28.24% |
| LMNR | Limoneira | | Consumer Staples | 21.13 | 68 | 0.60 | 2.40% |
| MRC | MRC Global | | Energy | 11.66 | 78 | 0.60 | 5.90% |
| RPHM | Reneo | | Health Care | 1.75 | 78 | 0.58 | 7.72% |
| SABR | Sabre | | Technology | 2.67 | 32 | 0.57 | -39.43% |
| HONE | HarborOne Bancorp | | Financials | 10.58 | 88 | 0.57 | -11.69% |
| MRSN | Mersana | | Health Care | 3.52 | 69 | 0.57 | 51.94% |
| VOR | Vor Biopharma | | Health Care | 1.77 | 25 | 0.57 | -20.27% |
| EXTR | Extreme s | | Technology | 11.02 | 35 | 0.55 | -37.53% |
| IMMR | Immersion | | Technology | 7.37 | 100 | 0.55 | 4.39% |
| SITM | SiTime | | Technology | 97.17 | 95 | 0.55 | -20.40% |
| NVEC | NVE | | Technology | 77.01 | 17 | 0.54 | -1.81% |
| BSRR | Sierra Bancorp | | Financials | 21.43 | 95 | 0.52 | -4.97% |
| VSEC | VSE | | Services & Goods | 84.86 | 100 | 0.52 | 31.34% |
| MCRI | Monarch Casino | | Services & Goods | 68.93 | 64 | 0.48 | -0.32% |
| SIGA | SIGA | | Health Care | 10.44 | 95 | 0.48 | 86.43% |
| PTEN | Patterson-UTI Energy | | Energy | 11.02 | 42 | 0.46 | 2.04% |
| MBWM | Mercantile Bank | | Financials | 39.56 | 100 | 0.46 | -2.03% |
| HOFT | Hooker Furniture | | Consumer Staples | 17.70 | 49 | 0.45 | -32.13% |
| TBBK | Bancorp | | Financials | 32.43 | 49 | 0.43 | -15.90% |
| DXPE | DXP Enterprises | | Services & Goods | 53.59 | 90 | 0.43 | 59.02% |
| TK | Teekay | | Transports | 7.67 | 63 | 0.39 | 7.27% |
| EGAN | eGain | | Technology | 6.38 | 68 | 0.39 | -23.35% |
| RLGT | Radiant Logistics | | Transports | 5.12 | 49 | 0.39 | -22.89% |
| For chart view version of above stock list: Chart View ➞ 0 - 25 , 25 - 50 , 50 - 75 , 75 - 100 , 100 - 125 , 125 - 150 , 150 - 175 , 175 - 200 , 200 - 225 , 225 - 250 , 250 - 275 , 275 - 300 , 300 - 325 , 325 - 350 , 350 - 375 , 375 - 400 , 400 - 425 , 425 - 450 , 450 - 475 , 475 - 500 , 500 - 525 | ||
 | Click To Change The Sort Order: By Market Cap or Company Size Performance: Year-to-date, Week and Day |  |
| Too many stocks? View smallcap stocks filtered by marketcap & sector |
| Marketcap: All SmallCap Stocks (default-no microcap), Large, Mid-Range, Small |
| Smallcap Sector: Tech, Finance, Energy, Staples, Retail, Industrial, Materials, & Medical |
|
Get the most comprehensive stock market coverage daily at 12Stocks.com ➞ Best Stocks Today ➞ Best Stocks Weekly ➞ Best Stocks Year-to-Date ➞ Best Stocks Trends ➞  Best Stocks Today 12Stocks.com Best Nasdaq Stocks ➞ Best S&P 500 Stocks ➞ Best Tech Stocks ➞ Best Biotech Stocks ➞ |
| Detailed Overview of SmallCap Stocks |
| SmallCap Technical Overview, Leaders & Laggards, Top SmallCap ETF Funds & Detailed SmallCap Stocks List, Charts, Trends & More |
| Smallcap: Technical Analysis, Trends & YTD Performance | |
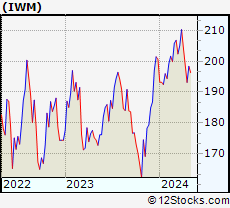
| SmallCap segment as represented by
IWM, an exchange-traded fund [ETF], holds basket of thousands of smallcap stocks from across all major sectors of the US stock market. The smallcap index (contains stocks like Riverbed & Sotheby's) is up by 2.12% and is currently underperforming the overall market by -6% year-to-date. Below is a quick view of technical charts and trends: | |
 IWM Weekly Chart |
|
| Long Term Trend: Very Good | |
| Medium Term Trend: Very Good | |
 IWM Daily Chart |
|
| Short Term Trend: Very Good | |
| Overall Trend Score: 87 | |
| YTD Performance: 2.12% | |
| **Trend Scores & Views Are Only For Educational Purposes And Not For Investing | |
| 12Stocks.com: Top Performing Small Cap Index Stocks | ||||||||||||||||||||||||||||||||||||||||||||||||
 The top performing Small Cap Index stocks year to date are
Now, more recently, over last week, the top performing Small Cap Index stocks on the move are


|
||||||||||||||||||||||||||||||||||||||||||||||||
| 12Stocks.com: Investing in Smallcap Index using Exchange Traded Funds | |
|
The following table shows list of key exchange traded funds (ETF) that
help investors track Smallcap index. The following list also includes leveraged ETF funds that track twice or thrice the daily returns of Smallcap indices. Short or inverse ETF funds move in the opposite direction to the index they track and are useful during market pullbacks or during bear markets. Quick View: Move mouse or cursor over ETF symbol (ticker) to view short-term technical chart and over ETF name to view long term chart. Click on ticker or stock name for detailed view. Click on to add stock symbol to your watchlist and to view watchlist. |
12Stocks.com List of ETFs that track Smallcap Index
| Ticker | ETF Name | Watchlist | Recent Price | Smart Investing & Trading Score | Change % | Week % | Year-to-date % |
| IWM | iShares Russell 2000 | | 204.97 | 87 | 0.22 | 1.52 | 2.12% |
| IJR | iShares Core S&P Small-Cap | | 108.62 | 100 | 0.33 | 1.39 | 0.34% |
| VTWO | Vanguard Russell 2000 ETF | | 82.85 | 82 | 0.23 | 1.52 | 2.16% |
| IWN | iShares Russell 2000 Value | | 155.63 | 100 | -0.01 | 0.92 | 0.19% |
| IWO | iShares Russell 2000 Growth | | 262.30 | 69 | 0.49 | 2.11 | 4% |
| IJS | iShares S&P Small-Cap 600 Value | | 99.68 | 82 | -0.07 | 0.97 | -3.29% |
| IJT | iShares S&P Small-Cap 600 Growth | | 130.16 | 95 | 0.81 | 1.88 | 4.01% |
| XSLV | PowerShares S&P SmallCap Low Volatil ETF | | 44.00 | 100 | 0.96 | 1.8 | -0.34% |
| SAA | ProShares Ultra SmallCap600 | | 24.39 | 95 | 1.16 | 3.39 | -2.24% |
| SMLV | SPDR SSGA US Small Cap Low Volatil ETF | | 110.48 | 82 | -0.10 | 0.72 | -1.81% |
| SBB | ProShares Short SmallCap600 | | 15.97 | 13 | -0.50 | -1.18 | 0.25% |
| SDD | ProShares UltraShort SmallCap600 | | 18.22 | 10 | -1.10 | -3.33 | -1.13% |
| 12Stocks.com: Charts, Trends, Fundamental Data and Performances of SmallCap Stocks | |
|
We now take in-depth look at all SmallCap stocks including charts, multi-period performances and overall trends (as measured by Smart Investing & Trading Score). One can sort SmallCap stocks (click link to choose) by Daily, Weekly and by Year-to-Date performances. Also, one can sort by size of the company or by market capitalization. |
| Select Your Default Chart Type: | |||||
| |||||
| Click on stock symbol or name for detailed view. Click on to add stock symbol to your watchlist and to view watchlist. Quick View: Move mouse or cursor over "Daily" to quickly view daily technical stock chart and over "Weekly" to view weekly technical stock chart. | |||||

 | WVE Wave Life Sciences Ltd. |
| Sector: Health Care | |
| SubSector: Biotechnology | |
| MarketCap: 452.785 Millions | |
| Recent Price: 5.79 Smart Investing & Trading Score: 68 | |
| Day Percent Change: 0.61% Day Change: 0.04 | |
| Week Change: -5.78% Year-to-date Change: 14.6% | |
| WVE Links: Profile News Message Board | |
| Charts:- Daily , Weekly | |
| Add WVE to Watchlist: View: Get Complete WVE Trend Analysis ➞ | |
 | III Information Services Group, Inc. |
| Sector: Technology | |
| SubSector: Information Technology Services | |
| MarketCap: 166.968 Millions | |
| Recent Price: 3.38 Smart Investing & Trading Score: 27 | |
| Day Percent Change: 0.60% Day Change: 0.02 | |
| Week Change: 1.2% Year-to-date Change: -28.2% | |
| III Links: Profile News Message Board | |
| Charts:- Daily , Weekly | |
| Add III to Watchlist: View: Get Complete III Trend Analysis ➞ | |
 | LMNR Limoneira Company |
| Sector: Consumer Staples | |
| SubSector: Farm Products | |
| MarketCap: 324.987 Millions | |
| Recent Price: 21.13 Smart Investing & Trading Score: 68 | |
| Day Percent Change: 0.60% Day Change: 0.13 | |
| Week Change: -3.93% Year-to-date Change: 2.4% | |
| LMNR Links: Profile News Message Board | |
| Charts:- Daily , Weekly | |
| Add LMNR to Watchlist: View: Get Complete LMNR Trend Analysis ➞ | |
 | MRC MRC Global Inc. |
| Sector: Energy | |
| SubSector: Oil & Gas Equipment & Services | |
| MarketCap: 364.061 Millions | |
| Recent Price: 11.66 Smart Investing & Trading Score: 78 | |
| Day Percent Change: 0.60% Day Change: 0.07 | |
| Week Change: 1.3% Year-to-date Change: 5.9% | |
| MRC Links: Profile News Message Board | |
| Charts:- Daily , Weekly | |
| Add MRC to Watchlist: View: Get Complete MRC Trend Analysis ➞ | |
 | RPHM Reneo Pharmaceuticals, Inc. |
| Sector: Health Care | |
| SubSector: Biotechnology | |
| MarketCap: 233 Millions | |
| Recent Price: 1.75 Smart Investing & Trading Score: 78 | |
| Day Percent Change: 0.58% Day Change: 0.01 | |
| Week Change: 0.87% Year-to-date Change: 7.7% | |
| RPHM Links: Profile News Message Board | |
| Charts:- Daily , Weekly | |
| Add RPHM to Watchlist: View: Get Complete RPHM Trend Analysis ➞ | |
 | SABR Sabre Corporation |
| Sector: Technology | |
| SubSector: Information Technology Services | |
| MarketCap: 152.468 Millions | |
| Recent Price: 2.67 Smart Investing & Trading Score: 32 | |
| Day Percent Change: 0.57% Day Change: 0.02 | |
| Week Change: 3.29% Year-to-date Change: -39.4% | |
| SABR Links: Profile News Message Board | |
| Charts:- Daily , Weekly | |
| Add SABR to Watchlist: View: Get Complete SABR Trend Analysis ➞ | |
 | HONE HarborOne Bancorp, Inc. |
| Sector: Financials | |
| SubSector: Savings & Loans | |
| MarketCap: 456.03 Millions | |
| Recent Price: 10.58 Smart Investing & Trading Score: 88 | |
| Day Percent Change: 0.57% Day Change: 0.06 | |
| Week Change: -0.19% Year-to-date Change: -11.7% | |
| HONE Links: Profile News Message Board | |
| Charts:- Daily , Weekly | |
| Add HONE to Watchlist: View: Get Complete HONE Trend Analysis ➞ | |
 | MRSN Mersana Therapeutics, Inc. |
| Sector: Health Care | |
| SubSector: Biotechnology | |
| MarketCap: 224.385 Millions | |
| Recent Price: 3.52 Smart Investing & Trading Score: 69 | |
| Day Percent Change: 0.57% Day Change: 0.02 | |
| Week Change: 1.88% Year-to-date Change: 51.9% | |
| MRSN Links: Profile News Message Board | |
| Charts:- Daily , Weekly | |
| Add MRSN to Watchlist: View: Get Complete MRSN Trend Analysis ➞ | |
 | VOR Vor Biopharma Inc. |
| Sector: Health Care | |
| SubSector: Biotechnology | |
| MarketCap: 224 Millions | |
| Recent Price: 1.77 Smart Investing & Trading Score: 25 | |
| Day Percent Change: 0.57% Day Change: 0.01 | |
| Week Change: -2.75% Year-to-date Change: -20.3% | |
| VOR Links: Profile News Message Board | |
| Charts:- Daily , Weekly | |
| Add VOR to Watchlist: View: Get Complete VOR Trend Analysis ➞ | |
 | EXTR Extreme Networks, Inc. |
| Sector: Technology | |
| SubSector: Communication Equipment | |
| MarketCap: 339.939 Millions | |
| Recent Price: 11.02 Smart Investing & Trading Score: 35 | |
| Day Percent Change: 0.55% Day Change: 0.06 | |
| Week Change: -1.61% Year-to-date Change: -37.5% | |
| EXTR Links: Profile News Message Board | |
| Charts:- Daily , Weekly | |
| Add EXTR to Watchlist: View: Get Complete EXTR Trend Analysis ➞ | |
 | IMMR Immersion Corporation |
| Sector: Technology | |
| SubSector: Application Software | |
| MarketCap: 173.462 Millions | |
| Recent Price: 7.37 Smart Investing & Trading Score: 100 | |
| Day Percent Change: 0.55% Day Change: 0.04 | |
| Week Change: 2.08% Year-to-date Change: 4.4% | |
| IMMR Links: Profile News Message Board | |
| Charts:- Daily , Weekly | |
| Add IMMR to Watchlist: View: Get Complete IMMR Trend Analysis ➞ | |
 | SITM SiTime Corporation |
| Sector: Technology | |
| SubSector: Semiconductor - Specialized | |
| MarketCap: 403.76 Millions | |
| Recent Price: 97.17 Smart Investing & Trading Score: 95 | |
| Day Percent Change: 0.55% Day Change: 0.53 | |
| Week Change: 5.33% Year-to-date Change: -20.4% | |
| SITM Links: Profile News Message Board | |
| Charts:- Daily , Weekly | |
| Add SITM to Watchlist: View: Get Complete SITM Trend Analysis ➞ | |
 | NVEC NVE Corporation |
| Sector: Technology | |
| SubSector: Semiconductor - Specialized | |
| MarketCap: 231.26 Millions | |
| Recent Price: 77.01 Smart Investing & Trading Score: 17 | |
| Day Percent Change: 0.54% Day Change: 0.41 | |
| Week Change: 5.78% Year-to-date Change: -1.8% | |
| NVEC Links: Profile News Message Board | |
| Charts:- Daily , Weekly | |
| Add NVEC to Watchlist: View: Get Complete NVEC Trend Analysis ➞ | |
 | BSRR Sierra Bancorp |
| Sector: Financials | |
| SubSector: Regional - Pacific Banks | |
| MarketCap: 256.929 Millions | |
| Recent Price: 21.43 Smart Investing & Trading Score: 95 | |
| Day Percent Change: 0.52% Day Change: 0.11 | |
| Week Change: 2.78% Year-to-date Change: -5.0% | |
| BSRR Links: Profile News Message Board | |
| Charts:- Daily , Weekly | |
| Add BSRR to Watchlist: View: Get Complete BSRR Trend Analysis ➞ | |
 | VSEC VSE Corporation |
| Sector: Services & Goods | |
| SubSector: Technical Services | |
| MarketCap: 183.61 Millions | |
| Recent Price: 84.86 Smart Investing & Trading Score: 100 | |
| Day Percent Change: 0.52% Day Change: 0.44 | |
| Week Change: 2.36% Year-to-date Change: 31.3% | |
| VSEC Links: Profile News Message Board | |
| Charts:- Daily , Weekly | |
| Add VSEC to Watchlist: View: Get Complete VSEC Trend Analysis ➞ | |
 | MCRI Monarch Casino & Resort, Inc. |
| Sector: Services & Goods | |
| SubSector: Resorts & Casinos | |
| MarketCap: 352.894 Millions | |
| Recent Price: 68.93 Smart Investing & Trading Score: 64 | |
| Day Percent Change: 0.48% Day Change: 0.33 | |
| Week Change: -0.12% Year-to-date Change: -0.3% | |
| MCRI Links: Profile News Message Board | |
| Charts:- Daily , Weekly | |
| Add MCRI to Watchlist: View: Get Complete MCRI Trend Analysis ➞ | |
 | SIGA SIGA Technologies, Inc. |
| Sector: Health Care | |
| SubSector: Biotechnology | |
| MarketCap: 424.285 Millions | |
| Recent Price: 10.44 Smart Investing & Trading Score: 95 | |
| Day Percent Change: 0.48% Day Change: 0.05 | |
| Week Change: 2.86% Year-to-date Change: 86.4% | |
| SIGA Links: Profile News Message Board | |
| Charts:- Daily , Weekly | |
| Add SIGA to Watchlist: View: Get Complete SIGA Trend Analysis ➞ | |
 | PTEN Patterson-UTI Energy, Inc. |
| Sector: Energy | |
| SubSector: Oil & Gas Drilling & Exploration | |
| MarketCap: 422.639 Millions | |
| Recent Price: 11.02 Smart Investing & Trading Score: 42 | |
| Day Percent Change: 0.46% Day Change: 0.05 | |
| Week Change: 3.18% Year-to-date Change: 2.0% | |
| PTEN Links: Profile News Message Board | |
| Charts:- Daily , Weekly | |
| Add PTEN to Watchlist: View: Get Complete PTEN Trend Analysis ➞ | |
 | MBWM Mercantile Bank Corporation |
| Sector: Financials | |
| SubSector: Regional - Midwest Banks | |
| MarketCap: 372.77 Millions | |
| Recent Price: 39.56 Smart Investing & Trading Score: 100 | |
| Day Percent Change: 0.46% Day Change: 0.18 | |
| Week Change: 2.83% Year-to-date Change: -2.0% | |
| MBWM Links: Profile News Message Board | |
| Charts:- Daily , Weekly | |
| Add MBWM to Watchlist: View: Get Complete MBWM Trend Analysis ➞ | |
 | HOFT Hooker Furniture Corporation |
| Sector: Consumer Staples | |
| SubSector: Home Furnishings & Fixtures | |
| MarketCap: 173.235 Millions | |
| Recent Price: 17.70 Smart Investing & Trading Score: 49 | |
| Day Percent Change: 0.45% Day Change: 0.08 | |
| Week Change: 0.57% Year-to-date Change: -32.1% | |
| HOFT Links: Profile News Message Board | |
| Charts:- Daily , Weekly | |
| Add HOFT to Watchlist: View: Get Complete HOFT Trend Analysis ➞ | |
 | TBBK The Bancorp, Inc. |
| Sector: Financials | |
| SubSector: Regional - Mid-Atlantic Banks | |
| MarketCap: 267.859 Millions | |
| Recent Price: 32.43 Smart Investing & Trading Score: 49 | |
| Day Percent Change: 0.43% Day Change: 0.14 | |
| Week Change: 1.6% Year-to-date Change: -15.9% | |
| TBBK Links: Profile News Message Board | |
| Charts:- Daily , Weekly | |
| Add TBBK to Watchlist: View: Get Complete TBBK Trend Analysis ➞ | |
 | DXPE DXP Enterprises, Inc. |
| Sector: Services & Goods | |
| SubSector: Industrial Equipment Wholesale | |
| MarketCap: 243.758 Millions | |
| Recent Price: 53.59 Smart Investing & Trading Score: 90 | |
| Day Percent Change: 0.43% Day Change: 0.23 | |
| Week Change: 2.41% Year-to-date Change: 59.0% | |
| DXPE Links: Profile News Message Board | |
| Charts:- Daily , Weekly | |
| Add DXPE to Watchlist: View: Get Complete DXPE Trend Analysis ➞ | |
 | TK Teekay Corporation |
| Sector: Transports | |
| SubSector: Shipping | |
| MarketCap: 257.914 Millions | |
| Recent Price: 7.67 Smart Investing & Trading Score: 63 | |
| Day Percent Change: 0.39% Day Change: 0.03 | |
| Week Change: -0.52% Year-to-date Change: 7.3% | |
| TK Links: Profile News Message Board | |
| Charts:- Daily , Weekly | |
| Add TK to Watchlist: View: Get Complete TK Trend Analysis ➞ | |
 | EGAN eGain Corporation |
| Sector: Technology | |
| SubSector: Business Software & Services | |
| MarketCap: 201.458 Millions | |
| Recent Price: 6.38 Smart Investing & Trading Score: 68 | |
| Day Percent Change: 0.39% Day Change: 0.02 | |
| Week Change: -0.08% Year-to-date Change: -23.4% | |
| EGAN Links: Profile News Message Board | |
| Charts:- Daily , Weekly | |
| Add EGAN to Watchlist: View: Get Complete EGAN Trend Analysis ➞ | |
 | RLGT Radiant Logistics, Inc. |
| Sector: Transports | |
| SubSector: Air Delivery & Freight Services | |
| MarketCap: 180.868 Millions | |
| Recent Price: 5.12 Smart Investing & Trading Score: 49 | |
| Day Percent Change: 0.39% Day Change: 0.02 | |
| Week Change: 0.99% Year-to-date Change: -22.9% | |
| RLGT Links: Profile News Message Board | |
| Charts:- Daily , Weekly | |
| Add RLGT to Watchlist: View: Get Complete RLGT Trend Analysis ➞ | |
| For tabular summary view of above stock list: Summary View ➞ 0 - 25 , 25 - 50 , 50 - 75 , 75 - 100 , 100 - 125 , 125 - 150 , 150 - 175 , 175 - 200 , 200 - 225 , 225 - 250 , 250 - 275 , 275 - 300 , 300 - 325 , 325 - 350 , 350 - 375 , 375 - 400 , 400 - 425 , 425 - 450 , 450 - 475 , 475 - 500 , 500 - 525 | ||
| Click To Change The Sort Order: By Market Cap or Company Size Performance: Year-to-date, Week and Day | |
| Select Chart Type: | ||
| Too many stocks? View smallcap stocks filtered by marketcap & sector |
| Marketcap: All SmallCap Stocks (default-no microcap), Large, Mid-Range, Small & MicroCap |
| Sector: Tech, Finance, Energy, Staples, Retail, Industrial, Materials, Utilities & Medical |
|
Best Stocks Today 12Stocks.com |
© 2024 12Stocks.com Terms & Conditions Privacy Contact Us
All Information Provided Only For Education And Not To Be Used For Investing or Trading. See Terms & Conditions


One More Thing ... Get Best Stocks Delivered Daily!
Never Ever Miss A Move With Our Top Ten Stocks Lists
Find Best Stocks In Any Market - Bull or Bear Market
Take A Peek At Our Top Ten Stocks Lists: Daily, Weekly, Year-to-Date & Top Trends
Find Best Stocks In Any Market - Bull or Bear Market
Take A Peek At Our Top Ten Stocks Lists: Daily, Weekly, Year-to-Date & Top Trends
Smallcap Stocks With Best Up Trends [0-bearish to 100-bullish]: Design [100], Ambac Financial[100], Summit [100], EverQuote [100], Zeta Global[100], Coca-Cola Consolidated[100], Origin Materials[100], J & J Snack Foods[100], Sterling Construction[100], Vanda [100], Semrush [100]
Best Smallcap Stocks Year-to-Date:
Janux [471.8%], Viking [327.92%], Longboard [261.21%], Alpine Immune[239.34%], Bakkt [227.35%], Vera [190.57%], Super Micro[188.3%], Cullinan Oncology[187.84%], Avidity Biosciences[180.97%], Y-mAbs [152.49%], Arcutis Bio[143.81%] Best Smallcap Stocks This Week:
Perficient [52.28%], Thoughtworks Holding[34.22%], Trupanion [28.82%], DASAN Zhone[26.29%], Great Lakes[26.01%], Design [23.42%], Workhorse Group[23.19%], Ambac Financial[22.97%], P3 Health[22.14%], Summit [20.73%], Sterling Construction[20.6%] Best Smallcap Stocks Daily:
Design [28.85%], Great Lakes[24.57%], Thoughtworks Holding[19.84%], Ambac Financial[19.31%], Summit [18.57%], EverQuote [18.40%], Zeta Global[18.35%], Coca-Cola Consolidated[17.76%], FibroGen [17.67%], Origin Materials[17.31%], J & J Snack Foods[16.43%]