
 Login Sign Up


| |||||
 |  | ||||

| 12Stocks.com Market Intelligence |
Best SmallCap Stocks
|
| In a hurry? Small Cap Stock Lists: Performance Trends Table, Stock Charts
Sort Small Cap stocks: Daily, Weekly, Year-to-Date, Market Cap & Trends. Filter Small Cap stocks list by sector: Show all, Tech, Finance, Energy, Staples, Retail, Industrial, Materials, Utilities and HealthCare Filter Small Cap stocks list by size: All Large Medium Small and MicroCap |
| 12Stocks.com Small Cap Stocks Performances & Trends Daily | |||||||||
|
|  The overall Smart Investing & Trading Score is 82 (0-bearish to 100-bullish) which puts Small Cap index in short term bullish trend. The Smart Investing & Trading Score from previous trading session is 69 and hence an improvement of trend.
| ||||||||
Here are the Smart Investing & Trading Scores of the most requested small cap stocks at 12Stocks.com (click stock name for detailed review):
|


| 12Stocks.com: Investing in Smallcap Index with Stocks | |
|
The following table helps investors and traders sort through current performance and trends (as measured by Smart Investing & Trading Score) of various
stocks in the Smallcap Index. Quick View: Move mouse or cursor over stock symbol (ticker) to view short-term technical chart and over stock name to view long term chart. Click on  to add stock symbol to your watchlist and to add stock symbol to your watchlist and  to view watchlist. Click on any ticker or stock name for detailed market intelligence report for that stock. to view watchlist. Click on any ticker or stock name for detailed market intelligence report for that stock. |
12Stocks.com Performance of Stocks in Smallcap Index
| Ticker | Stock Name | Watchlist | Category | Recent Price | Smart Investing & Trading Score | Change % | YTD Change% |
| HWKN | Hawkins |   | Materials | 78.53 | 95 | 2.52 | 11.52% |
| IMRX | Immuneering | | Health Care | 1.66 | 49 | 2.47 | -78.13% |
| KLTR | Kaltura | | Technology | 1.25 | 49 | 2.46 | -36.22% |
| CWH | Camping World | | Financials | 20.59 | 32 | 2.44 | -21.59% |
| SSBK | Southern States | | Financials | 26.15 | 100 | 2.43 | -11.19% |
| CZNC | Citizens & Northern | | Financials | 18.25 | 80 | 2.41 | -18.64% |
| LBRT | Liberty Oilfield | | Energy | 22.16 | 58 | 2.40 | 22.16% |
| TPC | Tutor Perini | | Industrials | 18.42 | 95 | 2.39 | 102.42% |
| AOMR | Angel Oak | | Financials | 11.39 | 80 | 2.38 | 7.35% |
| MBWM | Mercantile Bank | | Financials | 39.38 | 100 | 2.37 | -2.48% |
| MLR | Miller Industries | | Consumer Staples | 54.22 | 100 | 2.36 | 28.21% |
| SIGA | SIGA | | Health Care | 10.39 | 95 | 2.36 | 85.54% |
| AKYA | Akoya Biosciences | | Health Care | 4.13 | 74 | 2.35 | -15.54% |
| RUSHB | Rush Enterprises | | Services & Goods | 41.94 | 32 | 2.34 | -20.84% |
| BZH | Beazer Homes | | Industrials | 28.34 | 57 | 2.31 | -16.13% |
| FRGE | Forge Global | | Technology | 1.99 | 69 | 2.31 | -44.26% |
| AXL | American Axle | | Consumer Staples | 7.66 | 100 | 2.27 | -13.05% |
| STHO | Star | | Financials | 12.67 | 100 | 2.26 | -15.51% |
| BSRR | Sierra Bancorp | | Financials | 21.32 | 95 | 2.25 | -5.45% |
| HBCP | Home Bancorp | | Financials | 37.78 | 100 | 2.25 | -10.07% |
| HUMA | Humacyte | | Health Care | 4.55 | 95 | 2.25 | 60.21% |
| MIRM | Mirum | | Health Care | 26.41 | 64 | 2.21 | -10.54% |
| GAMB | Gambling.com Group | | Services & Goods | 9.24 | 100 | 2.21 | -5.33% |
| TITN | Titan Machinery | | Services & Goods | 23.32 | 67 | 2.19 | -19.25% |
| ATRO | Astronics | | Industrials | 18.77 | 64 | 2.18 | 7.75% |
| For chart view version of above stock list: Chart View ➞ 0 - 25 , 25 - 50 , 50 - 75 , 75 - 100 , 100 - 125 , 125 - 150 , 150 - 175 , 175 - 200 , 200 - 225 , 225 - 250 , 250 - 275 , 275 - 300 , 300 - 325 , 325 - 350 , 350 - 375 , 375 - 400 , 400 - 425 , 425 - 450 , 450 - 475 , 475 - 500 , 500 - 525 | ||
 | Click To Change The Sort Order: By Market Cap or Company Size Performance: Year-to-date, Week and Day |  |
| Too many stocks? View smallcap stocks filtered by marketcap & sector |
| Marketcap: All SmallCap Stocks (default-no microcap), Large, Mid-Range, Small |
| Smallcap Sector: Tech, Finance, Energy, Staples, Retail, Industrial, Materials, & Medical |
|
Get the most comprehensive stock market coverage daily at 12Stocks.com ➞ Best Stocks Today ➞ Best Stocks Weekly ➞ Best Stocks Year-to-Date ➞ Best Stocks Trends ➞  Best Stocks Today 12Stocks.com Best Nasdaq Stocks ➞ Best S&P 500 Stocks ➞ Best Tech Stocks ➞ Best Biotech Stocks ➞ |
| Detailed Overview of SmallCap Stocks |
| SmallCap Technical Overview, Leaders & Laggards, Top SmallCap ETF Funds & Detailed SmallCap Stocks List, Charts, Trends & More |
| Smallcap: Technical Analysis, Trends & YTD Performance | |
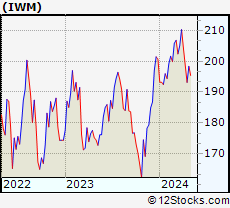
| SmallCap segment as represented by
IWM, an exchange-traded fund [ETF], holds basket of thousands of smallcap stocks from across all major sectors of the US stock market. The smallcap index (contains stocks like Riverbed & Sotheby's) is up by 1.89% and is currently underperforming the overall market by -6.13% year-to-date. Below is a quick view of technical charts and trends: | |
 IWM Weekly Chart |
|
| Long Term Trend: Very Good | |
| Medium Term Trend: Very Good | |
 IWM Daily Chart |
|
| Short Term Trend: Very Good | |
| Overall Trend Score: 82 | |
| YTD Performance: 1.89% | |
| **Trend Scores & Views Are Only For Educational Purposes And Not For Investing | |
| 12Stocks.com: Top Performing Small Cap Index Stocks | ||||||||||||||||||||||||||||||||||||||||||||||||
 The top performing Small Cap Index stocks year to date are
Now, more recently, over last week, the top performing Small Cap Index stocks on the move are


|
||||||||||||||||||||||||||||||||||||||||||||||||
| 12Stocks.com: Investing in Smallcap Index using Exchange Traded Funds | |
|
The following table shows list of key exchange traded funds (ETF) that
help investors track Smallcap index. The following list also includes leveraged ETF funds that track twice or thrice the daily returns of Smallcap indices. Short or inverse ETF funds move in the opposite direction to the index they track and are useful during market pullbacks or during bear markets. Quick View: Move mouse or cursor over ETF symbol (ticker) to view short-term technical chart and over ETF name to view long term chart. Click on ticker or stock name for detailed view. Click on to add stock symbol to your watchlist and to view watchlist. |
12Stocks.com List of ETFs that track Smallcap Index
| Ticker | ETF Name | Watchlist | Recent Price | Smart Investing & Trading Score | Change % | Week % | Year-to-date % |
| IWM | iShares Russell 2000 | | 204.51 | 82 | 1.29 | 1.29 | 1.89% |
| IJR | iShares Core S&P Small-Cap | | 108.26 | 100 | 1.05 | 1.05 | 0.01% |
| VTWO | Vanguard Russell 2000 ETF | | 82.66 | 82 | 1.29 | 1.29 | 1.92% |
| IWN | iShares Russell 2000 Value | | 155.65 | 100 | 0.93 | 0.93 | 0.21% |
| IWO | iShares Russell 2000 Growth | | 261.01 | 69 | 1.61 | 1.61 | 3.49% |
| IJS | iShares S&P Small-Cap 600 Value | | 99.75 | 69 | 1.04 | 1.04 | -3.22% |
| IJT | iShares S&P Small-Cap 600 Growth | | 129.12 | 90 | 1.06 | 1.06 | 3.18% |
| XSLV | PowerShares S&P SmallCap Low Volatil ETF | | 43.58 | 87 | 0.83 | 0.83 | -1.29% |
| SAA | ProShares Ultra SmallCap600 | | 24.11 | 82 | 2.20 | 2.2 | -3.37% |
| SDD | ProShares UltraShort SmallCap600 | | 18.42 | 10 | -2.26 | -2.26 | -0.04% |
| SBB | ProShares Short SmallCap600 | | 16.05 | 13 | -0.67 | -0.67 | 0.76% |
| SMLV | SPDR SSGA US Small Cap Low Volatil ETF | | 110.59 | 100 | 0.83 | 0.83 | -1.72% |
| 12Stocks.com: Charts, Trends, Fundamental Data and Performances of SmallCap Stocks | |
|
We now take in-depth look at all SmallCap stocks including charts, multi-period performances and overall trends (as measured by Smart Investing & Trading Score). One can sort SmallCap stocks (click link to choose) by Daily, Weekly and by Year-to-Date performances. Also, one can sort by size of the company or by market capitalization. |
| Select Your Default Chart Type: | |||||
| |||||
| Click on stock symbol or name for detailed view. Click on to add stock symbol to your watchlist and to view watchlist. Quick View: Move mouse or cursor over "Daily" to quickly view daily technical stock chart and over "Weekly" to view weekly technical stock chart. | |||||

 | HWKN Hawkins, Inc. |
| Sector: Materials | |
| SubSector: Specialty Chemicals | |
| MarketCap: 398.957 Millions | |
| Recent Price: 78.53 Smart Investing & Trading Score: 95 | |
| Day Percent Change: 2.52% Day Change: 1.93 | |
| Week Change: 2.52% Year-to-date Change: 11.5% | |
| HWKN Links: Profile News Message Board | |
| Charts:- Daily , Weekly | |
| Add HWKN to Watchlist: View: Get Complete HWKN Trend Analysis ➞ | |
 | IMRX Immuneering Corporation |
| Sector: Health Care | |
| SubSector: Biotechnology | |
| MarketCap: 303 Millions | |
| Recent Price: 1.66 Smart Investing & Trading Score: 49 | |
| Day Percent Change: 2.47% Day Change: 0.04 | |
| Week Change: 2.47% Year-to-date Change: -78.1% | |
| IMRX Links: Profile News Message Board | |
| Charts:- Daily , Weekly | |
| Add IMRX to Watchlist: View: Get Complete IMRX Trend Analysis ➞ | |
 | KLTR Kaltura, Inc. |
| Sector: Technology | |
| SubSector: Software - Application | |
| MarketCap: 293 Millions | |
| Recent Price: 1.25 Smart Investing & Trading Score: 49 | |
| Day Percent Change: 2.46% Day Change: 0.03 | |
| Week Change: 2.46% Year-to-date Change: -36.2% | |
| KLTR Links: Profile News Message Board | |
| Charts:- Daily , Weekly | |
| Add KLTR to Watchlist: View: Get Complete KLTR Trend Analysis ➞ | |
 | CWH Camping World Holdings, Inc. |
| Sector: Financials | |
| SubSector: REIT - Office | |
| MarketCap: 473.566 Millions | |
| Recent Price: 20.59 Smart Investing & Trading Score: 32 | |
| Day Percent Change: 2.44% Day Change: 0.49 | |
| Week Change: 2.44% Year-to-date Change: -21.6% | |
| CWH Links: Profile News Message Board | |
| Charts:- Daily , Weekly | |
| Add CWH to Watchlist: View: Get Complete CWH Trend Analysis ➞ | |
 | SSBK Southern States Bancshares, Inc. |
| Sector: Financials | |
| SubSector: Banks - Regional | |
| MarketCap: 187 Millions | |
| Recent Price: 26.15 Smart Investing & Trading Score: 100 | |
| Day Percent Change: 2.43% Day Change: 0.62 | |
| Week Change: 2.43% Year-to-date Change: -11.2% | |
| SSBK Links: Profile News Message Board | |
| Charts:- Daily , Weekly | |
| Add SSBK to Watchlist: View: Get Complete SSBK Trend Analysis ➞ | |
 | CZNC Citizens & Northern Corporation |
| Sector: Financials | |
| SubSector: Regional - Mid-Atlantic Banks | |
| MarketCap: 274.459 Millions | |
| Recent Price: 18.25 Smart Investing & Trading Score: 80 | |
| Day Percent Change: 2.41% Day Change: 0.43 | |
| Week Change: 2.41% Year-to-date Change: -18.6% | |
| CZNC Links: Profile News Message Board | |
| Charts:- Daily , Weekly | |
| Add CZNC to Watchlist: View: Get Complete CZNC Trend Analysis ➞ | |
 | LBRT Liberty Oilfield Services Inc. |
| Sector: Energy | |
| SubSector: Oil & Gas Equipment & Services | |
| MarketCap: 308.261 Millions | |
| Recent Price: 22.16 Smart Investing & Trading Score: 58 | |
| Day Percent Change: 2.40% Day Change: 0.52 | |
| Week Change: 2.4% Year-to-date Change: 22.2% | |
| LBRT Links: Profile News Message Board | |
| Charts:- Daily , Weekly | |
| Add LBRT to Watchlist: View: Get Complete LBRT Trend Analysis ➞ | |
 | TPC Tutor Perini Corporation |
| Sector: Industrials | |
| SubSector: Heavy Construction | |
| MarketCap: 382.595 Millions | |
| Recent Price: 18.42 Smart Investing & Trading Score: 95 | |
| Day Percent Change: 2.39% Day Change: 0.43 | |
| Week Change: 2.39% Year-to-date Change: 102.4% | |
| TPC Links: Profile News Message Board | |
| Charts:- Daily , Weekly | |
| Add TPC to Watchlist: View: Get Complete TPC Trend Analysis ➞ | |
 | AOMR Angel Oak Mortgage REIT, Inc. |
| Sector: Financials | |
| SubSector: REIT - Mortgage | |
| MarketCap: 202 Millions | |
| Recent Price: 11.39 Smart Investing & Trading Score: 80 | |
| Day Percent Change: 2.38% Day Change: 0.27 | |
| Week Change: 2.38% Year-to-date Change: 7.4% | |
| AOMR Links: Profile News Message Board | |
| Charts:- Daily , Weekly | |
| Add AOMR to Watchlist: View: Get Complete AOMR Trend Analysis ➞ | |
 | MBWM Mercantile Bank Corporation |
| Sector: Financials | |
| SubSector: Regional - Midwest Banks | |
| MarketCap: 372.77 Millions | |
| Recent Price: 39.38 Smart Investing & Trading Score: 100 | |
| Day Percent Change: 2.37% Day Change: 0.91 | |
| Week Change: 2.37% Year-to-date Change: -2.5% | |
| MBWM Links: Profile News Message Board | |
| Charts:- Daily , Weekly | |
| Add MBWM to Watchlist: View: Get Complete MBWM Trend Analysis ➞ | |
 | MLR Miller Industries, Inc. |
| Sector: Consumer Staples | |
| SubSector: Auto Parts | |
| MarketCap: 335.239 Millions | |
| Recent Price: 54.22 Smart Investing & Trading Score: 100 | |
| Day Percent Change: 2.36% Day Change: 1.25 | |
| Week Change: 2.36% Year-to-date Change: 28.2% | |
| MLR Links: Profile News Message Board | |
| Charts:- Daily , Weekly | |
| Add MLR to Watchlist: View: Get Complete MLR Trend Analysis ➞ | |
 | SIGA SIGA Technologies, Inc. |
| Sector: Health Care | |
| SubSector: Biotechnology | |
| MarketCap: 424.285 Millions | |
| Recent Price: 10.39 Smart Investing & Trading Score: 95 | |
| Day Percent Change: 2.36% Day Change: 0.24 | |
| Week Change: 2.36% Year-to-date Change: 85.5% | |
| SIGA Links: Profile News Message Board | |
| Charts:- Daily , Weekly | |
| Add SIGA to Watchlist: View: Get Complete SIGA Trend Analysis ➞ | |
 | AKYA Akoya Biosciences, Inc. |
| Sector: Health Care | |
| SubSector: Medical Instruments & Supplies | |
| MarketCap: 340 Millions | |
| Recent Price: 4.13 Smart Investing & Trading Score: 74 | |
| Day Percent Change: 2.35% Day Change: 0.09 | |
| Week Change: 2.35% Year-to-date Change: -15.5% | |
| AKYA Links: Profile News Message Board | |
| Charts:- Daily , Weekly | |
| Add AKYA to Watchlist: View: Get Complete AKYA Trend Analysis ➞ | |
 | RUSHB Rush Enterprises, Inc. |
| Sector: Services & Goods | |
| SubSector: Auto Dealerships | |
| MarketCap: 203.221 Millions | |
| Recent Price: 41.94 Smart Investing & Trading Score: 32 | |
| Day Percent Change: 2.34% Day Change: 0.96 | |
| Week Change: 2.34% Year-to-date Change: -20.8% | |
| RUSHB Links: Profile News Message Board | |
| Charts:- Daily , Weekly | |
| Add RUSHB to Watchlist: View: Get Complete RUSHB Trend Analysis ➞ | |
 | BZH Beazer Homes USA, Inc. |
| Sector: Industrials | |
| SubSector: Residential Construction | |
| MarketCap: 180.106 Millions | |
| Recent Price: 28.34 Smart Investing & Trading Score: 57 | |
| Day Percent Change: 2.31% Day Change: 0.64 | |
| Week Change: 2.31% Year-to-date Change: -16.1% | |
| BZH Links: Profile News Message Board | |
| Charts:- Daily , Weekly | |
| Add BZH to Watchlist: View: Get Complete BZH Trend Analysis ➞ | |
 | FRGE Forge Global Holdings, Inc. |
| Sector: Technology | |
| SubSector: Software - Application | |
| MarketCap: 426 Millions | |
| Recent Price: 1.99 Smart Investing & Trading Score: 69 | |
| Day Percent Change: 2.31% Day Change: 0.04 | |
| Week Change: 2.31% Year-to-date Change: -44.3% | |
| FRGE Links: Profile News Message Board | |
| Charts:- Daily , Weekly | |
| Add FRGE to Watchlist: View: Get Complete FRGE Trend Analysis ➞ | |
 | AXL American Axle & Manufacturing Holdings, Inc. |
| Sector: Consumer Staples | |
| SubSector: Auto Parts | |
| MarketCap: 407.139 Millions | |
| Recent Price: 7.66 Smart Investing & Trading Score: 100 | |
| Day Percent Change: 2.27% Day Change: 0.17 | |
| Week Change: 2.27% Year-to-date Change: -13.1% | |
| AXL Links: Profile News Message Board | |
| Charts:- Daily , Weekly | |
| Add AXL to Watchlist: View: Get Complete AXL Trend Analysis ➞ | |
 | STHO Star Holdings |
| Sector: Financials | |
| SubSector: Financials Services | |
| MarketCap: 195 Millions | |
| Recent Price: 12.67 Smart Investing & Trading Score: 100 | |
| Day Percent Change: 2.26% Day Change: 0.28 | |
| Week Change: 2.26% Year-to-date Change: -15.5% | |
| STHO Links: Profile News Message Board | |
| Charts:- Daily , Weekly | |
| Add STHO to Watchlist: View: Get Complete STHO Trend Analysis ➞ | |
 | BSRR Sierra Bancorp |
| Sector: Financials | |
| SubSector: Regional - Pacific Banks | |
| MarketCap: 256.929 Millions | |
| Recent Price: 21.32 Smart Investing & Trading Score: 95 | |
| Day Percent Change: 2.25% Day Change: 0.47 | |
| Week Change: 2.25% Year-to-date Change: -5.5% | |
| BSRR Links: Profile News Message Board | |
| Charts:- Daily , Weekly | |
| Add BSRR to Watchlist: View: Get Complete BSRR Trend Analysis ➞ | |
 | HBCP Home Bancorp, Inc. |
| Sector: Financials | |
| SubSector: Savings & Loans | |
| MarketCap: 206.83 Millions | |
| Recent Price: 37.78 Smart Investing & Trading Score: 100 | |
| Day Percent Change: 2.25% Day Change: 0.83 | |
| Week Change: 2.25% Year-to-date Change: -10.1% | |
| HBCP Links: Profile News Message Board | |
| Charts:- Daily , Weekly | |
| Add HBCP to Watchlist: View: Get Complete HBCP Trend Analysis ➞ | |
 | HUMA Humacyte, Inc. |
| Sector: Health Care | |
| SubSector: Biotechnology | |
| MarketCap: 297 Millions | |
| Recent Price: 4.55 Smart Investing & Trading Score: 95 | |
| Day Percent Change: 2.25% Day Change: 0.10 | |
| Week Change: 2.25% Year-to-date Change: 60.2% | |
| HUMA Links: Profile News Message Board | |
| Charts:- Daily , Weekly | |
| Add HUMA to Watchlist: View: Get Complete HUMA Trend Analysis ➞ | |
 | MIRM Mirum Pharmaceuticals, Inc. |
| Sector: Health Care | |
| SubSector: Biotechnology | |
| MarketCap: 309.585 Millions | |
| Recent Price: 26.41 Smart Investing & Trading Score: 64 | |
| Day Percent Change: 2.21% Day Change: 0.57 | |
| Week Change: 2.21% Year-to-date Change: -10.5% | |
| MIRM Links: Profile News Message Board | |
| Charts:- Daily , Weekly | |
| Add MIRM to Watchlist: View: Get Complete MIRM Trend Analysis ➞ | |
 | GAMB Gambling.com Group Limited |
| Sector: Services & Goods | |
| SubSector: Gambling | |
| MarketCap: 376 Millions | |
| Recent Price: 9.24 Smart Investing & Trading Score: 100 | |
| Day Percent Change: 2.21% Day Change: 0.20 | |
| Week Change: 2.21% Year-to-date Change: -5.3% | |
| GAMB Links: Profile News Message Board | |
| Charts:- Daily , Weekly | |
| Add GAMB to Watchlist: View: Get Complete GAMB Trend Analysis ➞ | |
 | TITN Titan Machinery Inc. |
| Sector: Services & Goods | |
| SubSector: Industrial Equipment Wholesale | |
| MarketCap: 208.958 Millions | |
| Recent Price: 23.32 Smart Investing & Trading Score: 67 | |
| Day Percent Change: 2.19% Day Change: 0.50 | |
| Week Change: 2.19% Year-to-date Change: -19.3% | |
| TITN Links: Profile News Message Board | |
| Charts:- Daily , Weekly | |
| Add TITN to Watchlist: View: Get Complete TITN Trend Analysis ➞ | |
 | ATRO Astronics Corporation |
| Sector: Industrials | |
| SubSector: Aerospace/Defense Products & Services | |
| MarketCap: 287.201 Millions | |
| Recent Price: 18.77 Smart Investing & Trading Score: 64 | |
| Day Percent Change: 2.18% Day Change: 0.40 | |
| Week Change: 2.18% Year-to-date Change: 7.8% | |
| ATRO Links: Profile News Message Board | |
| Charts:- Daily , Weekly | |
| Add ATRO to Watchlist: View: Get Complete ATRO Trend Analysis ➞ | |
| For tabular summary view of above stock list: Summary View ➞ 0 - 25 , 25 - 50 , 50 - 75 , 75 - 100 , 100 - 125 , 125 - 150 , 150 - 175 , 175 - 200 , 200 - 225 , 225 - 250 , 250 - 275 , 275 - 300 , 300 - 325 , 325 - 350 , 350 - 375 , 375 - 400 , 400 - 425 , 425 - 450 , 450 - 475 , 475 - 500 , 500 - 525 | ||
| Click To Change The Sort Order: By Market Cap or Company Size Performance: Year-to-date, Week and Day | |
| Select Chart Type: | ||
| Too many stocks? View smallcap stocks filtered by marketcap & sector |
| Marketcap: All SmallCap Stocks (default-no microcap), Large, Mid-Range, Small & MicroCap |
| Sector: Tech, Finance, Energy, Staples, Retail, Industrial, Materials, Utilities & Medical |
|
Best Stocks Today 12Stocks.com |
© 2024 12Stocks.com Terms & Conditions Privacy Contact Us
All Information Provided Only For Education And Not To Be Used For Investing or Trading. See Terms & Conditions


One More Thing ... Get Best Stocks Delivered Daily!
Never Ever Miss A Move With Our Top Ten Stocks Lists
Find Best Stocks In Any Market - Bull or Bear Market
Take A Peek At Our Top Ten Stocks Lists: Daily, Weekly, Year-to-Date & Top Trends
Find Best Stocks In Any Market - Bull or Bear Market
Take A Peek At Our Top Ten Stocks Lists: Daily, Weekly, Year-to-Date & Top Trends
Smallcap Stocks With Best Up Trends [0-bearish to 100-bullish]: Perficient [100], Outset Medical[100], Lineage Cell[100], Assertio [100], Dakota Gold[100], Loln Educational[100], Twist Bioscience[100], PMV [100], SilverBow Resources[100], Phathom [100], Alexander s[100]
Best Smallcap Stocks Year-to-Date:
CareMax [511.34%], Janux [479.25%], Viking [320.26%], Alpine Immune[239.29%], Longboard [237.32%], Bakkt [197.53%], Vera [194.15%], Super Micro[192.11%], Avidity Biosciences[189.6%], Cullinan Oncology[178.76%], Y-mAbs [152.79%] Best Smallcap Stocks This Week:
Perficient [52.28%], P3 Health[25.16%], Outset Medical[23%], Lineage Cell[22.64%], Workhorse Group[20.5%], SoundHound AI[19.54%], DASAN Zhone[19.25%], BioCryst [18.43%], Marathon Patent[17.98%], Assertio [16.99%], Aceto [16.55%] Best Smallcap Stocks Daily:
Perficient [52.28%], P3 Health[25.16%], Outset Medical[23.00%], Lineage Cell[22.64%], Workhorse Group[20.50%], SoundHound AI[19.54%], DASAN Zhone[19.25%], BioCryst [18.43%], Marathon Patent[17.98%], Assertio [16.99%], Aceto [16.55%]