
 Login Sign Up


| |||||
 |  | ||||

| 12Stocks.com Market Intelligence |
Best SmallCap Stocks
|
| In a hurry? Small Cap Stock Lists: Performance Trends Table, Stock Charts
Sort Small Cap stocks: Daily, Weekly, Year-to-Date, Market Cap & Trends. Filter Small Cap stocks list by sector: Show all, Tech, Finance, Energy, Staples, Retail, Industrial, Materials, Utilities and HealthCare Filter Small Cap stocks list by size: All Large Medium Small and MicroCap |
| 12Stocks.com Small Cap Stocks Performances & Trends Daily | |||||||||
|
|  The overall Smart Investing & Trading Score is 82 (0-bearish to 100-bullish) which puts Small Cap index in short term bullish trend. The Smart Investing & Trading Score from previous trading session is 69 and hence an improvement of trend.
| ||||||||
Here are the Smart Investing & Trading Scores of the most requested small cap stocks at 12Stocks.com (click stock name for detailed review):
|


| 12Stocks.com: Investing in Smallcap Index with Stocks | |
|
The following table helps investors and traders sort through current performance and trends (as measured by Smart Investing & Trading Score) of various
stocks in the Smallcap Index. Quick View: Move mouse or cursor over stock symbol (ticker) to view short-term technical chart and over stock name to view long term chart. Click on  to add stock symbol to your watchlist and to add stock symbol to your watchlist and  to view watchlist. Click on any ticker or stock name for detailed market intelligence report for that stock. to view watchlist. Click on any ticker or stock name for detailed market intelligence report for that stock. |
12Stocks.com Performance of Stocks in Smallcap Index
| Ticker | Stock Name | Watchlist | Category | Recent Price | Smart Investing & Trading Score | Change % | YTD Change% |
| CURV | Torrid |   | Services & Goods | 5.15 | 78 | -1.72 | -11.97% |
| CLDT | Chatham Lodging | | Financials | 9.02 | 10 | -1.74 | -15.86% |
| PKOH | Park-Ohio | | Services & Goods | 25.60 | 32 | -1.80 | -5.04% |
| GNK | Genco Shipping | | Transports | 21.85 | 66 | -1.84 | 31.71% |
| VCEL | Vericel | | Health Care | 46.94 | 49 | -1.86 | 31.82% |
| RBBN | Ribbon | | Technology | 3.11 | 51 | -1.89 | 7.24% |
| SRRK | Scholar Rock | | Health Care | 15.06 | 40 | -1.89 | -19.89% |
| RSVR | Reservoir Media | | Services & Goods | 8.52 | 46 | -1.90 | 19.66% |
| LCNB | LCNB | | Financials | 14.35 | 44 | -1.91 | -9.00% |
| KOP | Koppers | | Materials | 43.12 | 0 | -1.93 | -15.81% |
| WISH | ContextLogic | | Services & Goods | 5.21 | 5 | -1.98 | -12.45% |
| MRNS | Marinus | | Health Care | 1.48 | 35 | -1.99 | -86.38% |
| AXGN | AxoGen | | Health Care | 5.67 | 0 | -2.07 | -16.98% |
| NC | NACCO Industries | | Consumer Staples | 32.53 | 74 | -2.08 | -10.88% |
| LPG | Dorian LPG | | Transports | 42.00 | 73 | -2.08 | -4.26% |
| NKSH | National Bankshares | | Financials | 26.99 | 10 | -2.10 | -16.57% |
| EXTR | Extreme s | | Technology | 10.96 | 35 | -2.14 | -37.87% |
| HSHP | Himalaya Shipping | | Industrials | 8.24 | 73 | -2.14 | 22.07% |
| UFPT | UFP | | Consumer Staples | 256.49 | 100 | -2.16 | 49.09% |
| FPI | Farmland Partners | | Financials | 10.96 | 42 | -2.23 | -12.18% |
| FFWM | First Foundation | | Financials | 5.68 | 42 | -2.24 | -41.32% |
| ZYXI | Zynex | | Health Care | 10.75 | 0 | -2.27 | -1.29% |
| BTAI | BioXcel | | Health Care | 2.51 | 10 | -2.33 | -14.92% |
| RMNI | Rimini Street | | Technology | 2.49 | 0 | -2.35 | -23.85% |
| AURA | Aura Biosciences | | Health Care | 7.70 | 45 | -2.35 | -13.05% |
| For chart view version of above stock list: Chart View ➞ 0 - 25 , 25 - 50 , 50 - 75 , 75 - 100 , 100 - 125 , 125 - 150 , 150 - 175 , 175 - 200 , 200 - 225 , 225 - 250 , 250 - 275 , 275 - 300 , 300 - 325 , 325 - 350 , 350 - 375 , 375 - 400 , 400 - 425 , 425 - 450 , 450 - 475 , 475 - 500 , 500 - 525 | ||
 | Click To Change The Sort Order: By Market Cap or Company Size Performance: Year-to-date, Week and Day |  |
| Too many stocks? View smallcap stocks filtered by marketcap & sector |
| Marketcap: All SmallCap Stocks (default-no microcap), Large, Mid-Range, Small |
| Smallcap Sector: Tech, Finance, Energy, Staples, Retail, Industrial, Materials, & Medical |
|
Get the most comprehensive stock market coverage daily at 12Stocks.com ➞ Best Stocks Today ➞ Best Stocks Weekly ➞ Best Stocks Year-to-Date ➞ Best Stocks Trends ➞  Best Stocks Today 12Stocks.com Best Nasdaq Stocks ➞ Best S&P 500 Stocks ➞ Best Tech Stocks ➞ Best Biotech Stocks ➞ |
| Detailed Overview of SmallCap Stocks |
| SmallCap Technical Overview, Leaders & Laggards, Top SmallCap ETF Funds & Detailed SmallCap Stocks List, Charts, Trends & More |
| Smallcap: Technical Analysis, Trends & YTD Performance | |
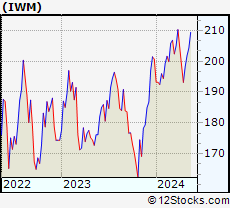
| SmallCap segment as represented by
IWM, an exchange-traded fund [ETF], holds basket of thousands of smallcap stocks from across all major sectors of the US stock market. The smallcap index (contains stocks like Riverbed & Sotheby's) is up by 1.89% and is currently underperforming the overall market by -6.13% year-to-date. Below is a quick view of technical charts and trends: | |
 IWM Weekly Chart |
|
| Long Term Trend: Very Good | |
| Medium Term Trend: Very Good | |
 IWM Daily Chart |
|
| Short Term Trend: Very Good | |
| Overall Trend Score: 82 | |
| YTD Performance: 1.89% | |
| **Trend Scores & Views Are Only For Educational Purposes And Not For Investing | |
| 12Stocks.com: Top Performing Small Cap Index Stocks | ||||||||||||||||||||||||||||||||||||||||||||||||
 The top performing Small Cap Index stocks year to date are
Now, more recently, over last week, the top performing Small Cap Index stocks on the move are


|
||||||||||||||||||||||||||||||||||||||||||||||||
| 12Stocks.com: Investing in Smallcap Index using Exchange Traded Funds | |
|
The following table shows list of key exchange traded funds (ETF) that
help investors track Smallcap index. The following list also includes leveraged ETF funds that track twice or thrice the daily returns of Smallcap indices. Short or inverse ETF funds move in the opposite direction to the index they track and are useful during market pullbacks or during bear markets. Quick View: Move mouse or cursor over ETF symbol (ticker) to view short-term technical chart and over ETF name to view long term chart. Click on ticker or stock name for detailed view. Click on to add stock symbol to your watchlist and to view watchlist. |
12Stocks.com List of ETFs that track Smallcap Index
| Ticker | ETF Name | Watchlist | Recent Price | Smart Investing & Trading Score | Change % | Week % | Year-to-date % |
| IWM | iShares Russell 2000 | | 204.51 | 82 | 1.29 | 1.29 | 1.89% |
| IJR | iShares Core S&P Small-Cap | | 108.26 | 100 | 1.05 | 1.05 | 0.01% |
| VTWO | Vanguard Russell 2000 ETF | | 82.66 | 82 | 1.29 | 1.29 | 1.92% |
| IWN | iShares Russell 2000 Value | | 155.65 | 100 | 0.93 | 0.93 | 0.21% |
| IWO | iShares Russell 2000 Growth | | 261.01 | 69 | 1.61 | 1.61 | 3.49% |
| IJS | iShares S&P Small-Cap 600 Value | | 99.75 | 69 | 1.04 | 1.04 | -3.22% |
| IJT | iShares S&P Small-Cap 600 Growth | | 129.12 | 90 | 1.06 | 1.06 | 3.18% |
| XSLV | PowerShares S&P SmallCap Low Volatil ETF | | 43.58 | 87 | 0.83 | 0.83 | -1.29% |
| SAA | ProShares Ultra SmallCap600 | | 24.11 | 82 | 2.20 | 2.2 | -3.37% |
| SDD | ProShares UltraShort SmallCap600 | | 18.42 | 10 | -2.26 | -2.26 | -0.04% |
| SBB | ProShares Short SmallCap600 | | 16.05 | 13 | -0.67 | -0.67 | 0.76% |
| SMLV | SPDR SSGA US Small Cap Low Volatil ETF | | 110.59 | 100 | 0.83 | 0.83 | -1.72% |
| 12Stocks.com: Charts, Trends, Fundamental Data and Performances of SmallCap Stocks | |
|
We now take in-depth look at all SmallCap stocks including charts, multi-period performances and overall trends (as measured by Smart Investing & Trading Score). One can sort SmallCap stocks (click link to choose) by Daily, Weekly and by Year-to-Date performances. Also, one can sort by size of the company or by market capitalization. |
| Select Your Default Chart Type: | |||||
| |||||
| Click on stock symbol or name for detailed view. Click on to add stock symbol to your watchlist and to view watchlist. Quick View: Move mouse or cursor over "Daily" to quickly view daily technical stock chart and over "Weekly" to view weekly technical stock chart. | |||||

 | CURV Torrid Holdings Inc. |
| Sector: Services & Goods | |
| SubSector: Apparel Retail | |
| MarketCap: 278 Millions | |
| Recent Price: 5.15 Smart Investing & Trading Score: 78 | |
| Day Percent Change: -1.72% Day Change: -0.09 | |
| Week Change: -1.72% Year-to-date Change: -12.0% | |
| CURV Links: Profile News Message Board | |
| Charts:- Daily , Weekly | |
| Add CURV to Watchlist: View: Get Complete CURV Trend Analysis ➞ | |
 | CLDT Chatham Lodging Trust |
| Sector: Financials | |
| SubSector: REIT - Hotel/Motel | |
| MarketCap: 274.734 Millions | |
| Recent Price: 9.02 Smart Investing & Trading Score: 10 | |
| Day Percent Change: -1.74% Day Change: -0.16 | |
| Week Change: -1.74% Year-to-date Change: -15.9% | |
| CLDT Links: Profile News Message Board | |
| Charts:- Daily , Weekly | |
| Add CLDT to Watchlist: View: Get Complete CLDT Trend Analysis ➞ | |
 | PKOH Park-Ohio Holdings Corp. |
| Sector: Services & Goods | |
| SubSector: Industrial Equipment Wholesale | |
| MarketCap: 214.358 Millions | |
| Recent Price: 25.60 Smart Investing & Trading Score: 32 | |
| Day Percent Change: -1.80% Day Change: -0.47 | |
| Week Change: -1.8% Year-to-date Change: -5.0% | |
| PKOH Links: Profile News Message Board | |
| Charts:- Daily , Weekly | |
| Add PKOH to Watchlist: View: Get Complete PKOH Trend Analysis ➞ | |
 | GNK Genco Shipping & Trading Limited |
| Sector: Transports | |
| SubSector: Shipping | |
| MarketCap: 251.614 Millions | |
| Recent Price: 21.85 Smart Investing & Trading Score: 66 | |
| Day Percent Change: -1.84% Day Change: -0.41 | |
| Week Change: -1.84% Year-to-date Change: 31.7% | |
| GNK Links: Profile News Message Board | |
| Charts:- Daily , Weekly | |
| Add GNK to Watchlist: View: Get Complete GNK Trend Analysis ➞ | |
 | VCEL Vericel Corporation |
| Sector: Health Care | |
| SubSector: Biotechnology | |
| MarketCap: 391.885 Millions | |
| Recent Price: 46.94 Smart Investing & Trading Score: 49 | |
| Day Percent Change: -1.86% Day Change: -0.89 | |
| Week Change: -1.86% Year-to-date Change: 31.8% | |
| VCEL Links: Profile News Message Board | |
| Charts:- Daily , Weekly | |
| Add VCEL to Watchlist: View: Get Complete VCEL Trend Analysis ➞ | |
 | RBBN Ribbon Communications Inc. |
| Sector: Technology | |
| SubSector: Telecom Services - Domestic | |
| MarketCap: 284.577 Millions | |
| Recent Price: 3.11 Smart Investing & Trading Score: 51 | |
| Day Percent Change: -1.89% Day Change: -0.06 | |
| Week Change: -1.89% Year-to-date Change: 7.2% | |
| RBBN Links: Profile News Message Board | |
| Charts:- Daily , Weekly | |
| Add RBBN to Watchlist: View: Get Complete RBBN Trend Analysis ➞ | |
 | SRRK Scholar Rock Holding Corporation |
| Sector: Health Care | |
| SubSector: Biotechnology | |
| MarketCap: 441.385 Millions | |
| Recent Price: 15.06 Smart Investing & Trading Score: 40 | |
| Day Percent Change: -1.89% Day Change: -0.29 | |
| Week Change: -1.89% Year-to-date Change: -19.9% | |
| SRRK Links: Profile News Message Board | |
| Charts:- Daily , Weekly | |
| Add SRRK to Watchlist: View: Get Complete SRRK Trend Analysis ➞ | |
 | RSVR Reservoir Media, Inc. |
| Sector: Services & Goods | |
| SubSector: Entertainment | |
| MarketCap: 389 Millions | |
| Recent Price: 8.52 Smart Investing & Trading Score: 46 | |
| Day Percent Change: -1.90% Day Change: -0.17 | |
| Week Change: -1.9% Year-to-date Change: 19.7% | |
| RSVR Links: Profile News Message Board | |
| Charts:- Daily , Weekly | |
| Add RSVR to Watchlist: View: Get Complete RSVR Trend Analysis ➞ | |
 | LCNB LCNB Corp. |
| Sector: Financials | |
| SubSector: Regional - Mid-Atlantic Banks | |
| MarketCap: 176.759 Millions | |
| Recent Price: 14.35 Smart Investing & Trading Score: 44 | |
| Day Percent Change: -1.91% Day Change: -0.28 | |
| Week Change: -1.91% Year-to-date Change: -9.0% | |
| LCNB Links: Profile News Message Board | |
| Charts:- Daily , Weekly | |
| Add LCNB to Watchlist: View: Get Complete LCNB Trend Analysis ➞ | |
 | KOP Koppers Holdings Inc. |
| Sector: Materials | |
| SubSector: Specialty Chemicals | |
| MarketCap: 232.657 Millions | |
| Recent Price: 43.12 Smart Investing & Trading Score: 0 | |
| Day Percent Change: -1.93% Day Change: -0.85 | |
| Week Change: -1.93% Year-to-date Change: -15.8% | |
| KOP Links: Profile News Message Board | |
| Charts:- Daily , Weekly | |
| Add KOP to Watchlist: View: Get Complete KOP Trend Analysis ➞ | |
 | WISH ContextLogic Inc. |
| Sector: Services & Goods | |
| SubSector: Internet Retail | |
| MarketCap: 165 Millions | |
| Recent Price: 5.21 Smart Investing & Trading Score: 5 | |
| Day Percent Change: -1.98% Day Change: -0.10 | |
| Week Change: -1.98% Year-to-date Change: -12.5% | |
| WISH Links: Profile News Message Board | |
| Charts:- Daily , Weekly | |
| Add WISH to Watchlist: View: Get Complete WISH Trend Analysis ➞ | |
 | MRNS Marinus Pharmaceuticals, Inc. |
| Sector: Health Care | |
| SubSector: Biotechnology | |
| MarketCap: 222.885 Millions | |
| Recent Price: 1.48 Smart Investing & Trading Score: 35 | |
| Day Percent Change: -1.99% Day Change: -0.03 | |
| Week Change: -1.99% Year-to-date Change: -86.4% | |
| MRNS Links: Profile News Message Board | |
| Charts:- Daily , Weekly | |
| Add MRNS to Watchlist: View: Get Complete MRNS Trend Analysis ➞ | |
 | AXGN AxoGen, Inc. |
| Sector: Health Care | |
| SubSector: Medical Appliances & Equipment | |
| MarketCap: 349.28 Millions | |
| Recent Price: 5.67 Smart Investing & Trading Score: 0 | |
| Day Percent Change: -2.07% Day Change: -0.12 | |
| Week Change: -2.07% Year-to-date Change: -17.0% | |
| AXGN Links: Profile News Message Board | |
| Charts:- Daily , Weekly | |
| Add AXGN to Watchlist: View: Get Complete AXGN Trend Analysis ➞ | |
 | NC NACCO Industries, Inc. |
| Sector: Consumer Staples | |
| SubSector: Home Furnishings & Fixtures | |
| MarketCap: 179.835 Millions | |
| Recent Price: 32.53 Smart Investing & Trading Score: 74 | |
| Day Percent Change: -2.08% Day Change: -0.69 | |
| Week Change: -2.08% Year-to-date Change: -10.9% | |
| NC Links: Profile News Message Board | |
| Charts:- Daily , Weekly | |
| Add NC to Watchlist: View: Get Complete NC Trend Analysis ➞ | |
 | LPG Dorian LPG Ltd. |
| Sector: Transports | |
| SubSector: Shipping | |
| MarketCap: 426.414 Millions | |
| Recent Price: 42.00 Smart Investing & Trading Score: 73 | |
| Day Percent Change: -2.08% Day Change: -0.89 | |
| Week Change: -2.08% Year-to-date Change: -4.3% | |
| LPG Links: Profile News Message Board | |
| Charts:- Daily , Weekly | |
| Add LPG to Watchlist: View: Get Complete LPG Trend Analysis ➞ | |
 | NKSH National Bankshares, Inc. |
| Sector: Financials | |
| SubSector: Regional - Mid-Atlantic Banks | |
| MarketCap: 209.759 Millions | |
| Recent Price: 26.99 Smart Investing & Trading Score: 10 | |
| Day Percent Change: -2.10% Day Change: -0.58 | |
| Week Change: -2.1% Year-to-date Change: -16.6% | |
| NKSH Links: Profile News Message Board | |
| Charts:- Daily , Weekly | |
| Add NKSH to Watchlist: View: Get Complete NKSH Trend Analysis ➞ | |
 | EXTR Extreme Networks, Inc. |
| Sector: Technology | |
| SubSector: Communication Equipment | |
| MarketCap: 339.939 Millions | |
| Recent Price: 10.96 Smart Investing & Trading Score: 35 | |
| Day Percent Change: -2.14% Day Change: -0.24 | |
| Week Change: -2.14% Year-to-date Change: -37.9% | |
| EXTR Links: Profile News Message Board | |
| Charts:- Daily , Weekly | |
| Add EXTR to Watchlist: View: Get Complete EXTR Trend Analysis ➞ | |
 | HSHP Himalaya Shipping Ltd. |
| Sector: Industrials | |
| SubSector: Marine Shipping | |
| MarketCap: 179 Millions | |
| Recent Price: 8.24 Smart Investing & Trading Score: 73 | |
| Day Percent Change: -2.14% Day Change: -0.18 | |
| Week Change: -2.14% Year-to-date Change: 22.1% | |
| HSHP Links: Profile News Message Board | |
| Charts:- Daily , Weekly | |
| Add HSHP to Watchlist: View: Get Complete HSHP Trend Analysis ➞ | |
 | UFPT UFP Technologies, Inc. |
| Sector: Consumer Staples | |
| SubSector: Packaging & Containers | |
| MarketCap: 284.053 Millions | |
| Recent Price: 256.49 Smart Investing & Trading Score: 100 | |
| Day Percent Change: -2.16% Day Change: -5.65 | |
| Week Change: -2.16% Year-to-date Change: 49.1% | |
| UFPT Links: Profile News Message Board | |
| Charts:- Daily , Weekly | |
| Add UFPT to Watchlist: View: Get Complete UFPT Trend Analysis ➞ | |
 | FPI Farmland Partners Inc. |
| Sector: Financials | |
| SubSector: REIT - Diversified | |
| MarketCap: 182.653 Millions | |
| Recent Price: 10.96 Smart Investing & Trading Score: 42 | |
| Day Percent Change: -2.23% Day Change: -0.25 | |
| Week Change: -2.23% Year-to-date Change: -12.2% | |
| FPI Links: Profile News Message Board | |
| Charts:- Daily , Weekly | |
| Add FPI to Watchlist: View: Get Complete FPI Trend Analysis ➞ | |
 | FFWM First Foundation Inc. |
| Sector: Financials | |
| SubSector: Regional - Midwest Banks | |
| MarketCap: 457.17 Millions | |
| Recent Price: 5.68 Smart Investing & Trading Score: 42 | |
| Day Percent Change: -2.24% Day Change: -0.13 | |
| Week Change: -2.24% Year-to-date Change: -41.3% | |
| FFWM Links: Profile News Message Board | |
| Charts:- Daily , Weekly | |
| Add FFWM to Watchlist: View: Get Complete FFWM Trend Analysis ➞ | |
 | ZYXI Zynex, Inc. |
| Sector: Health Care | |
| SubSector: Medical Appliances & Equipment | |
| MarketCap: 388.58 Millions | |
| Recent Price: 10.75 Smart Investing & Trading Score: 0 | |
| Day Percent Change: -2.27% Day Change: -0.25 | |
| Week Change: -2.27% Year-to-date Change: -1.3% | |
| ZYXI Links: Profile News Message Board | |
| Charts:- Daily , Weekly | |
| Add ZYXI to Watchlist: View: Get Complete ZYXI Trend Analysis ➞ | |
 | BTAI BioXcel Therapeutics, Inc. |
| Sector: Health Care | |
| SubSector: Biotechnology | |
| MarketCap: 487.485 Millions | |
| Recent Price: 2.51 Smart Investing & Trading Score: 10 | |
| Day Percent Change: -2.33% Day Change: -0.06 | |
| Week Change: -2.33% Year-to-date Change: -14.9% | |
| BTAI Links: Profile News Message Board | |
| Charts:- Daily , Weekly | |
| Add BTAI to Watchlist: View: Get Complete BTAI Trend Analysis ➞ | |
 | RMNI Rimini Street, Inc. |
| Sector: Technology | |
| SubSector: Application Software | |
| MarketCap: 288.762 Millions | |
| Recent Price: 2.49 Smart Investing & Trading Score: 0 | |
| Day Percent Change: -2.35% Day Change: -0.06 | |
| Week Change: -2.35% Year-to-date Change: -23.9% | |
| RMNI Links: Profile News Message Board | |
| Charts:- Daily , Weekly | |
| Add RMNI to Watchlist: View: Get Complete RMNI Trend Analysis ➞ | |
 | AURA Aura Biosciences, Inc. |
| Sector: Health Care | |
| SubSector: Biotechnology | |
| MarketCap: 469 Millions | |
| Recent Price: 7.70 Smart Investing & Trading Score: 45 | |
| Day Percent Change: -2.35% Day Change: -0.18 | |
| Week Change: -2.35% Year-to-date Change: -13.1% | |
| AURA Links: Profile News Message Board | |
| Charts:- Daily , Weekly | |
| Add AURA to Watchlist: View: Get Complete AURA Trend Analysis ➞ | |
| For tabular summary view of above stock list: Summary View ➞ 0 - 25 , 25 - 50 , 50 - 75 , 75 - 100 , 100 - 125 , 125 - 150 , 150 - 175 , 175 - 200 , 200 - 225 , 225 - 250 , 250 - 275 , 275 - 300 , 300 - 325 , 325 - 350 , 350 - 375 , 375 - 400 , 400 - 425 , 425 - 450 , 450 - 475 , 475 - 500 , 500 - 525 | ||
| Click To Change The Sort Order: By Market Cap or Company Size Performance: Year-to-date, Week and Day | |
| Select Chart Type: | ||
| Too many stocks? View smallcap stocks filtered by marketcap & sector |
| Marketcap: All SmallCap Stocks (default-no microcap), Large, Mid-Range, Small & MicroCap |
| Sector: Tech, Finance, Energy, Staples, Retail, Industrial, Materials, Utilities & Medical |
|
Best Stocks Today 12Stocks.com |
© 2024 12Stocks.com Terms & Conditions Privacy Contact Us
All Information Provided Only For Education And Not To Be Used For Investing or Trading. See Terms & Conditions


One More Thing ... Get Best Stocks Delivered Daily!
Never Ever Miss A Move With Our Top Ten Stocks Lists
Find Best Stocks In Any Market - Bull or Bear Market
Take A Peek At Our Top Ten Stocks Lists: Daily, Weekly, Year-to-Date & Top Trends
Find Best Stocks In Any Market - Bull or Bear Market
Take A Peek At Our Top Ten Stocks Lists: Daily, Weekly, Year-to-Date & Top Trends
Smallcap Stocks With Best Up Trends [0-bearish to 100-bullish]: Perficient [100], Outset Medical[100], Lineage Cell[100], Assertio [100], Dakota Gold[100], Loln Educational[100], Twist Bioscience[100], PMV [100], SilverBow Resources[100], Phathom [100], Alexander s[100]
Best Smallcap Stocks Year-to-Date:
CareMax [511.34%], Janux [479.25%], Viking [320.26%], Alpine Immune[239.29%], Longboard [237.32%], Bakkt [197.53%], Vera [194.15%], Super Micro[192.11%], Avidity Biosciences[189.6%], Cullinan Oncology[178.76%], Y-mAbs [152.79%] Best Smallcap Stocks This Week:
Perficient [52.28%], P3 Health[25.16%], Outset Medical[23%], Lineage Cell[22.64%], Workhorse Group[20.5%], SoundHound AI[19.54%], DASAN Zhone[19.25%], BioCryst [18.43%], Marathon Patent[17.98%], Assertio [16.99%], Aceto [16.55%] Best Smallcap Stocks Daily:
Perficient [52.28%], P3 Health[25.16%], Outset Medical[23.00%], Lineage Cell[22.64%], Workhorse Group[20.50%], SoundHound AI[19.54%], DASAN Zhone[19.25%], BioCryst [18.43%], Marathon Patent[17.98%], Assertio [16.99%], Aceto [16.55%]