
 Login Sign Up


| |||||
 |  | ||||

| 12Stocks.com Market Intelligence |
Best Tech Stocks
| In a hurry? Tech Stocks Lists: Performance & Trends, Stock Charts, FANG Stocks
Sort Tech stocks: Daily, Weekly, Year-to-Date, Market Cap & Trends. Filter Tech stocks list by size:All Tech Large Mid-Range Small and MicroCap |
| 12Stocks.com Tech Stocks Performances & Trends Daily | |||||||||
|
|  The overall Smart Investing & Trading Score is 100 (0-bearish to 100-bullish) which puts Technology sector in short term bullish trend. The Smart Investing & Trading Score from previous trading session is 90 and an improvement of trend continues.
| ||||||||
Here are the Smart Investing & Trading Scores of the most requested Technology stocks at 12Stocks.com (click stock name for detailed review):
|


| 12Stocks.com: Investing in Technology sector with Stocks | |
|
The following table helps investors and traders sort through current performance and trends (as measured by Smart Investing & Trading Score) of various
stocks in the Tech sector. Quick View: Move mouse or cursor over stock symbol (ticker) to view short-term technical chart and over stock name to view long term chart. Click on  to add stock symbol to your watchlist and to add stock symbol to your watchlist and  to view watchlist. Click on any ticker or stock name for detailed market intelligence report for that stock. to view watchlist. Click on any ticker or stock name for detailed market intelligence report for that stock. |
12Stocks.com Performance of Stocks in Tech Sector
| Ticker | Stock Name | Watchlist | Category | Recent Price | Smart Investing & Trading Score | Change % | Weekly Change% |
| FSLR | First Solar |   | Solar | 232.13 | 100 | 3.25% | 5.91% |
| COHR | Coherent Corp | | Instruments | 112.79 | 90 | -1.62% | 5.89% |
| YHOO | Yahoo! | | Internet | 24.70 | 90 | 1.44% | 5.78% |
| ROKU | Roku | | Entertainment | 103.84 | 100 | 0.26% | 5.73% |
| OKTA | Okta | | Software - Infrastructure | 94.92 | 80 | 3.52% | 5.62% |
| AMD | Advanced Micro | | Semiconductors | 169.73 | 90 | 3.49% | 5.50% |
| BIDU | Baidu | | Internet Content & Information | 140.23 | 100 | 2.03% | 5.50% |
| SAIL | Sailpoint | | Software - Infrastructure | 23.36 | 100 | 2.48% | 5.35% |
| TTWO | Take-Two Interactive | | Electronic Gaming & Multimedia | 256.93 | 50 | 0.60% | 5.25% |
| CACI | Caci | | IT | 522.90 | 100 | 1.50% | 5.16% |
| CLS | Celestica | | Electronic Components | 250.91 | 90 | -0.31% | 4.35% |
| CRWD | Crowdstrike | | Software - Infrastructure | 496.80 | 80 | -0.63% | 4.30% |
| PANW | Palo Alto | | Software - Infrastructure | 209.26 | 100 | 1.19% | 4.27% |
| CYBR | CyberArk Software | | Software - Infrastructure | 495.01 | 100 | 0.99% | 4.17% |
| PLTR | Palantir | | Software - Infrastructure | 187.05 | 90 | 1.14% | 4.17% |
| PSTG | Pure Storage | | Computer Hardware | 88.25 | 80 | 2.99% | 4.01% |
| DUOL | Duolingo | | Software - | 313.09 | 30 | 3.09% | 3.96% |
| DT | Dynatrace | | Software - | 49.88 | 70 | 3.25% | 3.64% |
| FIS | Fidelity National | | IT | 66.45 | 60 | -0.09% | 3.62% |
| LOGI | Logitech | | Computer Hardware | 112.65 | 80 | 2.57% | 3.55% |
| ENTG | Entegris | | Semiconductor | 96.76 | 100 | 2.98% | 3.50% |
| MDB | MongoDB | | Software - Infrastructure | 326.29 | 80 | 1.48% | 3.49% |
| FTV | Fortive Corp | | Instruments | 49.78 | 100 | -0.60% | 3.36% |
| GLW | Corning | | Electronic Components | 82.52 | 80 | -0.72% | 3.27% |
| TDY | Teledyne | | Instruments | 582.17 | 90 | 1.23% | 3.24% |
| For chart view version of above stock list: Chart View ➞ 0 - 25 , 25 - 50 , 50 - 75 , 75 - 100 , 100 - 125 , 125 - 150 , 150 - 175 , 175 - 200 , 200 - 225 , 225 - 250 , 250 - 275 | ||
 | Click To Change The Sort Order: By Market Cap or Company Size Performance: Year-to-date, Week and Day |  |
|
Get the most comprehensive stock market coverage daily at 12Stocks.com ➞ Best Stocks Today ➞ Best Stocks Weekly ➞ Best Stocks Year-to-Date ➞ Best Stocks Trends ➞  Best Stocks Today 12Stocks.com Best Nasdaq Stocks ➞ Best S&P 500 Stocks ➞ Best Tech Stocks ➞ Best Biotech Stocks ➞ |
| Detailed Overview of Tech Stocks |
| Tech Technical Overview, Leaders & Laggards, Top Tech ETF Funds & Detailed Tech Stocks List, Charts, Trends & More |
| Tech Sector: Technical Analysis, Trends & YTD Performance | |
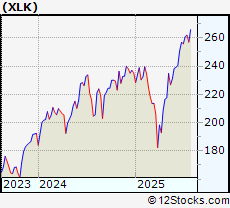
| Technology sector is composed of stocks
from semiconductors, software, web, social media
and services subsectors. Technology sector, as represented by XLK, an exchange-traded fund [ETF] that holds basket of tech stocks (e.g, Intel, Google) is up by 23.7823% and is currently outperforming the overall market by 9.0244% year-to-date. Below is a quick view of technical charts and trends: |
|
 XLK Weekly Chart |
|
| Long Term Trend: Very Good | |
| Medium Term Trend: Good | |
 XLK Daily Chart |
|
| Short Term Trend: Very Good | |
| Overall Trend Score: 100 | |
| YTD Performance: 23.7823% | |
| **Trend Scores & Views Are Only For Educational Purposes And Not For Investing | |
| 12Stocks.com: Top Performing Technology Sector Stocks | ||||||||||||||||||||||||||||||||||||||||||||||||
 The top performing Technology sector stocks year to date are
Now, more recently, over last week, the top performing Technology sector stocks on the move are


|
||||||||||||||||||||||||||||||||||||||||||||||||
| 12Stocks.com: Investing in Tech Sector using Exchange Traded Funds | |
|
The following table shows list of key exchange traded funds (ETF) that
help investors track Tech Index. For detailed view, check out our ETF Funds section of our website. Quick View: Move mouse or cursor over ETF symbol (ticker) to view short-term technical chart and over ETF name to view long term chart. Click on ticker or stock name for detailed view. Click on to add stock symbol to your watchlist and to view watchlist. |
12Stocks.com List of ETFs that track Tech Index
| Ticker | ETF Name | Watchlist | Recent Price | Smart Investing & Trading Score | Change % | Week % | Year-to-date % |
| IGN | Tech-Multimd Ntwk | | 53.86 | 40 | 0.918119 | -20.6435 | 0% |
| 12Stocks.com: Charts, Trends, Fundamental Data and Performances of Tech Stocks | |
|
We now take in-depth look at all Tech stocks including charts, multi-period performances and overall trends (as measured by Smart Investing & Trading Score). One can sort Tech stocks (click link to choose) by Daily, Weekly and by Year-to-Date performances. Also, one can sort by size of the company or by market capitalization. |
| Select Your Default Chart Type: | |||||
| |||||
| Click on stock symbol or name for detailed view. Click on to add stock symbol to your watchlist and to view watchlist. Quick View: Move mouse or cursor over "Daily" to quickly view daily technical stock chart and over "Weekly" to view weekly technical stock chart. | |||||


 | FSLR First Solar Inc |
| Sector: Technology | |
| SubSector: Solar | |
| MarketCap: 22000.8 Millions | |
| Recent Price: 232.13 Smart Investing & Trading Score: 100 | |
| Day Percent Change: 3.25149% Day Change: 6.23 | |
| Week Change: 5.91322% Year-to-date Change: 24.5% | |
| FSLR Links: Profile News Message Board | |
| Charts:- Daily , Weekly | |
| Add FSLR to Watchlist: View: Get Complete FSLR Trend Analysis ➞ | |
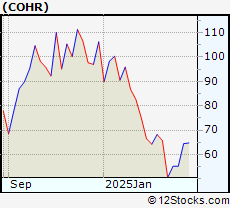 | COHR Coherent Corp |
| Sector: Technology | |
| SubSector: Scientific & Technical Instruments | |
| MarketCap: 15244 Millions | |
| Recent Price: 112.79 Smart Investing & Trading Score: 90 | |
| Day Percent Change: -1.62233% Day Change: -0.97 | |
| Week Change: 5.88622% Year-to-date Change: 12.1% | |
| COHR Links: Profile News Message Board | |
| Charts:- Daily , Weekly | |
| Add COHR to Watchlist: View: Get Complete COHR Trend Analysis ➞ | |
 | YHOO Yahoo! Inc. |
| Sector: Technology | |
| SubSector: Internet Information Providers | |
| MarketCap: 44237 Millions | |
| Recent Price: 24.70 Smart Investing & Trading Score: 90 | |
| Day Percent Change: 1.43737% Day Change: -9999 | |
| Week Change: 5.78158% Year-to-date Change: 0.0% | |
| YHOO Links: Profile News Message Board | |
| Charts:- Daily , Weekly | |
| Add YHOO to Watchlist: View: Get Complete YHOO Trend Analysis ➞ | |
 | ROKU Roku Inc |
| Sector: Technology | |
| SubSector: Entertainment | |
| MarketCap: 14031.8 Millions | |
| Recent Price: 103.84 Smart Investing & Trading Score: 100 | |
| Day Percent Change: 0.260693% Day Change: 1.57 | |
| Week Change: 5.73261% Year-to-date Change: 39.4% | |
| ROKU Links: Profile News Message Board | |
| Charts:- Daily , Weekly | |
| Add ROKU to Watchlist: View: Get Complete ROKU Trend Analysis ➞ | |
 | OKTA Okta Inc |
| Sector: Technology | |
| SubSector: Software - Infrastructure | |
| MarketCap: 16134.2 Millions | |
| Recent Price: 94.92 Smart Investing & Trading Score: 80 | |
| Day Percent Change: 3.52274% Day Change: 3.18 | |
| Week Change: 5.61923% Year-to-date Change: 20.4% | |
| OKTA Links: Profile News Message Board | |
| Charts:- Daily , Weekly | |
| Add OKTA to Watchlist: View: Get Complete OKTA Trend Analysis ➞ | |
 | AMD Advanced Micro Devices Inc |
| Sector: Technology | |
| SubSector: Semiconductors | |
| MarketCap: 245277 Millions | |
| Recent Price: 169.73 Smart Investing & Trading Score: 90 | |
| Day Percent Change: 3.48759% Day Change: 6.03 | |
| Week Change: 5.50099% Year-to-date Change: 40.7% | |
| AMD Links: Profile News Message Board | |
| Charts:- Daily , Weekly | |
| Add AMD to Watchlist: View: Get Complete AMD Trend Analysis ➞ | |
 | BIDU Baidu Inc ADR |
| Sector: Technology | |
| SubSector: Internet Content & Information | |
| MarketCap: 28539.6 Millions | |
| Recent Price: 140.23 Smart Investing & Trading Score: 100 | |
| Day Percent Change: 2.02998% Day Change: 2.35 | |
| Week Change: 5.49955% Year-to-date Change: 69.6% | |
| BIDU Links: Profile News Message Board | |
| Charts:- Daily , Weekly | |
| Add BIDU to Watchlist: View: Get Complete BIDU Trend Analysis ➞ | |
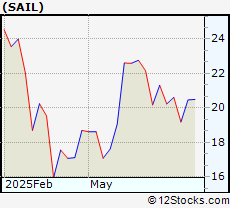 | SAIL Sailpoint Inc |
| Sector: Technology | |
| SubSector: Software - Infrastructure | |
| MarketCap: 12233.8 Millions | |
| Recent Price: 23.36 Smart Investing & Trading Score: 100 | |
| Day Percent Change: 2.47916% Day Change: -0.08 | |
| Week Change: 5.34506% Year-to-date Change: 6.2% | |
| SAIL Links: Profile News Message Board | |
| Charts:- Daily , Weekly | |
| Add SAIL to Watchlist: View: Get Complete SAIL Trend Analysis ➞ | |
 | TTWO Take-Two Interactive Software, Inc |
| Sector: Technology | |
| SubSector: Electronic Gaming & Multimedia | |
| MarketCap: 44213.8 Millions | |
| Recent Price: 256.93 Smart Investing & Trading Score: 50 | |
| Day Percent Change: 0.59906% Day Change: 1.39 | |
| Week Change: 5.24742% Year-to-date Change: 40.3% | |
| TTWO Links: Profile News Message Board | |
| Charts:- Daily , Weekly | |
| Add TTWO to Watchlist: View: Get Complete TTWO Trend Analysis ➞ | |
 | CACI Caci International Inc |
| Sector: Technology | |
| SubSector: Information Technology Services | |
| MarketCap: 10434.8 Millions | |
| Recent Price: 522.90 Smart Investing & Trading Score: 100 | |
| Day Percent Change: 1.50245% Day Change: 7.74 | |
| Week Change: 5.1626% Year-to-date Change: 27.2% | |
| CACI Links: Profile News Message Board | |
| Charts:- Daily , Weekly | |
| Add CACI to Watchlist: View: Get Complete CACI Trend Analysis ➞ | |
 | CLS Celestica, Inc |
| Sector: Technology | |
| SubSector: Electronic Components | |
| MarketCap: 27915.5 Millions | |
| Recent Price: 250.91 Smart Investing & Trading Score: 90 | |
| Day Percent Change: -0.309905% Day Change: 0.23 | |
| Week Change: 4.34584% Year-to-date Change: 169.6% | |
| CLS Links: Profile News Message Board | |
| Charts:- Daily , Weekly | |
| Add CLS to Watchlist: View: Get Complete CLS Trend Analysis ➞ | |
 | CRWD Crowdstrike Holdings Inc |
| Sector: Technology | |
| SubSector: Software - Infrastructure | |
| MarketCap: 104806 Millions | |
| Recent Price: 496.80 Smart Investing & Trading Score: 80 | |
| Day Percent Change: -0.632051% Day Change: -3.35 | |
| Week Change: 4.29744% Year-to-date Change: 43.0% | |
| CRWD Links: Profile News Message Board | |
| Charts:- Daily , Weekly | |
| Add CRWD to Watchlist: View: Get Complete CRWD Trend Analysis ➞ | |
 | PANW Palo Alto Networks Inc |
| Sector: Technology | |
| SubSector: Software - Infrastructure | |
| MarketCap: 130074 Millions | |
| Recent Price: 209.26 Smart Investing & Trading Score: 100 | |
| Day Percent Change: 1.18956% Day Change: 1.5 | |
| Week Change: 4.26507% Year-to-date Change: 15.8% | |
| PANW Links: Profile News Message Board | |
| Charts:- Daily , Weekly | |
| Add PANW to Watchlist: View: Get Complete PANW Trend Analysis ➞ | |
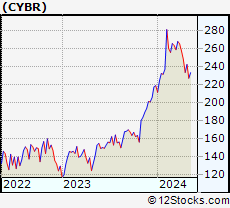 | CYBR CyberArk Software Ltd |
| Sector: Technology | |
| SubSector: Software - Infrastructure | |
| MarketCap: 23326.9 Millions | |
| Recent Price: 495.01 Smart Investing & Trading Score: 100 | |
| Day Percent Change: 0.987413% Day Change: -1.89 | |
| Week Change: 4.17096% Year-to-date Change: 47.5% | |
| CYBR Links: Profile News Message Board | |
| Charts:- Daily , Weekly | |
| Add CYBR to Watchlist: View: Get Complete CYBR Trend Analysis ➞ | |
 | PLTR Palantir Technologies Inc |
| Sector: Technology | |
| SubSector: Software - Infrastructure | |
| MarketCap: 363230 Millions | |
| Recent Price: 187.05 Smart Investing & Trading Score: 90 | |
| Day Percent Change: 1.13544% Day Change: 0.92 | |
| Week Change: 4.17131% Year-to-date Change: 148.8% | |
| PLTR Links: Profile News Message Board | |
| Charts:- Daily , Weekly | |
| Add PLTR to Watchlist: View: Get Complete PLTR Trend Analysis ➞ | |
 | PSTG Pure Storage Inc |
| Sector: Technology | |
| SubSector: Computer Hardware | |
| MarketCap: 25894.9 Millions | |
| Recent Price: 88.25 Smart Investing & Trading Score: 80 | |
| Day Percent Change: 2.98751% Day Change: 2.17 | |
| Week Change: 4.00707% Year-to-date Change: 41.2% | |
| PSTG Links: Profile News Message Board | |
| Charts:- Daily , Weekly | |
| Add PSTG to Watchlist: View: Get Complete PSTG Trend Analysis ➞ | |
 | DUOL Duolingo Inc |
| Sector: Technology | |
| SubSector: Software - Application | |
| MarketCap: 12425.9 Millions | |
| Recent Price: 313.09 Smart Investing & Trading Score: 30 | |
| Day Percent Change: 3.08508% Day Change: 6.64 | |
| Week Change: 3.9579% Year-to-date Change: -3.9% | |
| DUOL Links: Profile News Message Board | |
| Charts:- Daily , Weekly | |
| Add DUOL to Watchlist: View: Get Complete DUOL Trend Analysis ➞ | |
 | DT Dynatrace Inc |
| Sector: Technology | |
| SubSector: Software - Application | |
| MarketCap: 15075.3 Millions | |
| Recent Price: 49.88 Smart Investing & Trading Score: 70 | |
| Day Percent Change: 3.24984% Day Change: 1.6 | |
| Week Change: 3.63599% Year-to-date Change: -8.2% | |
| DT Links: Profile News Message Board | |
| Charts:- Daily , Weekly | |
| Add DT to Watchlist: View: Get Complete DT Trend Analysis ➞ | |
 | FIS Fidelity National Information Services, Inc |
| Sector: Technology | |
| SubSector: Information Technology Services | |
| MarketCap: 35908.3 Millions | |
| Recent Price: 66.45 Smart Investing & Trading Score: 60 | |
| Day Percent Change: -0.090212% Day Change: 0 | |
| Week Change: 3.61765% Year-to-date Change: -16.2% | |
| FIS Links: Profile News Message Board | |
| Charts:- Daily , Weekly | |
| Add FIS to Watchlist: View: Get Complete FIS Trend Analysis ➞ | |
 | LOGI Logitech International S.A |
| Sector: Technology | |
| SubSector: Computer Hardware | |
| MarketCap: 15824.7 Millions | |
| Recent Price: 112.65 Smart Investing & Trading Score: 80 | |
| Day Percent Change: 2.5676% Day Change: 2.58 | |
| Week Change: 3.54812% Year-to-date Change: 38.0% | |
| LOGI Links: Profile News Message Board | |
| Charts:- Daily , Weekly | |
| Add LOGI to Watchlist: View: Get Complete LOGI Trend Analysis ➞ | |
 | ENTG Entegris Inc |
| Sector: Technology | |
| SubSector: Semiconductor Equipment & Materials | |
| MarketCap: 12428.2 Millions | |
| Recent Price: 96.76 Smart Investing & Trading Score: 100 | |
| Day Percent Change: 2.97999% Day Change: 2.62 | |
| Week Change: 3.4977% Year-to-date Change: -0.1% | |
| ENTG Links: Profile News Message Board | |
| Charts:- Daily , Weekly | |
| Add ENTG to Watchlist: View: Get Complete ENTG Trend Analysis ➞ | |
 | MDB MongoDB Inc |
| Sector: Technology | |
| SubSector: Software - Infrastructure | |
| MarketCap: 26419.8 Millions | |
| Recent Price: 326.29 Smart Investing & Trading Score: 80 | |
| Day Percent Change: 1.48042% Day Change: 4.09 | |
| Week Change: 3.48557% Year-to-date Change: 33.4% | |
| MDB Links: Profile News Message Board | |
| Charts:- Daily , Weekly | |
| Add MDB to Watchlist: View: Get Complete MDB Trend Analysis ➞ | |
 | FTV Fortive Corp |
| Sector: Technology | |
| SubSector: Scientific & Technical Instruments | |
| MarketCap: 16196.2 Millions | |
| Recent Price: 49.78 Smart Investing & Trading Score: 100 | |
| Day Percent Change: -0.599042% Day Change: -0.11 | |
| Week Change: 3.36379% Year-to-date Change: -11.0% | |
| FTV Links: Profile News Message Board | |
| Charts:- Daily , Weekly | |
| Add FTV to Watchlist: View: Get Complete FTV Trend Analysis ➞ | |
 | GLW Corning, Inc |
| Sector: Technology | |
| SubSector: Electronic Components | |
| MarketCap: 60982.7 Millions | |
| Recent Price: 82.52 Smart Investing & Trading Score: 80 | |
| Day Percent Change: -0.721848% Day Change: -0.08 | |
| Week Change: 3.26617% Year-to-date Change: 78.7% | |
| GLW Links: Profile News Message Board | |
| Charts:- Daily , Weekly | |
| Add GLW to Watchlist: View: Get Complete GLW Trend Analysis ➞ | |
 | TDY Teledyne Technologies Inc |
| Sector: Technology | |
| SubSector: Scientific & Technical Instruments | |
| MarketCap: 25743.2 Millions | |
| Recent Price: 582.17 Smart Investing & Trading Score: 90 | |
| Day Percent Change: 1.23463% Day Change: 7.17 | |
| Week Change: 3.23627% Year-to-date Change: 27.1% | |
| TDY Links: Profile News Message Board | |
| Charts:- Daily , Weekly | |
| Add TDY to Watchlist: View: Get Complete TDY Trend Analysis ➞ | |
| For tabular summary view of above stock list: Summary View ➞ 0 - 25 , 25 - 50 , 50 - 75 , 75 - 100 , 100 - 125 , 125 - 150 , 150 - 175 , 175 - 200 , 200 - 225 , 225 - 250 , 250 - 275 | ||
| Click To Change The Sort Order: By Market Cap or Company Size Performance: Year-to-date, Week and Day | |
| Select Chart Type: | ||
|
Best Stocks Today 12Stocks.com |
© 2025 12Stocks.com Terms & Conditions Privacy Contact Us
All Information Provided Only For Education And Not To Be Used For Investing or Trading. See Terms & Conditions


One More Thing ... Get Best Stocks Delivered Daily!
Never Ever Miss A Move With Our Top Ten Stocks Lists
Find Best Stocks In Any Market - Bull or Bear Market
Take A Peek At Our Top Ten Stocks Lists: Daily, Weekly, Year-to-Date & Top Trends
Find Best Stocks In Any Market - Bull or Bear Market
Take A Peek At Our Top Ten Stocks Lists: Daily, Weekly, Year-to-Date & Top Trends
Technology Stocks With Best Up Trends [0-bearish to 100-bullish]: Sony [100], Bakkt [100], Rigetti Computing[100], Fair Isaac[100], Arqit Quantum[100], D-Wave Quantum[100], Navitas Semiconductor[100], Shoals [100], Vuzix [100], Arteris [100], Lantronix [100]
Best Technology Stocks Year-to-Date:
Xunlei [370.476%], Sify [315.033%], Wolfspeed [307.01%], Digital Turbine[265.057%], EchoStar Corp[247.253%], CuriosityStream [241.605%], Viasat [224.029%], Pagaya [222.638%], Oneconnect Financial[209.053%], D-Wave Quantum[203.954%], CommScope Holding[203.101%] Best Technology Stocks This Week:
GTT [443626%], Barracuda Networks[71050%], Mobile TeleSystems[10483.5%], Nam Tai[5033.33%], Ebix [4200.85%], Fang [4150%], NantHealth [3114.02%], Hemisphere Media[2981.82%], Yandex N.V[2935.27%], Wolfspeed [1961.98%], Castlight Health[1751.96%] Best Technology Stocks Daily:
Sony [194.565%], Bakkt [28.6091%], Rigetti Computing[18.4925%], Fair Isaac[17.979%], Arqit Quantum[17.9369%], Marti [17%], Latch [16.6667%], Oclaro [14.734%], D-Wave Quantum[13.968%], Arbe Robotics[13.0178%], Navitas Semiconductor[12.3288%]