
 Login Sign Up


| |||||
 |  | ||||

| 12Stocks.com Market Intelligence |
Best Tech Stocks
| In a hurry? Tech Stocks Lists: Performance & Trends, Stock Charts, FANG Stocks
Sort Tech stocks: Daily, Weekly, Year-to-Date, Market Cap & Trends. Filter Tech stocks list by size:All Tech Large Mid-Range Small and MicroCap |
| 12Stocks.com Tech Stocks Performances & Trends Daily | |||||||||
|
|  The overall Smart Investing & Trading Score is 100 (0-bearish to 100-bullish) which puts Technology sector in short term bullish trend. The Smart Investing & Trading Score from previous trading session is 90 and an improvement of trend continues.
| ||||||||
Here are the Smart Investing & Trading Scores of the most requested Technology stocks at 12Stocks.com (click stock name for detailed review):
|


| 12Stocks.com: Investing in Technology sector with Stocks | |
|
The following table helps investors and traders sort through current performance and trends (as measured by Smart Investing & Trading Score) of various
stocks in the Tech sector. Quick View: Move mouse or cursor over stock symbol (ticker) to view short-term technical chart and over stock name to view long term chart. Click on  to add stock symbol to your watchlist and to add stock symbol to your watchlist and  to view watchlist. Click on any ticker or stock name for detailed market intelligence report for that stock. to view watchlist. Click on any ticker or stock name for detailed market intelligence report for that stock. |
12Stocks.com Performance of Stocks in Tech Sector
| Ticker | Stock Name | Watchlist | Category | Recent Price | Smart Investing & Trading Score | Change % | YTD Change% |
| ANET | Arista Networks |   | Computer Hardware | 144.46 | 60 | -3.22% | 29.22% |
| QCOM | Qualcomm | | Semiconductors | 168.84 | 90 | 1.41% | 11.15% |
| TXN | Texas | | Semiconductors | 182.30 | 30 | 1.06% | -0.21% |
| APP | Applovin Corp | | Advertising Agencies | 683.64 | 60 | -2.90% | 100.02% |
| ACN | Accenture | | IT | 244.34 | 40 | 0.26% | -28.95% |
| CHL | China Mobile | | Wireless | 170.03 | 60 | 0.57% | 0.00% |
| ADBE | Adobe | | Software - | 351.55 | 50 | 2.28% | -20.28% |
| MU | Micron | | Semiconductors | 183.74 | 100 | 0.87% | 110.87% |
| ARM | Arm | | Semiconductors | 151.26 | 30 | 0.59% | -5.20% |
| SPOT | Spotify | | Internet Content & Information | 707.30 | 20 | 0.94% | 54.50% |
| APH | Amphenol Corp | | Electronic Components | 123.58 | 80 | -0.87% | 79.86% |
| LRCX | Lam Research | | Semiconductor | 146.95 | 100 | 2.91% | 103.98% |
| PANW | Palo Alto | | Software - Infrastructure | 209.26 | 100 | 1.19% | 15.78% |
| AMAT | Applied Materials | | Semiconductor | 223.60 | 100 | 2.69% | 37.15% |
| CMCSA | Comcast Corp | | Telecom | 30.40 | 0 | -1.75% | -16.58% |
| ADI | Analog Devices | | Semiconductors | 241.67 | 10 | 1.00% | 15.37% |
| ADP | Automatic Data | | Software - | 289.83 | 0 | -0.61% | 1.10% |
| KLAC | KLA Corp | | Semiconductor | 1139.26 | 100 | 0.92% | 79.79% |
| SNPS | Synopsys | | Software - Infrastructure | 471.08 | 20 | -3.62% | -2.42% |
| INTC | Intel Corp | | Semiconductors | 37.30 | 100 | 3.78% | 84.47% |
| CRWD | Crowdstrike | | Software - Infrastructure | 496.80 | 80 | -0.63% | 43.03% |
| CDNS | Cadence Design | | Software - | 347.24 | 30 | -1.34% | 16.66% |
| MSTR | Strategy | | Software - | 352.33 | 70 | 4.11% | 17.44% |
| DCM | NTT DOCOMO | | Communication | 4.16 | 10 | -0.72% | 0.00% |
| NTT | Nippon Telegraph | | Telecom | 9.25 | 10 | 0.00% | 0.00% |
| For chart view version of above stock list: Chart View ➞ 0 - 25 , 25 - 50 , 50 - 75 , 75 - 100 , 100 - 125 , 125 - 150 , 150 - 175 , 175 - 200 , 200 - 225 , 225 - 250 , 250 - 275 | ||
 | Click To Change The Sort Order: By Market Cap or Company Size Performance: Year-to-date, Week and Day |  |
|
Get the most comprehensive stock market coverage daily at 12Stocks.com ➞ Best Stocks Today ➞ Best Stocks Weekly ➞ Best Stocks Year-to-Date ➞ Best Stocks Trends ➞  Best Stocks Today 12Stocks.com Best Nasdaq Stocks ➞ Best S&P 500 Stocks ➞ Best Tech Stocks ➞ Best Biotech Stocks ➞ |
| Detailed Overview of Tech Stocks |
| Tech Technical Overview, Leaders & Laggards, Top Tech ETF Funds & Detailed Tech Stocks List, Charts, Trends & More |
| Tech Sector: Technical Analysis, Trends & YTD Performance | |
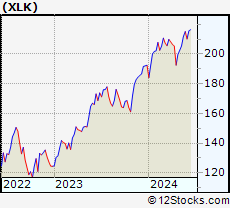
| Technology sector is composed of stocks
from semiconductors, software, web, social media
and services subsectors. Technology sector, as represented by XLK, an exchange-traded fund [ETF] that holds basket of tech stocks (e.g, Intel, Google) is up by 23.7823% and is currently outperforming the overall market by 9.0244% year-to-date. Below is a quick view of technical charts and trends: |
|
 XLK Weekly Chart |
|
| Long Term Trend: Very Good | |
| Medium Term Trend: Good | |
 XLK Daily Chart |
|
| Short Term Trend: Very Good | |
| Overall Trend Score: 100 | |
| YTD Performance: 23.7823% | |
| **Trend Scores & Views Are Only For Educational Purposes And Not For Investing | |
| 12Stocks.com: Top Performing Technology Sector Stocks | ||||||||||||||||||||||||||||||||||||||||||||||||
 The top performing Technology sector stocks year to date are
Now, more recently, over last week, the top performing Technology sector stocks on the move are


|
||||||||||||||||||||||||||||||||||||||||||||||||
| 12Stocks.com: Investing in Tech Sector using Exchange Traded Funds | |
|
The following table shows list of key exchange traded funds (ETF) that
help investors track Tech Index. For detailed view, check out our ETF Funds section of our website. Quick View: Move mouse or cursor over ETF symbol (ticker) to view short-term technical chart and over ETF name to view long term chart. Click on ticker or stock name for detailed view. Click on to add stock symbol to your watchlist and to view watchlist. |
12Stocks.com List of ETFs that track Tech Index
| Ticker | ETF Name | Watchlist | Recent Price | Smart Investing & Trading Score | Change % | Week % | Year-to-date % |
| IGN | Tech-Multimd Ntwk | | 53.86 | 40 | 0.918119 | -20.6435 | 0% |
| 12Stocks.com: Charts, Trends, Fundamental Data and Performances of Tech Stocks | |
|
We now take in-depth look at all Tech stocks including charts, multi-period performances and overall trends (as measured by Smart Investing & Trading Score). One can sort Tech stocks (click link to choose) by Daily, Weekly and by Year-to-Date performances. Also, one can sort by size of the company or by market capitalization. |
| Select Your Default Chart Type: | |||||
| |||||
| Click on stock symbol or name for detailed view. Click on to add stock symbol to your watchlist and to view watchlist. Quick View: Move mouse or cursor over "Daily" to quickly view daily technical stock chart and over "Weekly" to view weekly technical stock chart. | |||||


 | ANET Arista Networks Inc |
| Sector: Technology | |
| SubSector: Computer Hardware | |
| MarketCap: 179543 Millions | |
| Recent Price: 144.46 Smart Investing & Trading Score: 60 | |
| Day Percent Change: -3.22235% Day Change: -4.88 | |
| Week Change: 1.27594% Year-to-date Change: 29.2% | |
| ANET Links: Profile News Message Board | |
| Charts:- Daily , Weekly | |
| Add ANET to Watchlist: View: Get Complete ANET Trend Analysis ➞ | |
 | QCOM Qualcomm, Inc |
| Sector: Technology | |
| SubSector: Semiconductors | |
| MarketCap: 172467 Millions | |
| Recent Price: 168.84 Smart Investing & Trading Score: 90 | |
| Day Percent Change: 1.4145% Day Change: 2.39 | |
| Week Change: -2.71103% Year-to-date Change: 11.2% | |
| QCOM Links: Profile News Message Board | |
| Charts:- Daily , Weekly | |
| Add QCOM to Watchlist: View: Get Complete QCOM Trend Analysis ➞ | |
 | TXN Texas Instruments Inc |
| Sector: Technology | |
| SubSector: Semiconductors | |
| MarketCap: 170854 Millions | |
| Recent Price: 182.30 Smart Investing & Trading Score: 30 | |
| Day Percent Change: 1.05882% Day Change: 1.79 | |
| Week Change: -1.15759% Year-to-date Change: -0.2% | |
| TXN Links: Profile News Message Board | |
| Charts:- Daily , Weekly | |
| Add TXN to Watchlist: View: Get Complete TXN Trend Analysis ➞ | |
 | APP Applovin Corp |
| Sector: Technology | |
| SubSector: Advertising Agencies | |
| MarketCap: 165824 Millions | |
| Recent Price: 683.64 Smart Investing & Trading Score: 60 | |
| Day Percent Change: -2.90446% Day Change: -23.59 | |
| Week Change: 6.49925% Year-to-date Change: 100.0% | |
| APP Links: Profile News Message Board | |
| Charts:- Daily , Weekly | |
| Add APP to Watchlist: View: Get Complete APP Trend Analysis ➞ | |
 | ACN Accenture plc |
| Sector: Technology | |
| SubSector: Information Technology Services | |
| MarketCap: 158796 Millions | |
| Recent Price: 244.34 Smart Investing & Trading Score: 40 | |
| Day Percent Change: 0.258504% Day Change: 0.3 | |
| Week Change: 2.2001% Year-to-date Change: -29.0% | |
| ACN Links: Profile News Message Board | |
| Charts:- Daily , Weekly | |
| Add ACN to Watchlist: View: Get Complete ACN Trend Analysis ➞ | |
 | CHL China Mobile Limited |
| Sector: Technology | |
| SubSector: Wireless Communications | |
| MarketCap: 152730 Millions | |
| Recent Price: 170.03 Smart Investing & Trading Score: 60 | |
| Day Percent Change: 0.573761% Day Change: -9999 | |
| Week Change: 27.9576% Year-to-date Change: 0.0% | |
| CHL Links: Profile News Message Board | |
| Charts:- Daily , Weekly | |
| Add CHL to Watchlist: View: Get Complete CHL Trend Analysis ➞ | |
 | ADBE Adobe Inc |
| Sector: Technology | |
| SubSector: Software - Application | |
| MarketCap: 148033 Millions | |
| Recent Price: 351.55 Smart Investing & Trading Score: 50 | |
| Day Percent Change: 2.27802% Day Change: 6.51 | |
| Week Change: -0.48688% Year-to-date Change: -20.3% | |
| ADBE Links: Profile News Message Board | |
| Charts:- Daily , Weekly | |
| Add ADBE to Watchlist: View: Get Complete ADBE Trend Analysis ➞ | |
 | MU Micron Technology Inc |
| Sector: Technology | |
| SubSector: Semiconductors | |
| MarketCap: 147019 Millions | |
| Recent Price: 183.74 Smart Investing & Trading Score: 100 | |
| Day Percent Change: 0.872907% Day Change: 1.48 | |
| Week Change: 13.6232% Year-to-date Change: 110.9% | |
| MU Links: Profile News Message Board | |
| Charts:- Daily , Weekly | |
| Add MU to Watchlist: View: Get Complete MU Trend Analysis ➞ | |
 | ARM Arm Holdings plc. ADR |
| Sector: Technology | |
| SubSector: Semiconductors | |
| MarketCap: 146322 Millions | |
| Recent Price: 151.26 Smart Investing & Trading Score: 30 | |
| Day Percent Change: 0.59% Day Change: 0.88 | |
| Week Change: 8.34% Year-to-date Change: -5.2% | |
| ARM Links: Profile News Message Board | |
| Charts:- Daily , Weekly | |
| Add ARM to Watchlist: View: Get Complete ARM Trend Analysis ➞ | |
 | SPOT Spotify Technology S.A |
| Sector: Technology | |
| SubSector: Internet Content & Information | |
| MarketCap: 143360 Millions | |
| Recent Price: 707.30 Smart Investing & Trading Score: 20 | |
| Day Percent Change: 0.944797% Day Change: 8.39 | |
| Week Change: -0.190503% Year-to-date Change: 54.5% | |
| SPOT Links: Profile News Message Board | |
| Charts:- Daily , Weekly | |
| Add SPOT to Watchlist: View: Get Complete SPOT Trend Analysis ➞ | |
 | APH Amphenol Corp |
| Sector: Technology | |
| SubSector: Electronic Components | |
| MarketCap: 134851 Millions | |
| Recent Price: 123.58 Smart Investing & Trading Score: 80 | |
| Day Percent Change: -0.866356% Day Change: -0.91 | |
| Week Change: 0.365467% Year-to-date Change: 79.9% | |
| APH Links: Profile News Message Board | |
| Charts:- Daily , Weekly | |
| Add APH to Watchlist: View: Get Complete APH Trend Analysis ➞ | |
 | LRCX Lam Research Corp |
| Sector: Technology | |
| SubSector: Semiconductor Equipment & Materials | |
| MarketCap: 130296 Millions | |
| Recent Price: 146.95 Smart Investing & Trading Score: 100 | |
| Day Percent Change: 2.91337% Day Change: 3.94 | |
| Week Change: 14.5184% Year-to-date Change: 104.0% | |
| LRCX Links: Profile News Message Board | |
| Charts:- Daily , Weekly | |
| Add LRCX to Watchlist: View: Get Complete LRCX Trend Analysis ➞ | |
 | PANW Palo Alto Networks Inc |
| Sector: Technology | |
| SubSector: Software - Infrastructure | |
| MarketCap: 130074 Millions | |
| Recent Price: 209.26 Smart Investing & Trading Score: 100 | |
| Day Percent Change: 1.18956% Day Change: 1.5 | |
| Week Change: 4.26507% Year-to-date Change: 15.8% | |
| PANW Links: Profile News Message Board | |
| Charts:- Daily , Weekly | |
| Add PANW to Watchlist: View: Get Complete PANW Trend Analysis ➞ | |
 | AMAT Applied Materials Inc |
| Sector: Technology | |
| SubSector: Semiconductor Equipment & Materials | |
| MarketCap: 129654 Millions | |
| Recent Price: 223.60 Smart Investing & Trading Score: 100 | |
| Day Percent Change: 2.69128% Day Change: 6.97 | |
| Week Change: 11.0008% Year-to-date Change: 37.2% | |
| AMAT Links: Profile News Message Board | |
| Charts:- Daily , Weekly | |
| Add AMAT to Watchlist: View: Get Complete AMAT Trend Analysis ➞ | |
 | CMCSA Comcast Corp |
| Sector: Technology | |
| SubSector: Telecom Services | |
| MarketCap: 125203 Millions | |
| Recent Price: 30.40 Smart Investing & Trading Score: 0 | |
| Day Percent Change: -1.74531% Day Change: -0.22 | |
| Week Change: -3.8279% Year-to-date Change: -16.6% | |
| CMCSA Links: Profile News Message Board | |
| Charts:- Daily , Weekly | |
| Add CMCSA to Watchlist: View: Get Complete CMCSA Trend Analysis ➞ | |
 | ADI Analog Devices Inc |
| Sector: Technology | |
| SubSector: Semiconductors | |
| MarketCap: 121547 Millions | |
| Recent Price: 241.67 Smart Investing & Trading Score: 10 | |
| Day Percent Change: 0.99883% Day Change: 3.56 | |
| Week Change: -2.79152% Year-to-date Change: 15.4% | |
| ADI Links: Profile News Message Board | |
| Charts:- Daily , Weekly | |
| Add ADI to Watchlist: View: Get Complete ADI Trend Analysis ➞ | |
 | ADP Automatic Data Processing Inc |
| Sector: Technology | |
| SubSector: Software - Application | |
| MarketCap: 119881 Millions | |
| Recent Price: 289.83 Smart Investing & Trading Score: 0 | |
| Day Percent Change: -0.610404% Day Change: -2.73 | |
| Week Change: -0.572899% Year-to-date Change: 1.1% | |
| ADP Links: Profile News Message Board | |
| Charts:- Daily , Weekly | |
| Add ADP to Watchlist: View: Get Complete ADP Trend Analysis ➞ | |
 | KLAC KLA Corp |
| Sector: Technology | |
| SubSector: Semiconductor Equipment & Materials | |
| MarketCap: 119437 Millions | |
| Recent Price: 1139.26 Smart Investing & Trading Score: 100 | |
| Day Percent Change: 0.920389% Day Change: 14.54 | |
| Week Change: 6.60541% Year-to-date Change: 79.8% | |
| KLAC Links: Profile News Message Board | |
| Charts:- Daily , Weekly | |
| Add KLAC to Watchlist: View: Get Complete KLAC Trend Analysis ➞ | |
 | SNPS Synopsys, Inc |
| Sector: Technology | |
| SubSector: Software - Infrastructure | |
| MarketCap: 110682 Millions | |
| Recent Price: 471.08 Smart Investing & Trading Score: 20 | |
| Day Percent Change: -3.62126% Day Change: -12.98 | |
| Week Change: 0.638766% Year-to-date Change: -2.4% | |
| SNPS Links: Profile News Message Board | |
| Charts:- Daily , Weekly | |
| Add SNPS to Watchlist: View: Get Complete SNPS Trend Analysis ➞ | |
 | INTC Intel Corp |
| Sector: Technology | |
| SubSector: Semiconductors | |
| MarketCap: 107193 Millions | |
| Recent Price: 37.30 Smart Investing & Trading Score: 100 | |
| Day Percent Change: 3.78408% Day Change: 1.22 | |
| Week Change: 19.4747% Year-to-date Change: 84.5% | |
| INTC Links: Profile News Message Board | |
| Charts:- Daily , Weekly | |
| Add INTC to Watchlist: View: Get Complete INTC Trend Analysis ➞ | |
 | CRWD Crowdstrike Holdings Inc |
| Sector: Technology | |
| SubSector: Software - Infrastructure | |
| MarketCap: 104806 Millions | |
| Recent Price: 496.80 Smart Investing & Trading Score: 80 | |
| Day Percent Change: -0.632051% Day Change: -3.35 | |
| Week Change: 4.29744% Year-to-date Change: 43.0% | |
| CRWD Links: Profile News Message Board | |
| Charts:- Daily , Weekly | |
| Add CRWD to Watchlist: View: Get Complete CRWD Trend Analysis ➞ | |
 | CDNS Cadence Design Systems, Inc |
| Sector: Technology | |
| SubSector: Software - Application | |
| MarketCap: 95646.7 Millions | |
| Recent Price: 347.24 Smart Investing & Trading Score: 30 | |
| Day Percent Change: -1.34386% Day Change: -2.11 | |
| Week Change: -2.72299% Year-to-date Change: 16.7% | |
| CDNS Links: Profile News Message Board | |
| Charts:- Daily , Weekly | |
| Add CDNS to Watchlist: View: Get Complete CDNS Trend Analysis ➞ | |
 | MSTR Strategy Inc |
| Sector: Technology | |
| SubSector: Software - Application | |
| MarketCap: 95236.8 Millions | |
| Recent Price: 352.33 Smart Investing & Trading Score: 70 | |
| Day Percent Change: 4.11335% Day Change: -6.79 | |
| Week Change: 8.97591% Year-to-date Change: 17.4% | |
| MSTR Links: Profile News Message Board | |
| Charts:- Daily , Weekly | |
| Add MSTR to Watchlist: View: Get Complete MSTR Trend Analysis ➞ | |
 | DCM NTT DOCOMO, Inc. |
| Sector: Technology | |
| SubSector: Diversified Communication Services | |
| MarketCap: 94439.2 Millions | |
| Recent Price: 4.16 Smart Investing & Trading Score: 10 | |
| Day Percent Change: -0.71599% Day Change: -9999 | |
| Week Change: -99.9887% Year-to-date Change: 0.0% | |
| DCM Links: Profile News Message Board | |
| Charts:- Daily , Weekly | |
| Add DCM to Watchlist: View: Get Complete DCM Trend Analysis ➞ | |
 | NTT Nippon Telegraph and Telephone Corporation |
| Sector: Technology | |
| SubSector: Telecom Services - Foreign | |
| MarketCap: 90891.7 Millions | |
| Recent Price: 9.25 Smart Investing & Trading Score: 10 | |
| Day Percent Change: 0% Day Change: -9999 | |
| Week Change: -82.8163% Year-to-date Change: 0.0% | |
| NTT Links: Profile News Message Board | |
| Charts:- Daily , Weekly | |
| Add NTT to Watchlist: View: Get Complete NTT Trend Analysis ➞ | |
| For tabular summary view of above stock list: Summary View ➞ 0 - 25 , 25 - 50 , 50 - 75 , 75 - 100 , 100 - 125 , 125 - 150 , 150 - 175 , 175 - 200 , 200 - 225 , 225 - 250 , 250 - 275 | ||
| Click To Change The Sort Order: By Market Cap or Company Size Performance: Year-to-date, Week and Day | |
| Select Chart Type: | ||
|
Best Stocks Today 12Stocks.com |
© 2025 12Stocks.com Terms & Conditions Privacy Contact Us
All Information Provided Only For Education And Not To Be Used For Investing or Trading. See Terms & Conditions


One More Thing ... Get Best Stocks Delivered Daily!
Never Ever Miss A Move With Our Top Ten Stocks Lists
Find Best Stocks In Any Market - Bull or Bear Market
Take A Peek At Our Top Ten Stocks Lists: Daily, Weekly, Year-to-Date & Top Trends
Find Best Stocks In Any Market - Bull or Bear Market
Take A Peek At Our Top Ten Stocks Lists: Daily, Weekly, Year-to-Date & Top Trends
Technology Stocks With Best Up Trends [0-bearish to 100-bullish]: Sony [100], Bakkt [100], Rigetti Computing[100], Fair Isaac[100], Arqit Quantum[100], D-Wave Quantum[100], Navitas Semiconductor[100], Shoals [100], Vuzix [100], Arteris [100], Lantronix [100]
Best Technology Stocks Year-to-Date:
Xunlei [370.476%], Sify [315.033%], Wolfspeed [307.01%], Digital Turbine[265.057%], EchoStar Corp[247.253%], CuriosityStream [241.605%], Viasat [224.029%], Pagaya [222.638%], Oneconnect Financial[209.053%], D-Wave Quantum[203.954%], CommScope Holding[203.101%] Best Technology Stocks This Week:
GTT [443626%], Barracuda Networks[71050%], Mobile TeleSystems[10483.5%], Nam Tai[5033.33%], Ebix [4200.85%], Fang [4150%], NantHealth [3114.02%], Hemisphere Media[2981.82%], Yandex N.V[2935.27%], Wolfspeed [1961.98%], Castlight Health[1751.96%] Best Technology Stocks Daily:
Sony [194.565%], Bakkt [28.6091%], Rigetti Computing[18.4925%], Fair Isaac[17.979%], Arqit Quantum[17.9369%], Marti [17%], Latch [16.6667%], Oclaro [14.734%], D-Wave Quantum[13.968%], Arbe Robotics[13.0178%], Navitas Semiconductor[12.3288%]