
 Login Sign Up


| |||||
 |  | ||||

| 12Stocks.com Market Intelligence |
Best Tech Stocks
| In a hurry? Tech Stocks Lists: Performance & Trends, Stock Charts, FANG Stocks
Sort Tech stocks: Daily, Weekly, Year-to-Date, Market Cap & Trends. Filter Tech stocks list by size:All Tech Large Mid-Range Small and MicroCap |
| 12Stocks.com Tech Stocks Performances & Trends Daily | |||||||||
|
|  The overall Smart Investing & Trading Score is 100 (0-bearish to 100-bullish) which puts Technology sector in short term bullish trend. The Smart Investing & Trading Score from previous trading session is 90 and an improvement of trend continues.
| ||||||||
Here are the Smart Investing & Trading Scores of the most requested Technology stocks at 12Stocks.com (click stock name for detailed review):
|


| 12Stocks.com: Investing in Technology sector with Stocks | |
|
The following table helps investors and traders sort through current performance and trends (as measured by Smart Investing & Trading Score) of various
stocks in the Tech sector. Quick View: Move mouse or cursor over stock symbol (ticker) to view short-term technical chart and over stock name to view long term chart. Click on  to add stock symbol to your watchlist and to add stock symbol to your watchlist and  to view watchlist. Click on any ticker or stock name for detailed market intelligence report for that stock. to view watchlist. Click on any ticker or stock name for detailed market intelligence report for that stock. |
12Stocks.com Performance of Stocks in Tech Sector
| Ticker | Stock Name | Watchlist | Category | Recent Price | Smart Investing & Trading Score | Change % | YTD Change% |
| NYT | New York |   | Publishing | 55.60 | 10 | -0.14 | 7.29% |
| GEN | Gen Digital | | Software - Infrastructure | 28.08 | 10 | -0.14 | 3.09% |
| WMG | Warner Music | | Entertainment | 34.19 | 90 | -0.15 | 10.55% |
| SNX | TD Synnex | | Electronics & Computer Distribution | 164.02 | 60 | -0.23 | 42.30% |
| TWTR | | Internet | 161.10 | 80 | -0.25 | 0.00% | |
| SIRI | Sirius XM | | Entertainment | 22.60 | 30 | -0.26 | 5.98% |
| TEL | TE Connectivity | | Electronic Components | 221.11 | 90 | -0.26 | 58.57% |
| NOW | ServiceNow | | Software - | 910.10 | 10 | -0.26 | -13.68% |
| FI | Fiserv | | IT | 125.76 | 10 | -0.26 | -38.95% |
| NICE | NICE | | Software - | 138.82 | 0 | -0.27 | -18.16% |
| LN | LINE | | Software | 20.80 | 30 | -0.29 | 0.00% |
| CLS | Celestica | | Electronic Components | 250.91 | 90 | -0.31 | 169.59% |
| EA | Electronic Arts | | Electronic Gaming & Multimedia | 201.00 | 60 | -0.31 | 38.14% |
| WIT | Wipro . | | IT | 2.62 | 10 | -0.38 | -24.65% |
| BR | Broadridge Financial | | IT | 233.69 | 10 | -0.39 | 3.81% |
| ORAN | Orange S.A | | Telecom | 9.73 | 0 | -0.41 | 0.00% |
| FN | Fabrinet | | Electronic Components | 369.56 | 90 | -0.47 | 67.70% |
| PAYX | Paychex | | Software - | 123.42 | 0 | -0.48 | -8.97% |
| RBLX | Roblox | | Electronic Gaming & Multimedia | 133.50 | 30 | -0.48 | 126.89% |
| TYL | Tyler | | Software - | 498.19 | 0 | -0.51 | -13.31% |
| SPLK | Splunk | | Software | 217.18 | 80 | -0.51 | 0.00% |
| TI | Telecom Italia | | Communication | 153.68 | 0 | -0.56 | 0.00% |
| FTV | Fortive Corp | | Instruments | 49.78 | 100 | -0.60 | -10.98% |
| ADP | Automatic Data | | Software - | 289.83 | 0 | -0.61 | 1.10% |
| WBD | Warner Bros. | | Entertainment | 19.23 | 20 | -0.62 | 84.20% |
| For chart view version of above stock list: Chart View ➞ 0 - 25 , 25 - 50 , 50 - 75 , 75 - 100 , 100 - 125 , 125 - 150 , 150 - 175 , 175 - 200 , 200 - 225 , 225 - 250 , 250 - 275 | ||
 | Click To Change The Sort Order: By Market Cap or Company Size Performance: Year-to-date, Week and Day |  |
|
Get the most comprehensive stock market coverage daily at 12Stocks.com ➞ Best Stocks Today ➞ Best Stocks Weekly ➞ Best Stocks Year-to-Date ➞ Best Stocks Trends ➞  Best Stocks Today 12Stocks.com Best Nasdaq Stocks ➞ Best S&P 500 Stocks ➞ Best Tech Stocks ➞ Best Biotech Stocks ➞ |
| Detailed Overview of Tech Stocks |
| Tech Technical Overview, Leaders & Laggards, Top Tech ETF Funds & Detailed Tech Stocks List, Charts, Trends & More |
| Tech Sector: Technical Analysis, Trends & YTD Performance | |
| Technology sector is composed of stocks
from semiconductors, software, web, social media
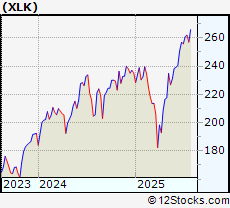
and services subsectors. Technology sector, as represented by XLK, an exchange-traded fund [ETF] that holds basket of tech stocks (e.g, Intel, Google) is up by 23.7823% and is currently outperforming the overall market by 9.0244% year-to-date. Below is a quick view of technical charts and trends: |
|
 XLK Weekly Chart |
|
| Long Term Trend: Very Good | |
| Medium Term Trend: Good | |
 XLK Daily Chart |
|
| Short Term Trend: Very Good | |
| Overall Trend Score: 100 | |
| YTD Performance: 23.7823% | |
| **Trend Scores & Views Are Only For Educational Purposes And Not For Investing | |
| 12Stocks.com: Top Performing Technology Sector Stocks | ||||||||||||||||||||||||||||||||||||||||||||||||
 The top performing Technology sector stocks year to date are
Now, more recently, over last week, the top performing Technology sector stocks on the move are


|
||||||||||||||||||||||||||||||||||||||||||||||||
| 12Stocks.com: Investing in Tech Sector using Exchange Traded Funds | |
|
The following table shows list of key exchange traded funds (ETF) that
help investors track Tech Index. For detailed view, check out our ETF Funds section of our website. Quick View: Move mouse or cursor over ETF symbol (ticker) to view short-term technical chart and over ETF name to view long term chart. Click on ticker or stock name for detailed view. Click on to add stock symbol to your watchlist and to view watchlist. |
12Stocks.com List of ETFs that track Tech Index
| Ticker | ETF Name | Watchlist | Recent Price | Smart Investing & Trading Score | Change % | Week % | Year-to-date % |
| IGN | Tech-Multimd Ntwk | | 53.86 | 40 | 0.918119 | -20.6435 | 0% |
| 12Stocks.com: Charts, Trends, Fundamental Data and Performances of Tech Stocks | |
|
We now take in-depth look at all Tech stocks including charts, multi-period performances and overall trends (as measured by Smart Investing & Trading Score). One can sort Tech stocks (click link to choose) by Daily, Weekly and by Year-to-Date performances. Also, one can sort by size of the company or by market capitalization. |
| Select Your Default Chart Type: | |||||
| |||||
| Click on stock symbol or name for detailed view. Click on to add stock symbol to your watchlist and to view watchlist. Quick View: Move mouse or cursor over "Daily" to quickly view daily technical stock chart and over "Weekly" to view weekly technical stock chart. | |||||


 | NYT New York Times Co |
| Sector: Technology | |
| SubSector: Publishing | |
| MarketCap: 9604.68 Millions | |
| Recent Price: 55.60 Smart Investing & Trading Score: 10 | |
| Day Percent Change: -0.143678% Day Change: -0.01 | |
| Week Change: -3.11901% Year-to-date Change: 7.3% | |
| NYT Links: Profile News Message Board | |
| Charts:- Daily , Weekly | |
| Add NYT to Watchlist: View: Get Complete NYT Trend Analysis ➞ | |
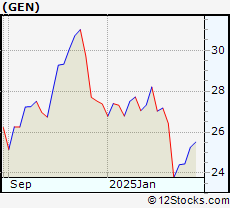 | GEN Gen Digital Inc |
| Sector: Technology | |
| SubSector: Software - Infrastructure | |
| MarketCap: 18168.1 Millions | |
| Recent Price: 28.08 Smart Investing & Trading Score: 10 | |
| Day Percent Change: -0.142248% Day Change: 0.03 | |
| Week Change: -3.47198% Year-to-date Change: 3.1% | |
| GEN Links: Profile News Message Board | |
| Charts:- Daily , Weekly | |
| Add GEN to Watchlist: View: Get Complete GEN Trend Analysis ➞ | |
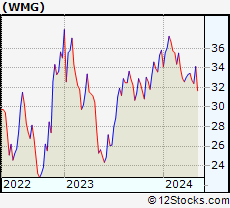 | WMG Warner Music Group Corp |
| Sector: Technology | |
| SubSector: Entertainment | |
| MarketCap: 17040.2 Millions | |
| Recent Price: 34.19 Smart Investing & Trading Score: 90 | |
| Day Percent Change: -0.146028% Day Change: 0.11 | |
| Week Change: 2.25811% Year-to-date Change: 10.6% | |
| WMG Links: Profile News Message Board | |
| Charts:- Daily , Weekly | |
| Add WMG to Watchlist: View: Get Complete WMG Trend Analysis ➞ | |
 | SNX TD Synnex Corp |
| Sector: Technology | |
| SubSector: Electronics & Computer Distribution | |
| MarketCap: 12330.5 Millions | |
| Recent Price: 164.02 Smart Investing & Trading Score: 60 | |
| Day Percent Change: -0.225075% Day Change: -1.08 | |
| Week Change: 9.09937% Year-to-date Change: 42.3% | |
| SNX Links: Profile News Message Board | |
| Charts:- Daily , Weekly | |
| Add SNX to Watchlist: View: Get Complete SNX Trend Analysis ➞ | |
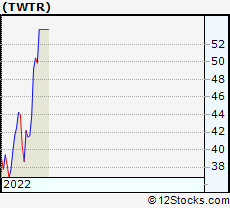 | TWTR Twitter, Inc. |
| Sector: Technology | |
| SubSector: Internet Information Providers | |
| MarketCap: 21898 Millions | |
| Recent Price: 161.10 Smart Investing & Trading Score: 80 | |
| Day Percent Change: -0.253854% Day Change: -9999 | |
| Week Change: 200% Year-to-date Change: 0.0% | |
| TWTR Links: Profile News Message Board | |
| Charts:- Daily , Weekly | |
| Add TWTR to Watchlist: View: Get Complete TWTR Trend Analysis ➞ | |
 | SIRI Sirius XM Holdings Inc |
| Sector: Technology | |
| SubSector: Entertainment | |
| MarketCap: 8101.98 Millions | |
| Recent Price: 22.60 Smart Investing & Trading Score: 30 | |
| Day Percent Change: -0.264784% Day Change: 0.07 | |
| Week Change: 0.088574% Year-to-date Change: 6.0% | |
| SIRI Links: Profile News Message Board | |
| Charts:- Daily , Weekly | |
| Add SIRI to Watchlist: View: Get Complete SIRI Trend Analysis ➞ | |
 | TEL TE Connectivity plc |
| Sector: Technology | |
| SubSector: Electronic Components | |
| MarketCap: 61678.8 Millions | |
| Recent Price: 221.11 Smart Investing & Trading Score: 90 | |
| Day Percent Change: -0.261627% Day Change: 0.11 | |
| Week Change: 2.57469% Year-to-date Change: 58.6% | |
| TEL Links: Profile News Message Board | |
| Charts:- Daily , Weekly | |
| Add TEL to Watchlist: View: Get Complete TEL Trend Analysis ➞ | |
 | NOW ServiceNow Inc |
| Sector: Technology | |
| SubSector: Software - Application | |
| MarketCap: 190070 Millions | |
| Recent Price: 910.10 Smart Investing & Trading Score: 10 | |
| Day Percent Change: -0.255362% Day Change: -3.51 | |
| Week Change: -2.49312% Year-to-date Change: -13.7% | |
| NOW Links: Profile News Message Board | |
| Charts:- Daily , Weekly | |
| Add NOW to Watchlist: View: Get Complete NOW Trend Analysis ➞ | |
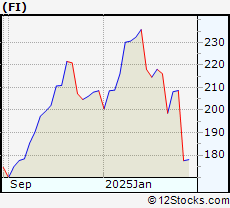 | FI Fiserv, Inc |
| Sector: Technology | |
| SubSector: Information Technology Services | |
| MarketCap: 73412.3 Millions | |
| Recent Price: 125.76 Smart Investing & Trading Score: 10 | |
| Day Percent Change: -0.261718% Day Change: 0.29 | |
| Week Change: -3.6986% Year-to-date Change: -38.9% | |
| FI Links: Profile News Message Board | |
| Charts:- Daily , Weekly | |
| Add FI to Watchlist: View: Get Complete FI Trend Analysis ➞ | |
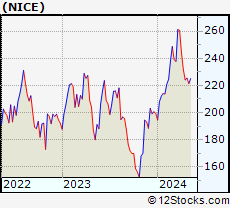 | NICE NICE Ltd ADR |
| Sector: Technology | |
| SubSector: Software - Application | |
| MarketCap: 8880.93 Millions | |
| Recent Price: 138.82 Smart Investing & Trading Score: 0 | |
| Day Percent Change: -0.265824% Day Change: -0.37 | |
| Week Change: -8.79706% Year-to-date Change: -18.2% | |
| NICE Links: Profile News Message Board | |
| Charts:- Daily , Weekly | |
| Add NICE to Watchlist: View: Get Complete NICE Trend Analysis ➞ | |
 | LN LINE Corporation |
| Sector: Technology | |
| SubSector: Application Software | |
| MarketCap: 11338.1 Millions | |
| Recent Price: 20.80 Smart Investing & Trading Score: 30 | |
| Day Percent Change: -0.287632% Day Change: -9999 | |
| Week Change: 23.7359% Year-to-date Change: 0.0% | |
| LN Links: Profile News Message Board | |
| Charts:- Daily , Weekly | |
| Add LN to Watchlist: View: Get Complete LN Trend Analysis ➞ | |
 | CLS Celestica, Inc |
| Sector: Technology | |
| SubSector: Electronic Components | |
| MarketCap: 27915.5 Millions | |
| Recent Price: 250.91 Smart Investing & Trading Score: 90 | |
| Day Percent Change: -0.309905% Day Change: 0.23 | |
| Week Change: 4.34584% Year-to-date Change: 169.6% | |
| CLS Links: Profile News Message Board | |
| Charts:- Daily , Weekly | |
| Add CLS to Watchlist: View: Get Complete CLS Trend Analysis ➞ | |
 | EA Electronic Arts, Inc |
| Sector: Technology | |
| SubSector: Electronic Gaming & Multimedia | |
| MarketCap: 42189.9 Millions | |
| Recent Price: 201.00 Smart Investing & Trading Score: 60 | |
| Day Percent Change: -0.312454% Day Change: -0.68 | |
| Week Change: 20.1076% Year-to-date Change: 38.1% | |
| EA Links: Profile News Message Board | |
| Charts:- Daily , Weekly | |
| Add EA to Watchlist: View: Get Complete EA Trend Analysis ➞ | |
 | WIT Wipro Ltd. ADR |
| Sector: Technology | |
| SubSector: Information Technology Services | |
| MarketCap: 28586.7 Millions | |
| Recent Price: 2.62 Smart Investing & Trading Score: 10 | |
| Day Percent Change: -0.380228% Day Change: -0.04 | |
| Week Change: -3.67647% Year-to-date Change: -24.7% | |
| WIT Links: Profile News Message Board | |
| Charts:- Daily , Weekly | |
| Add WIT to Watchlist: View: Get Complete WIT Trend Analysis ➞ | |
 | BR Broadridge Financial Solutions, Inc |
| Sector: Technology | |
| SubSector: Information Technology Services | |
| MarketCap: 29401.8 Millions | |
| Recent Price: 233.69 Smart Investing & Trading Score: 10 | |
| Day Percent Change: -0.387894% Day Change: -1.55 | |
| Week Change: -0.983009% Year-to-date Change: 3.8% | |
| BR Links: Profile News Message Board | |
| Charts:- Daily , Weekly | |
| Add BR to Watchlist: View: Get Complete BR Trend Analysis ➞ | |
 | ORAN Orange S.A. |
| Sector: Technology | |
| SubSector: Telecom Services - Foreign | |
| MarketCap: 34948.2 Millions | |
| Recent Price: 9.73 Smart Investing & Trading Score: 0 | |
| Day Percent Change: -0.409417% Day Change: -9999 | |
| Week Change: -2.99103% Year-to-date Change: 0.0% | |
| ORAN Links: Profile News Message Board | |
| Charts:- Daily , Weekly | |
| Add ORAN to Watchlist: View: Get Complete ORAN Trend Analysis ➞ | |
 | FN Fabrinet |
| Sector: Technology | |
| SubSector: Electronic Components | |
| MarketCap: 13221 Millions | |
| Recent Price: 369.56 Smart Investing & Trading Score: 90 | |
| Day Percent Change: -0.473985% Day Change: -2.36 | |
| Week Change: 0.790923% Year-to-date Change: 67.7% | |
| FN Links: Profile News Message Board | |
| Charts:- Daily , Weekly | |
| Add FN to Watchlist: View: Get Complete FN Trend Analysis ➞ | |
 | PAYX Paychex Inc |
| Sector: Technology | |
| SubSector: Software - Application | |
| MarketCap: 48791.4 Millions | |
| Recent Price: 123.42 Smart Investing & Trading Score: 0 | |
| Day Percent Change: -0.475768% Day Change: -0.7 | |
| Week Change: -3.78109% Year-to-date Change: -9.0% | |
| PAYX Links: Profile News Message Board | |
| Charts:- Daily , Weekly | |
| Add PAYX to Watchlist: View: Get Complete PAYX Trend Analysis ➞ | |
 | RBLX Roblox Corporation |
| Sector: Technology | |
| SubSector: Electronic Gaming & Multimedia | |
| MarketCap: 88520.7 Millions | |
| Recent Price: 133.50 Smart Investing & Trading Score: 30 | |
| Day Percent Change: -0.477113% Day Change: 0.47 | |
| Week Change: 0.277924% Year-to-date Change: 126.9% | |
| RBLX Links: Profile News Message Board | |
| Charts:- Daily , Weekly | |
| Add RBLX to Watchlist: View: Get Complete RBLX Trend Analysis ➞ | |
 | TYL Tyler Technologies, Inc |
| Sector: Technology | |
| SubSector: Software - Application | |
| MarketCap: 24224.9 Millions | |
| Recent Price: 498.19 Smart Investing & Trading Score: 0 | |
| Day Percent Change: -0.509246% Day Change: -1.86 | |
| Week Change: -4.72375% Year-to-date Change: -13.3% | |
| TYL Links: Profile News Message Board | |
| Charts:- Daily , Weekly | |
| Add TYL to Watchlist: View: Get Complete TYL Trend Analysis ➞ | |
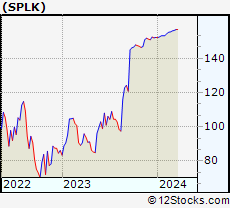 | SPLK Splunk Inc. |
| Sector: Technology | |
| SubSector: Application Software | |
| MarketCap: 19780.1 Millions | |
| Recent Price: 217.18 Smart Investing & Trading Score: 80 | |
| Day Percent Change: -0.508498% Day Change: -9999 | |
| Week Change: 38.7643% Year-to-date Change: 0.0% | |
| SPLK Links: Profile News Message Board | |
| Charts:- Daily , Weekly | |
| Add SPLK to Watchlist: View: Get Complete SPLK Trend Analysis ➞ | |
 | TI Telecom Italia S.p.A. |
| Sector: Technology | |
| SubSector: Diversified Communication Services | |
| MarketCap: 16855.6 Millions | |
| Recent Price: 153.68 Smart Investing & Trading Score: 0 | |
| Day Percent Change: -0.55649% Day Change: -9999 | |
| Week Change: -24.9059% Year-to-date Change: 0.0% | |
| TI Links: Profile News Message Board | |
| Charts:- Daily , Weekly | |
| Add TI to Watchlist: View: Get Complete TI Trend Analysis ➞ | |
 | FTV Fortive Corp |
| Sector: Technology | |
| SubSector: Scientific & Technical Instruments | |
| MarketCap: 16196.2 Millions | |
| Recent Price: 49.78 Smart Investing & Trading Score: 100 | |
| Day Percent Change: -0.599042% Day Change: -0.11 | |
| Week Change: 3.36379% Year-to-date Change: -11.0% | |
| FTV Links: Profile News Message Board | |
| Charts:- Daily , Weekly | |
| Add FTV to Watchlist: View: Get Complete FTV Trend Analysis ➞ | |
 | ADP Automatic Data Processing Inc |
| Sector: Technology | |
| SubSector: Software - Application | |
| MarketCap: 119881 Millions | |
| Recent Price: 289.83 Smart Investing & Trading Score: 0 | |
| Day Percent Change: -0.610404% Day Change: -2.73 | |
| Week Change: -0.572899% Year-to-date Change: 1.1% | |
| ADP Links: Profile News Message Board | |
| Charts:- Daily , Weekly | |
| Add ADP to Watchlist: View: Get Complete ADP Trend Analysis ➞ | |
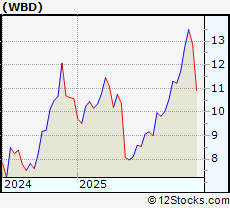 | WBD Warner Bros. Discovery Inc |
| Sector: Technology | |
| SubSector: Entertainment | |
| MarketCap: 29981.6 Millions | |
| Recent Price: 19.23 Smart Investing & Trading Score: 20 | |
| Day Percent Change: -0.62% Day Change: -0.12 | |
| Week Change: -1.44% Year-to-date Change: 84.2% | |
| WBD Links: Profile News Message Board | |
| Charts:- Daily , Weekly | |
| Add WBD to Watchlist: View: Get Complete WBD Trend Analysis ➞ | |
| For tabular summary view of above stock list: Summary View ➞ 0 - 25 , 25 - 50 , 50 - 75 , 75 - 100 , 100 - 125 , 125 - 150 , 150 - 175 , 175 - 200 , 200 - 225 , 225 - 250 , 250 - 275 | ||
| Click To Change The Sort Order: By Market Cap or Company Size Performance: Year-to-date, Week and Day | |
| Select Chart Type: | ||
|
Best Stocks Today 12Stocks.com |
© 2025 12Stocks.com Terms & Conditions Privacy Contact Us
All Information Provided Only For Education And Not To Be Used For Investing or Trading. See Terms & Conditions


One More Thing ... Get Best Stocks Delivered Daily!
Never Ever Miss A Move With Our Top Ten Stocks Lists
Find Best Stocks In Any Market - Bull or Bear Market
Take A Peek At Our Top Ten Stocks Lists: Daily, Weekly, Year-to-Date & Top Trends
Find Best Stocks In Any Market - Bull or Bear Market
Take A Peek At Our Top Ten Stocks Lists: Daily, Weekly, Year-to-Date & Top Trends
Technology Stocks With Best Up Trends [0-bearish to 100-bullish]: Sony [100], Bakkt [100], Rigetti Computing[100], Fair Isaac[100], Arqit Quantum[100], D-Wave Quantum[100], Navitas Semiconductor[100], Shoals [100], Vuzix [100], Arteris [100], Lantronix [100]
Best Technology Stocks Year-to-Date:
Xunlei [370.476%], Sify [315.033%], Wolfspeed [307.01%], Digital Turbine[265.057%], EchoStar Corp[247.253%], CuriosityStream [241.605%], Viasat [224.029%], Pagaya [222.638%], Oneconnect Financial[209.053%], D-Wave Quantum[203.954%], CommScope Holding[203.101%] Best Technology Stocks This Week:
GTT [443626%], Barracuda Networks[71050%], Mobile TeleSystems[10483.5%], Nam Tai[5033.33%], Ebix [4200.85%], Fang [4150%], NantHealth [3114.02%], Hemisphere Media[2981.82%], Yandex N.V[2935.27%], Wolfspeed [1961.98%], Castlight Health[1751.96%] Best Technology Stocks Daily:
Sony [194.565%], Bakkt [28.6091%], Rigetti Computing[18.4925%], Fair Isaac[17.979%], Arqit Quantum[17.9369%], Marti [17%], Latch [16.6667%], Oclaro [14.734%], D-Wave Quantum[13.968%], Arbe Robotics[13.0178%], Navitas Semiconductor[12.3288%]