
 Login Sign Up


| |||||
 |  | ||||

| 12Stocks.com Market Intelligence |
Best Tech Stocks
| In a hurry? Tech Stocks Lists: Performance & Trends, Stock Charts, FANG Stocks
Sort Tech stocks: Daily, Weekly, Year-to-Date, Market Cap & Trends. Filter Tech stocks list by size:All Tech Large Mid-Range Small and MicroCap |
| 12Stocks.com Tech Stocks Performances & Trends Daily | |||||||||
|
|  The overall Smart Investing & Trading Score is 100 (0-bearish to 100-bullish) which puts Technology sector in short term bullish trend. The Smart Investing & Trading Score from previous trading session is 90 and an improvement of trend continues.
| ||||||||
Here are the Smart Investing & Trading Scores of the most requested Technology stocks at 12Stocks.com (click stock name for detailed review):
|


| 12Stocks.com: Investing in Technology sector with Stocks | |
|
The following table helps investors and traders sort through current performance and trends (as measured by Smart Investing & Trading Score) of various
stocks in the Tech sector. Quick View: Move mouse or cursor over stock symbol (ticker) to view short-term technical chart and over stock name to view long term chart. Click on  to add stock symbol to your watchlist and to add stock symbol to your watchlist and  to view watchlist. Click on any ticker or stock name for detailed market intelligence report for that stock. to view watchlist. Click on any ticker or stock name for detailed market intelligence report for that stock. |
12Stocks.com Performance of Stocks in Tech Sector
| Ticker | Stock Name | Watchlist | Category | Recent Price | Smart Investing & Trading Score | Change % | YTD Change% |
| IAC | IAC |   | Internet Content & Information | 34.39 | 10 | 0.61% | -1.62% |
| PLUS | ePlus | | Software - | 72.79 | 70 | 1.31% | -1.64% |
| FSLY | Fastly | | Software - | 9.05 | 100 | 4.75% | -1.74% |
| EXLS | ExlService | | IT | 43.43 | 50 | -0.64% | -1.76% |
| MAX | MediaAlpha | | Internet Content & Information | 11.18 | 30 | 0.00% | -1.84% |
| MLNK | MeridianLink | | Software - | 19.94 | 70 | 0.05% | -1.87% |
| MSI | Motorola | | Communication | 448.03 | 10 | -1.95% | -1.92% |
| ANGI | Angi | | Internet Content & Information | 15.85 | 0 | 0.06% | -2.16% |
| INFA | Informatica | | Software - Infrastructure | 24.88 | 90 | 0.08% | -2.28% |
| SNPS | Synopsys | | Software - Infrastructure | 471.08 | 20 | -3.62% | -2.42% |
| ROP | Roper | | Software - | 497.40 | 40 | -0.11% | -2.75% |
| G | Genpact | | IT | 41.40 | 0 | -1.05% | -2.99% |
| KVHI | KVH Industries | | Telecom | 5.43 | 10 | -2.34% | -3.04% |
| TWLO | Twilio | | Software - Infrastructure | 105.42 | 60 | 2.65% | -3.35% |
| IAS | Integral Ad | | Advertising Agencies | 10.22 | 90 | 0.39% | -3.40% |
| PSN | Parsons Corp | | IT | 87.41 | 100 | 2.55% | -3.43% |
| DUOL | Duolingo | | Software - | 313.09 | 30 | 3.09% | -3.92% |
| AVDX | AvidXchange | | Software - Infrastructure | 9.96 | 50 | 0.00% | -3.95% |
| VSH | Vishay Inter | | Semiconductors | 15.82 | 70 | 2.59% | -4.01% |
| EVTC | Evertec | | Software - Infrastructure | 32.96 | 0 | -1.96% | -4.04% |
| IPG | Interpublic | | Advertising Agencies | 26.26 | 40 | -0.94% | -4.19% |
| CGNT | Cognyte Software | | Software - Infrastructure | 8.25 | 40 | 0.61% | -4.40% |
| PDFS | | Software - | 26.11 | 70 | -0.42% | -4.46% | |
| AMPL | Amplitude | | Software - | 10.22 | 0 | 1.89% | -4.49% |
| PCOR | Procore | | Software - | 71.73 | 50 | 1.20% | -4.58% |
| For chart view version of above stock list: Chart View ➞ 0 - 25 , 25 - 50 , 50 - 75 , 75 - 100 , 100 - 125 , 125 - 150 , 150 - 175 , 175 - 200 , 200 - 225 , 225 - 250 , 250 - 275 , 275 - 300 , 300 - 325 , 325 - 350 , 350 - 375 , 375 - 400 , 400 - 425 , 425 - 450 , 450 - 475 , 475 - 500 , 500 - 525 , 525 - 550 , 550 - 575 , 575 - 600 , 600 - 625 , 625 - 650 , 650 - 675 , 675 - 700 , 700 - 725 , 725 - 750 , 750 - 775 , 775 - 800 , 800 - 825 , 825 - 850 , 850 - 875 , 875 - 900 | ||
 | Click To Change The Sort Order: By Market Cap or Company Size Performance: Year-to-date, Week and Day |  |
|
Get the most comprehensive stock market coverage daily at 12Stocks.com ➞ Best Stocks Today ➞ Best Stocks Weekly ➞ Best Stocks Year-to-Date ➞ Best Stocks Trends ➞  Best Stocks Today 12Stocks.com Best Nasdaq Stocks ➞ Best S&P 500 Stocks ➞ Best Tech Stocks ➞ Best Biotech Stocks ➞ |
| Detailed Overview of Tech Stocks |
| Tech Technical Overview, Leaders & Laggards, Top Tech ETF Funds & Detailed Tech Stocks List, Charts, Trends & More |
| Tech Sector: Technical Analysis, Trends & YTD Performance | |
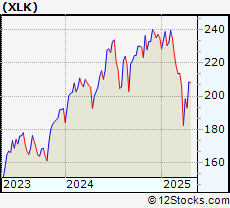
| Technology sector is composed of stocks
from semiconductors, software, web, social media
and services subsectors. Technology sector, as represented by XLK, an exchange-traded fund [ETF] that holds basket of tech stocks (e.g, Intel, Google) is up by 23.7823% and is currently outperforming the overall market by 9.0244% year-to-date. Below is a quick view of technical charts and trends: |
|
 XLK Weekly Chart |
|
| Long Term Trend: Very Good | |
| Medium Term Trend: Good | |
 XLK Daily Chart |
|
| Short Term Trend: Very Good | |
| Overall Trend Score: 100 | |
| YTD Performance: 23.7823% | |
| **Trend Scores & Views Are Only For Educational Purposes And Not For Investing | |
| 12Stocks.com: Top Performing Technology Sector Stocks | ||||||||||||||||||||||||||||||||||||||||||||||||
 The top performing Technology sector stocks year to date are
Now, more recently, over last week, the top performing Technology sector stocks on the move are


|
||||||||||||||||||||||||||||||||||||||||||||||||
| 12Stocks.com: Investing in Tech Sector using Exchange Traded Funds | |
|
The following table shows list of key exchange traded funds (ETF) that
help investors track Tech Index. For detailed view, check out our ETF Funds section of our website. Quick View: Move mouse or cursor over ETF symbol (ticker) to view short-term technical chart and over ETF name to view long term chart. Click on ticker or stock name for detailed view. Click on to add stock symbol to your watchlist and to view watchlist. |
12Stocks.com List of ETFs that track Tech Index
| Ticker | ETF Name | Watchlist | Recent Price | Smart Investing & Trading Score | Change % | Week % | Year-to-date % |
| IGN | Tech-Multimd Ntwk | | 53.86 | 40 | 0.918119 | -20.6435 | 0% |
| 12Stocks.com: Charts, Trends, Fundamental Data and Performances of Tech Stocks | |
|
We now take in-depth look at all Tech stocks including charts, multi-period performances and overall trends (as measured by Smart Investing & Trading Score). One can sort Tech stocks (click link to choose) by Daily, Weekly and by Year-to-Date performances. Also, one can sort by size of the company or by market capitalization. |
| Select Your Default Chart Type: | |||||
| |||||
| Click on stock symbol or name for detailed view. Click on to add stock symbol to your watchlist and to view watchlist. Quick View: Move mouse or cursor over "Daily" to quickly view daily technical stock chart and over "Weekly" to view weekly technical stock chart. | |||||


 | IAC IAC Inc |
| Sector: Technology | |
| SubSector: Internet Content & Information | |
| MarketCap: 2981.05 Millions | |
| Recent Price: 34.39 Smart Investing & Trading Score: 10 | |
| Day Percent Change: 0.614394% Day Change: 0.27 | |
| Week Change: -0.664356% Year-to-date Change: -1.6% | |
| IAC Links: Profile News Message Board | |
| Charts:- Daily , Weekly | |
| Add IAC to Watchlist: View: Get Complete IAC Trend Analysis ➞ | |
 | PLUS ePlus Inc |
| Sector: Technology | |
| SubSector: Software - Application | |
| MarketCap: 1886.69 Millions | |
| Recent Price: 72.79 Smart Investing & Trading Score: 70 | |
| Day Percent Change: 1.30828% Day Change: -0.49 | |
| Week Change: 1.53438% Year-to-date Change: -1.6% | |
| PLUS Links: Profile News Message Board | |
| Charts:- Daily , Weekly | |
| Add PLUS to Watchlist: View: Get Complete PLUS Trend Analysis ➞ | |
 | FSLY Fastly Inc |
| Sector: Technology | |
| SubSector: Software - Application | |
| MarketCap: 1095.18 Millions | |
| Recent Price: 9.05 Smart Investing & Trading Score: 100 | |
| Day Percent Change: 4.74537% Day Change: 0.3 | |
| Week Change: 6.974% Year-to-date Change: -1.7% | |
| FSLY Links: Profile News Message Board | |
| Charts:- Daily , Weekly | |
| Add FSLY to Watchlist: View: Get Complete FSLY Trend Analysis ➞ | |
 | EXLS ExlService Holdings Inc |
| Sector: Technology | |
| SubSector: Information Technology Services | |
| MarketCap: 7264.86 Millions | |
| Recent Price: 43.43 Smart Investing & Trading Score: 50 | |
| Day Percent Change: -0.640586% Day Change: 0.36 | |
| Week Change: -0.48121% Year-to-date Change: -1.8% | |
| EXLS Links: Profile News Message Board | |
| Charts:- Daily , Weekly | |
| Add EXLS to Watchlist: View: Get Complete EXLS Trend Analysis ➞ | |
 | MAX MediaAlpha Inc |
| Sector: Technology | |
| SubSector: Internet Content & Information | |
| MarketCap: 842.51 Millions | |
| Recent Price: 11.18 Smart Investing & Trading Score: 30 | |
| Day Percent Change: 0% Day Change: -0.3 | |
| Week Change: -8.95765% Year-to-date Change: -1.8% | |
| MAX Links: Profile News Message Board | |
| Charts:- Daily , Weekly | |
| Add MAX to Watchlist: View: Get Complete MAX Trend Analysis ➞ | |
 | MLNK MeridianLink Inc |
| Sector: Technology | |
| SubSector: Software - Application | |
| MarketCap: 1475.44 Millions | |
| Recent Price: 19.94 Smart Investing & Trading Score: 70 | |
| Day Percent Change: 0.0501756% Day Change: 0 | |
| Week Change: 0.0501756% Year-to-date Change: -1.9% | |
| MLNK Links: Profile News Message Board | |
| Charts:- Daily , Weekly | |
| Add MLNK to Watchlist: View: Get Complete MLNK Trend Analysis ➞ | |
 | MSI Motorola Solutions Inc |
| Sector: Technology | |
| SubSector: Communication Equipment | |
| MarketCap: 79799.9 Millions | |
| Recent Price: 448.03 Smart Investing & Trading Score: 10 | |
| Day Percent Change: -1.94778% Day Change: -5.8 | |
| Week Change: -1.55999% Year-to-date Change: -1.9% | |
| MSI Links: Profile News Message Board | |
| Charts:- Daily , Weekly | |
| Add MSI to Watchlist: View: Get Complete MSI Trend Analysis ➞ | |
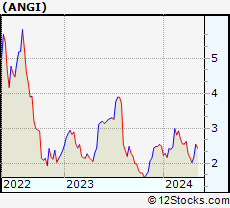 | ANGI Angi Inc |
| Sector: Technology | |
| SubSector: Internet Content & Information | |
| MarketCap: 811.46 Millions | |
| Recent Price: 15.85 Smart Investing & Trading Score: 0 | |
| Day Percent Change: 0.0631313% Day Change: -0.46 | |
| Week Change: -4.46052% Year-to-date Change: -2.2% | |
| ANGI Links: Profile News Message Board | |
| Charts:- Daily , Weekly | |
| Add ANGI to Watchlist: View: Get Complete ANGI Trend Analysis ➞ | |
 | INFA Informatica Inc |
| Sector: Technology | |
| SubSector: Software - Infrastructure | |
| MarketCap: 8639.17 Millions | |
| Recent Price: 24.88 Smart Investing & Trading Score: 90 | |
| Day Percent Change: 0.0804505% Day Change: 0.03 | |
| Week Change: 0.120724% Year-to-date Change: -2.3% | |
| INFA Links: Profile News Message Board | |
| Charts:- Daily , Weekly | |
| Add INFA to Watchlist: View: Get Complete INFA Trend Analysis ➞ | |
 | SNPS Synopsys, Inc |
| Sector: Technology | |
| SubSector: Software - Infrastructure | |
| MarketCap: 110682 Millions | |
| Recent Price: 471.08 Smart Investing & Trading Score: 20 | |
| Day Percent Change: -3.62126% Day Change: -12.98 | |
| Week Change: 0.638766% Year-to-date Change: -2.4% | |
| SNPS Links: Profile News Message Board | |
| Charts:- Daily , Weekly | |
| Add SNPS to Watchlist: View: Get Complete SNPS Trend Analysis ➞ | |
 | ROP Roper Technologies Inc |
| Sector: Technology | |
| SubSector: Software - Application | |
| MarketCap: 55791.3 Millions | |
| Recent Price: 497.40 Smart Investing & Trading Score: 40 | |
| Day Percent Change: -0.114465% Day Change: -0.73 | |
| Week Change: -1.6374% Year-to-date Change: -2.8% | |
| ROP Links: Profile News Message Board | |
| Charts:- Daily , Weekly | |
| Add ROP to Watchlist: View: Get Complete ROP Trend Analysis ➞ | |
 | G Genpact Ltd |
| Sector: Technology | |
| SubSector: Information Technology Services | |
| MarketCap: 7821.24 Millions | |
| Recent Price: 41.40 Smart Investing & Trading Score: 0 | |
| Day Percent Change: -1.05163% Day Change: -0.35 | |
| Week Change: -3.02179% Year-to-date Change: -3.0% | |
| G Links: Profile News Message Board | |
| Charts:- Daily , Weekly | |
| Add G to Watchlist: View: Get Complete G Trend Analysis ➞ | |
 | KVHI KVH Industries, Inc |
| Sector: Technology | |
| SubSector: Telecom Services | |
| MarketCap: 115.66 Millions | |
| Recent Price: 5.43 Smart Investing & Trading Score: 10 | |
| Day Percent Change: -2.33813% Day Change: 0 | |
| Week Change: -6.54045% Year-to-date Change: -3.0% | |
| KVHI Links: Profile News Message Board | |
| Charts:- Daily , Weekly | |
| Add KVHI to Watchlist: View: Get Complete KVHI Trend Analysis ➞ | |
 | TWLO Twilio Inc |
| Sector: Technology | |
| SubSector: Software - Infrastructure | |
| MarketCap: 16673.6 Millions | |
| Recent Price: 105.42 Smart Investing & Trading Score: 60 | |
| Day Percent Change: 2.64849% Day Change: 1.91 | |
| Week Change: 2.11158% Year-to-date Change: -3.3% | |
| TWLO Links: Profile News Message Board | |
| Charts:- Daily , Weekly | |
| Add TWLO to Watchlist: View: Get Complete TWLO Trend Analysis ➞ | |
 | IAS Integral Ad Science Holding Corp |
| Sector: Technology | |
| SubSector: Advertising Agencies | |
| MarketCap: 1448.95 Millions | |
| Recent Price: 10.22 Smart Investing & Trading Score: 90 | |
| Day Percent Change: 0.392927% Day Change: 0.2 | |
| Week Change: 0.294406% Year-to-date Change: -3.4% | |
| IAS Links: Profile News Message Board | |
| Charts:- Daily , Weekly | |
| Add IAS to Watchlist: View: Get Complete IAS Trend Analysis ➞ | |
 | PSN Parsons Corp |
| Sector: Technology | |
| SubSector: Information Technology Services | |
| MarketCap: 8078.95 Millions | |
| Recent Price: 87.41 Smart Investing & Trading Score: 100 | |
| Day Percent Change: 2.54575% Day Change: 0.7 | |
| Week Change: 8.35503% Year-to-date Change: -3.4% | |
| PSN Links: Profile News Message Board | |
| Charts:- Daily , Weekly | |
| Add PSN to Watchlist: View: Get Complete PSN Trend Analysis ➞ | |
 | DUOL Duolingo Inc |
| Sector: Technology | |
| SubSector: Software - Application | |
| MarketCap: 12425.9 Millions | |
| Recent Price: 313.09 Smart Investing & Trading Score: 30 | |
| Day Percent Change: 3.08508% Day Change: 6.64 | |
| Week Change: 3.9579% Year-to-date Change: -3.9% | |
| DUOL Links: Profile News Message Board | |
| Charts:- Daily , Weekly | |
| Add DUOL to Watchlist: View: Get Complete DUOL Trend Analysis ➞ | |
 | AVDX AvidXchange Holdings Inc |
| Sector: Technology | |
| SubSector: Software - Infrastructure | |
| MarketCap: 2064.53 Millions | |
| Recent Price: 9.96 Smart Investing & Trading Score: 50 | |
| Day Percent Change: 0% Day Change: 0 | |
| Week Change: 0.302115% Year-to-date Change: -4.0% | |
| AVDX Links: Profile News Message Board | |
| Charts:- Daily , Weekly | |
| Add AVDX to Watchlist: View: Get Complete AVDX Trend Analysis ➞ | |
 | VSH Vishay Intertechnology, Inc |
| Sector: Technology | |
| SubSector: Semiconductors | |
| MarketCap: 2109.72 Millions | |
| Recent Price: 15.82 Smart Investing & Trading Score: 70 | |
| Day Percent Change: 2.59403% Day Change: -0.23 | |
| Week Change: 3.87393% Year-to-date Change: -4.0% | |
| VSH Links: Profile News Message Board | |
| Charts:- Daily , Weekly | |
| Add VSH to Watchlist: View: Get Complete VSH Trend Analysis ➞ | |
 | EVTC Evertec Inc |
| Sector: Technology | |
| SubSector: Software - Infrastructure | |
| MarketCap: 2205.46 Millions | |
| Recent Price: 32.96 Smart Investing & Trading Score: 0 | |
| Day Percent Change: -1.96312% Day Change: -0.36 | |
| Week Change: -2.60047% Year-to-date Change: -4.0% | |
| EVTC Links: Profile News Message Board | |
| Charts:- Daily , Weekly | |
| Add EVTC to Watchlist: View: Get Complete EVTC Trend Analysis ➞ | |
 | IPG Interpublic Group Of Cos., Inc |
| Sector: Technology | |
| SubSector: Advertising Agencies | |
| MarketCap: 9944.13 Millions | |
| Recent Price: 26.26 Smart Investing & Trading Score: 40 | |
| Day Percent Change: -0.94304% Day Change: -0.18 | |
| Week Change: -0.152091% Year-to-date Change: -4.2% | |
| IPG Links: Profile News Message Board | |
| Charts:- Daily , Weekly | |
| Add IPG to Watchlist: View: Get Complete IPG Trend Analysis ➞ | |
 | CGNT Cognyte Software Ltd |
| Sector: Technology | |
| SubSector: Software - Infrastructure | |
| MarketCap: 647.97 Millions | |
| Recent Price: 8.25 Smart Investing & Trading Score: 40 | |
| Day Percent Change: 0.609756% Day Change: 0.13 | |
| Week Change: -2.13523% Year-to-date Change: -4.4% | |
| CGNT Links: Profile News Message Board | |
| Charts:- Daily , Weekly | |
| Add CGNT to Watchlist: View: Get Complete CGNT Trend Analysis ➞ | |
 | PDFS PDF Solutions Inc |
| Sector: Technology | |
| SubSector: Software - Application | |
| MarketCap: 787.88 Millions | |
| Recent Price: 26.11 Smart Investing & Trading Score: 70 | |
| Day Percent Change: -0.419527% Day Change: -0.04 | |
| Week Change: 2.55302% Year-to-date Change: -4.5% | |
| PDFS Links: Profile News Message Board | |
| Charts:- Daily , Weekly | |
| Add PDFS to Watchlist: View: Get Complete PDFS Trend Analysis ➞ | |
 | AMPL Amplitude Inc |
| Sector: Technology | |
| SubSector: Software - Application | |
| MarketCap: 1514.7 Millions | |
| Recent Price: 10.22 Smart Investing & Trading Score: 0 | |
| Day Percent Change: 1.89432% Day Change: 0.07 | |
| Week Change: -12.9472% Year-to-date Change: -4.5% | |
| AMPL Links: Profile News Message Board | |
| Charts:- Daily , Weekly | |
| Add AMPL to Watchlist: View: Get Complete AMPL Trend Analysis ➞ | |
 | PCOR Procore Technologies Inc |
| Sector: Technology | |
| SubSector: Software - Application | |
| MarketCap: 10533 Millions | |
| Recent Price: 71.73 Smart Investing & Trading Score: 50 | |
| Day Percent Change: 1.19921% Day Change: 1.22 | |
| Week Change: -1.36139% Year-to-date Change: -4.6% | |
| PCOR Links: Profile News Message Board | |
| Charts:- Daily , Weekly | |
| Add PCOR to Watchlist: View: Get Complete PCOR Trend Analysis ➞ | |
| For tabular summary view of above stock list: Summary View ➞ 0 - 25 , 25 - 50 , 50 - 75 , 75 - 100 , 100 - 125 , 125 - 150 , 150 - 175 , 175 - 200 , 200 - 225 , 225 - 250 , 250 - 275 , 275 - 300 , 300 - 325 , 325 - 350 , 350 - 375 , 375 - 400 , 400 - 425 , 425 - 450 , 450 - 475 , 475 - 500 , 500 - 525 , 525 - 550 , 550 - 575 , 575 - 600 , 600 - 625 , 625 - 650 , 650 - 675 , 675 - 700 , 700 - 725 , 725 - 750 , 750 - 775 , 775 - 800 , 800 - 825 , 825 - 850 , 850 - 875 , 875 - 900 | ||
| Click To Change The Sort Order: By Market Cap or Company Size Performance: Year-to-date, Week and Day | |
| Select Chart Type: | ||
|
Best Stocks Today 12Stocks.com |
© 2025 12Stocks.com Terms & Conditions Privacy Contact Us
All Information Provided Only For Education And Not To Be Used For Investing or Trading. See Terms & Conditions


One More Thing ... Get Best Stocks Delivered Daily!
Never Ever Miss A Move With Our Top Ten Stocks Lists
Find Best Stocks In Any Market - Bull or Bear Market
Take A Peek At Our Top Ten Stocks Lists: Daily, Weekly, Year-to-Date & Top Trends
Find Best Stocks In Any Market - Bull or Bear Market
Take A Peek At Our Top Ten Stocks Lists: Daily, Weekly, Year-to-Date & Top Trends
Technology Stocks With Best Up Trends [0-bearish to 100-bullish]: Sony [100], Bakkt [100], Rigetti Computing[100], Fair Isaac[100], Arqit Quantum[100], D-Wave Quantum[100], Navitas Semiconductor[100], Shoals [100], Vuzix [100], Arteris [100], Lantronix [100]
Best Technology Stocks Year-to-Date:
Xunlei [370.476%], Sify [315.033%], Wolfspeed [307.01%], Digital Turbine[265.057%], EchoStar Corp[247.253%], CuriosityStream [241.605%], Viasat [224.029%], Pagaya [222.638%], Oneconnect Financial[209.053%], D-Wave Quantum[203.954%], CommScope Holding[203.101%] Best Technology Stocks This Week:
GTT [443626%], Barracuda Networks[71050%], Mobile TeleSystems[10483.5%], Nam Tai[5033.33%], Ebix [4200.85%], Fang [4150%], NantHealth [3114.02%], Hemisphere Media[2981.82%], Yandex N.V[2935.27%], Wolfspeed [1961.98%], Castlight Health[1751.96%] Best Technology Stocks Daily:
Sony [194.565%], Bakkt [28.6091%], Rigetti Computing[18.4925%], Fair Isaac[17.979%], Arqit Quantum[17.9369%], Marti [17%], Latch [16.6667%], Oclaro [14.734%], D-Wave Quantum[13.968%], Arbe Robotics[13.0178%], Navitas Semiconductor[12.3288%]