
 Login Sign Up


| |||||
 |  | ||||

| 12Stocks.com Market Intelligence |
Best Tech Stocks
| In a hurry? Tech Stocks Lists: Performance & Trends, Stock Charts, FANG Stocks
Sort Tech stocks: Daily, Weekly, Year-to-Date, Market Cap & Trends. Filter Tech stocks list by size:All Tech Large Mid-Range Small and MicroCap |
| 12Stocks.com Tech Stocks Performances & Trends Daily | |||||||||
|
|  The overall Smart Investing & Trading Score is 0 (0-bearish to 100-bullish) which puts Technology sector in short term bearish trend. The Smart Investing & Trading Score from previous trading session is 13 and hence a deterioration of trend.
| ||||||||
Here are the Smart Investing & Trading Scores of the most requested Technology stocks at 12Stocks.com (click stock name for detailed review):
|


| 12Stocks.com: Investing in Technology sector with Stocks | |
|
The following table helps investors and traders sort through current performance and trends (as measured by Smart Investing & Trading Score) of various
stocks in the Tech sector. Quick View: Move mouse or cursor over stock symbol (ticker) to view short-term technical chart and over stock name to view long term chart. Click on  to add stock symbol to your watchlist and to add stock symbol to your watchlist and  to view watchlist. Click on any ticker or stock name for detailed market intelligence report for that stock. to view watchlist. Click on any ticker or stock name for detailed market intelligence report for that stock. |
12Stocks.com Performance of Stocks in Tech Sector
| Ticker | Stock Name | Watchlist | Category | Recent Price | Smart Investing & Trading Score | Change % | YTD Change% |
| CCOI | Cogent |   | Communication | 63.09 | 35 | -0.07% | -17.06% |
| AEIS | Advanced Energy | | Electronics | 90.33 | 0 | -0.53% | -17.07% |
| TDS | Telephone and | | Wireless | 15.22 | 42 | 0.43% | -17.08% |
| KLIC | Kulicke and | | Semiconductor | 45.28 | 0 | -1.75% | -17.24% |
| ANGI | ANGI Homeservices | | Internet | 2.06 | 10 | 0.49% | -17.27% |
| BCE | BCE | | Telecom | 32.56 | 42 | 1.07% | -17.33% |
| RCI | Rogers | | Wireless | 38.55 | 42 | 0.65% | -17.65% |
| COHU | Cohu | | Semiconductor | 29.13 | 10 | -0.38% | -17.69% |
| PLAB | Photronics | | Semiconductor | 25.82 | 0 | -1.05% | -17.71% |
| CCI | Crown Castle | | Communication | 94.78 | 25 | 0.43% | -17.72% |
| LOGI | Logitech | | Computer | 78.21 | 10 | 0.17% | -17.73% |
| OLO | Olo | | Software - | 4.70 | 31 | 0.21% | -17.83% |
| ROG | Rogers | | Electronics | 108.51 | 10 | 1.96% | -17.84% |
| GTLB | GitLab | | Software - | 51.95 | 0 | -3.46% | -18.02% |
| FOUR | Shift4 Payments | | Software Infrastructure | 60.78 | 18 | -1.81% | -18.24% |
| DV | DoubleVerify | | Software - | 30.02 | 25 | -0.40% | -18.38% |
| YY | JOYY | | Internet | 32.40 | 73 | -0.80% | -18.39% |
| RMBS | Rambus | | Semiconductor- | 55.60 | 0 | -1.52% | -18.53% |
| MOMO | Momo | | Internet | 5.66 | 42 | -0.35% | -18.56% |
| ERIC | Telefonaktiebolaget LM | | Communication | 5.13 | 42 | 1.28% | -18.65% |
| FARO | FARO | | Instruments | 18.32 | 5 | 0.03% | -18.66% |
| CWAN | Clearwater Analytics | | Software - | 16.26 | 42 | -1.45% | -18.76% |
| HIMX | Himax | | Semiconductor | 4.93 | 10 | -0.80% | -18.78% |
| LITE | Lumentum | | Communication | 42.47 | 25 | 0.07% | -18.98% |
| TEAM | Atlassian | | IT | 192.52 | 25 | -0.56% | -19.06% |
| For chart view version of above stock list: Chart View ➞ 0 - 25 , 25 - 50 , 50 - 75 , 75 - 100 , 100 - 125 , 125 - 150 , 150 - 175 , 175 - 200 , 200 - 225 , 225 - 250 , 250 - 275 , 275 - 300 , 300 - 325 , 325 - 350 , 350 - 375 , 375 - 400 , 400 - 425 , 425 - 450 , 450 - 475 , 475 - 500 , 500 - 525 , 525 - 550 , 550 - 575 , 575 - 600 , 600 - 625 | ||
 | Click To Change The Sort Order: By Market Cap or Company Size Performance: Year-to-date, Week and Day |  |
|
Get the most comprehensive stock market coverage daily at 12Stocks.com ➞ Best Stocks Today ➞ Best Stocks Weekly ➞ Best Stocks Year-to-Date ➞ Best Stocks Trends ➞  Best Stocks Today 12Stocks.com Best Nasdaq Stocks ➞ Best S&P 500 Stocks ➞ Best Tech Stocks ➞ Best Biotech Stocks ➞ |
| Detailed Overview of Tech Stocks |
| Tech Technical Overview, Leaders & Laggards, Top Tech ETF Funds & Detailed Tech Stocks List, Charts, Trends & More |
| Tech Sector: Technical Analysis, Trends & YTD Performance | |
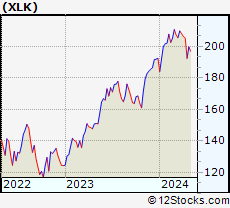
| Technology sector is composed of stocks
from semiconductors, software, web, social media
and services subsectors. Technology sector, as represented by XLK, an exchange-traded fund [ETF] that holds basket of tech stocks (e.g, Intel, Google) is up by 1.28% and is currently underperforming the overall market by -2.8% year-to-date. Below is a quick view of technical charts and trends: |
|
 XLK Weekly Chart |
|
| Long Term Trend: Not Good | |
| Medium Term Trend: Not Good | |
 XLK Daily Chart |
|
| Short Term Trend: Not Good | |
| Overall Trend Score: 0 | |
| YTD Performance: 1.28% | |
| **Trend Scores & Views Are Only For Educational Purposes And Not For Investing | |
| 12Stocks.com: Top Performing Technology Sector Stocks | ||||||||||||||||||||||||||||||||||||||||||||||||
 The top performing Technology sector stocks year to date are
Now, more recently, over last week, the top performing Technology sector stocks on the move are


|
||||||||||||||||||||||||||||||||||||||||||||||||
| 12Stocks.com: Investing in Tech Sector using Exchange Traded Funds | |
|
The following table shows list of key exchange traded funds (ETF) that
help investors track Tech Index. For detailed view, check out our ETF Funds section of our website. Quick View: Move mouse or cursor over ETF symbol (ticker) to view short-term technical chart and over ETF name to view long term chart. Click on ticker or stock name for detailed view. Click on to add stock symbol to your watchlist and to view watchlist. |
12Stocks.com List of ETFs that track Tech Index
| Ticker | ETF Name | Watchlist | Recent Price | Smart Investing & Trading Score | Change % | Week % | Year-to-date % |
| XLK | Technology | | 194.95 | 0 | -0.83 | -5.1 | 1.28% |
| TQQQ | QQQ | | 51.23 | 0 | -2.87 | -12.75 | 1.06% |
| SQQQ | Short QQQ | | 12.44 | 69 | 3.07 | 14.23 | -7.51% |
| SOXL | Semicondct Bull 3X | | 33.34 | 26 | -4.50 | -19.68 | 6.18% |
| SMH | Semiconductor | | 205.29 | 26 | -1.60 | -6.97 | 17.4% |
| 12Stocks.com: Charts, Trends, Fundamental Data and Performances of Tech Stocks | |
|
We now take in-depth look at all Tech stocks including charts, multi-period performances and overall trends (as measured by Smart Investing & Trading Score). One can sort Tech stocks (click link to choose) by Daily, Weekly and by Year-to-Date performances. Also, one can sort by size of the company or by market capitalization. |
| Select Your Default Chart Type: | |||||
| |||||
| Click on stock symbol or name for detailed view. Click on to add stock symbol to your watchlist and to view watchlist. Quick View: Move mouse or cursor over "Daily" to quickly view daily technical stock chart and over "Weekly" to view weekly technical stock chart. | |||||


 | CCOI Cogent Communications Holdings, Inc. |
| Sector: Technology | |
| SubSector: Diversified Communication Services | |
| MarketCap: 3868.14 Millions | |
| Recent Price: 63.09 Smart Investing & Trading Score: 35 | |
| Day Percent Change: -0.07% Day Change: -0.05 | |
| Week Change: 0.13% Year-to-date Change: -17.1% | |
| CCOI Links: Profile News Message Board | |
| Charts:- Daily , Weekly | |
| Add CCOI to Watchlist: View: Get Complete CCOI Trend Analysis ➞ | |
 | AEIS Advanced Energy Industries, Inc. |
| Sector: Technology | |
| SubSector: Diversified Electronics | |
| MarketCap: 1641.86 Millions | |
| Recent Price: 90.33 Smart Investing & Trading Score: 0 | |
| Day Percent Change: -0.53% Day Change: -0.48 | |
| Week Change: -6.42% Year-to-date Change: -17.1% | |
| AEIS Links: Profile News Message Board | |
| Charts:- Daily , Weekly | |
| Add AEIS to Watchlist: View: Get Complete AEIS Trend Analysis ➞ | |
 | TDS Telephone and Data Systems, Inc. |
| Sector: Technology | |
| SubSector: Wireless Communications | |
| MarketCap: 1851.87 Millions | |
| Recent Price: 15.22 Smart Investing & Trading Score: 42 | |
| Day Percent Change: 0.43% Day Change: 0.06 | |
| Week Change: -2.78% Year-to-date Change: -17.1% | |
| TDS Links: Profile News Message Board | |
| Charts:- Daily , Weekly | |
| Add TDS to Watchlist: View: Get Complete TDS Trend Analysis ➞ | |
 | KLIC Kulicke and Soffa Industries, Inc. |
| Sector: Technology | |
| SubSector: Semiconductor Equipment & Materials | |
| MarketCap: 1336.68 Millions | |
| Recent Price: 45.28 Smart Investing & Trading Score: 0 | |
| Day Percent Change: -1.75% Day Change: -0.81 | |
| Week Change: -5.22% Year-to-date Change: -17.2% | |
| KLIC Links: Profile News Message Board | |
| Charts:- Daily , Weekly | |
| Add KLIC to Watchlist: View: Get Complete KLIC Trend Analysis ➞ | |
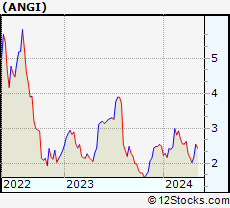 | ANGI ANGI Homeservices Inc. |
| Sector: Technology | |
| SubSector: Internet Software & Services | |
| MarketCap: 2830.61 Millions | |
| Recent Price: 2.06 Smart Investing & Trading Score: 10 | |
| Day Percent Change: 0.49% Day Change: 0.01 | |
| Week Change: -4.63% Year-to-date Change: -17.3% | |
| ANGI Links: Profile News Message Board | |
| Charts:- Daily , Weekly | |
| Add ANGI to Watchlist: View: Get Complete ANGI Trend Analysis ➞ | |
 | BCE BCE Inc. |
| Sector: Technology | |
| SubSector: Telecom Services - Domestic | |
| MarketCap: 37288.3 Millions | |
| Recent Price: 32.56 Smart Investing & Trading Score: 42 | |
| Day Percent Change: 1.07% Day Change: 0.34 | |
| Week Change: 1.39% Year-to-date Change: -17.3% | |
| BCE Links: Profile News Message Board | |
| Charts:- Daily , Weekly | |
| Add BCE to Watchlist: View: Get Complete BCE Trend Analysis ➞ | |
 | RCI Rogers Communications Inc. |
| Sector: Technology | |
| SubSector: Wireless Communications | |
| MarketCap: 22111.6 Millions | |
| Recent Price: 38.55 Smart Investing & Trading Score: 42 | |
| Day Percent Change: 0.65% Day Change: 0.25 | |
| Week Change: -1.58% Year-to-date Change: -17.7% | |
| RCI Links: Profile News Message Board | |
| Charts:- Daily , Weekly | |
| Add RCI to Watchlist: View: Get Complete RCI Trend Analysis ➞ | |
 | COHU Cohu, Inc. |
| Sector: Technology | |
| SubSector: Semiconductor Equipment & Materials | |
| MarketCap: 519.518 Millions | |
| Recent Price: 29.13 Smart Investing & Trading Score: 10 | |
| Day Percent Change: -0.38% Day Change: -0.11 | |
| Week Change: -6.84% Year-to-date Change: -17.7% | |
| COHU Links: Profile News Message Board | |
| Charts:- Daily , Weekly | |
| Add COHU to Watchlist: View: Get Complete COHU Trend Analysis ➞ | |
 | PLAB Photronics, Inc. |
| Sector: Technology | |
| SubSector: Semiconductor Equipment & Materials | |
| MarketCap: 709.018 Millions | |
| Recent Price: 25.82 Smart Investing & Trading Score: 0 | |
| Day Percent Change: -1.05% Day Change: -0.27 | |
| Week Change: -6.57% Year-to-date Change: -17.7% | |
| PLAB Links: Profile News Message Board | |
| Charts:- Daily , Weekly | |
| Add PLAB to Watchlist: View: Get Complete PLAB Trend Analysis ➞ | |
 | CCI Crown Castle International Corp. (REIT) |
| Sector: Technology | |
| SubSector: Diversified Communication Services | |
| MarketCap: 57615.4 Millions | |
| Recent Price: 94.78 Smart Investing & Trading Score: 25 | |
| Day Percent Change: 0.43% Day Change: 0.41 | |
| Week Change: -2% Year-to-date Change: -17.7% | |
| CCI Links: Profile News Message Board | |
| Charts:- Daily , Weekly | |
| Add CCI to Watchlist: View: Get Complete CCI Trend Analysis ➞ | |
 | LOGI Logitech International S.A. |
| Sector: Technology | |
| SubSector: Computer Peripherals | |
| MarketCap: 7998.19 Millions | |
| Recent Price: 78.21 Smart Investing & Trading Score: 10 | |
| Day Percent Change: 0.17% Day Change: 0.13 | |
| Week Change: -9.94% Year-to-date Change: -17.7% | |
| LOGI Links: Profile News Message Board | |
| Charts:- Daily , Weekly | |
| Add LOGI to Watchlist: View: Get Complete LOGI Trend Analysis ➞ | |
 | OLO Olo Inc. |
| Sector: Technology | |
| SubSector: Software - Application | |
| MarketCap: 1030 Millions | |
| Recent Price: 4.70 Smart Investing & Trading Score: 31 | |
| Day Percent Change: 0.21% Day Change: 0.01 | |
| Week Change: -5.81% Year-to-date Change: -17.8% | |
| OLO Links: Profile News Message Board | |
| Charts:- Daily , Weekly | |
| Add OLO to Watchlist: View: Get Complete OLO Trend Analysis ➞ | |
 | ROG Rogers Corporation |
| Sector: Technology | |
| SubSector: Diversified Electronics | |
| MarketCap: 1756.36 Millions | |
| Recent Price: 108.51 Smart Investing & Trading Score: 10 | |
| Day Percent Change: 1.96% Day Change: 2.09 | |
| Week Change: -2.13% Year-to-date Change: -17.8% | |
| ROG Links: Profile News Message Board | |
| Charts:- Daily , Weekly | |
| Add ROG to Watchlist: View: Get Complete ROG Trend Analysis ➞ | |
 | GTLB GitLab Inc. |
| Sector: Technology | |
| SubSector: Software - Application | |
| MarketCap: 7840 Millions | |
| Recent Price: 51.95 Smart Investing & Trading Score: 0 | |
| Day Percent Change: -3.46% Day Change: -1.86 | |
| Week Change: -8.97% Year-to-date Change: -18.0% | |
| GTLB Links: Profile News Message Board | |
| Charts:- Daily , Weekly | |
| Add GTLB to Watchlist: View: Get Complete GTLB Trend Analysis ➞ | |
 | FOUR Shift4 Payments, Inc. |
| Sector: Technology | |
| SubSector: Software Infrastructure | |
| MarketCap: 49287 Millions | |
| Recent Price: 60.78 Smart Investing & Trading Score: 18 | |
| Day Percent Change: -1.81% Day Change: -1.12 | |
| Week Change: -5% Year-to-date Change: -18.2% | |
| FOUR Links: Profile News Message Board | |
| Charts:- Daily , Weekly | |
| Add FOUR to Watchlist: View: Get Complete FOUR Trend Analysis ➞ | |
 | DV DoubleVerify Holdings, Inc. |
| Sector: Technology | |
| SubSector: Software - Application | |
| MarketCap: 6500 Millions | |
| Recent Price: 30.02 Smart Investing & Trading Score: 25 | |
| Day Percent Change: -0.40% Day Change: -0.12 | |
| Week Change: -7.23% Year-to-date Change: -18.4% | |
| DV Links: Profile News Message Board | |
| Charts:- Daily , Weekly | |
| Add DV to Watchlist: View: Get Complete DV Trend Analysis ➞ | |
 | YY JOYY Inc. |
| Sector: Technology | |
| SubSector: Internet Information Providers | |
| MarketCap: 3527.6 Millions | |
| Recent Price: 32.40 Smart Investing & Trading Score: 73 | |
| Day Percent Change: -0.80% Day Change: -0.26 | |
| Week Change: -1.52% Year-to-date Change: -18.4% | |
| YY Links: Profile News Message Board | |
| Charts:- Daily , Weekly | |
| Add YY to Watchlist: View: Get Complete YY Trend Analysis ➞ | |
 | RMBS Rambus Inc. |
| Sector: Technology | |
| SubSector: Semiconductor- Memory Chips | |
| MarketCap: 1296 Millions | |
| Recent Price: 55.60 Smart Investing & Trading Score: 0 | |
| Day Percent Change: -1.52% Day Change: -0.86 | |
| Week Change: -7.55% Year-to-date Change: -18.5% | |
| RMBS Links: Profile News Message Board | |
| Charts:- Daily , Weekly | |
| Add RMBS to Watchlist: View: Get Complete RMBS Trend Analysis ➞ | |
 | MOMO Momo Inc. |
| Sector: Technology | |
| SubSector: Internet Software & Services | |
| MarketCap: 4796.71 Millions | |
| Recent Price: 5.66 Smart Investing & Trading Score: 42 | |
| Day Percent Change: -0.35% Day Change: -0.02 | |
| Week Change: 6.79% Year-to-date Change: -18.6% | |
| MOMO Links: Profile News Message Board | |
| Charts:- Daily , Weekly | |
| Add MOMO to Watchlist: View: Get Complete MOMO Trend Analysis ➞ | |
 | ERIC Telefonaktiebolaget LM Ericsson (publ) |
| Sector: Technology | |
| SubSector: Communication Equipment | |
| MarketCap: 27041.1 Millions | |
| Recent Price: 5.13 Smart Investing & Trading Score: 42 | |
| Day Percent Change: 1.28% Day Change: 0.07 | |
| Week Change: 1.89% Year-to-date Change: -18.7% | |
| ERIC Links: Profile News Message Board | |
| Charts:- Daily , Weekly | |
| Add ERIC to Watchlist: View: Get Complete ERIC Trend Analysis ➞ | |
 | FARO FARO Technologies, Inc. |
| Sector: Technology | |
| SubSector: Scientific & Technical Instruments | |
| MarketCap: 721.953 Millions | |
| Recent Price: 18.32 Smart Investing & Trading Score: 5 | |
| Day Percent Change: 0.03% Day Change: 0.00 | |
| Week Change: -8.28% Year-to-date Change: -18.7% | |
| FARO Links: Profile News Message Board | |
| Charts:- Daily , Weekly | |
| Add FARO to Watchlist: View: Get Complete FARO Trend Analysis ➞ | |
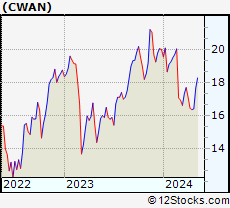 | CWAN Clearwater Analytics Holdings, Inc. |
| Sector: Technology | |
| SubSector: Software - Application | |
| MarketCap: 3830 Millions | |
| Recent Price: 16.26 Smart Investing & Trading Score: 42 | |
| Day Percent Change: -1.45% Day Change: -0.24 | |
| Week Change: -1.09% Year-to-date Change: -18.8% | |
| CWAN Links: Profile News Message Board | |
| Charts:- Daily , Weekly | |
| Add CWAN to Watchlist: View: Get Complete CWAN Trend Analysis ➞ | |
 | HIMX Himax Technologies, Inc. |
| Sector: Technology | |
| SubSector: Semiconductor - Specialized | |
| MarketCap: 496.16 Millions | |
| Recent Price: 4.93 Smart Investing & Trading Score: 10 | |
| Day Percent Change: -0.80% Day Change: -0.04 | |
| Week Change: -5.92% Year-to-date Change: -18.8% | |
| HIMX Links: Profile News Message Board | |
| Charts:- Daily , Weekly | |
| Add HIMX to Watchlist: View: Get Complete HIMX Trend Analysis ➞ | |
 | LITE Lumentum Holdings Inc. |
| Sector: Technology | |
| SubSector: Communication Equipment | |
| MarketCap: 4990.49 Millions | |
| Recent Price: 42.47 Smart Investing & Trading Score: 25 | |
| Day Percent Change: 0.07% Day Change: 0.03 | |
| Week Change: -2.26% Year-to-date Change: -19.0% | |
| LITE Links: Profile News Message Board | |
| Charts:- Daily , Weekly | |
| Add LITE to Watchlist: View: Get Complete LITE Trend Analysis ➞ | |
 | TEAM Atlassian Corporation Plc |
| Sector: Technology | |
| SubSector: Information Technology Services | |
| MarketCap: 32265.7 Millions | |
| Recent Price: 192.52 Smart Investing & Trading Score: 25 | |
| Day Percent Change: -0.56% Day Change: -1.09 | |
| Week Change: -6.78% Year-to-date Change: -19.1% | |
| TEAM Links: Profile News Message Board | |
| Charts:- Daily , Weekly | |
| Add TEAM to Watchlist: View: Get Complete TEAM Trend Analysis ➞ | |
| For tabular summary view of above stock list: Summary View ➞ 0 - 25 , 25 - 50 , 50 - 75 , 75 - 100 , 100 - 125 , 125 - 150 , 150 - 175 , 175 - 200 , 200 - 225 , 225 - 250 , 250 - 275 , 275 - 300 , 300 - 325 , 325 - 350 , 350 - 375 , 375 - 400 , 400 - 425 , 425 - 450 , 450 - 475 , 475 - 500 , 500 - 525 , 525 - 550 , 550 - 575 , 575 - 600 , 600 - 625 | ||
| Click To Change The Sort Order: By Market Cap or Company Size Performance: Year-to-date, Week and Day | |
| Select Chart Type: | ||
|
Best Stocks Today 12Stocks.com |
© 2024 12Stocks.com Terms & Conditions Privacy Contact Us
All Information Provided Only For Education And Not To Be Used For Investing or Trading. See Terms & Conditions


One More Thing ... Get Best Stocks Delivered Daily!
Never Ever Miss A Move With Our Top Ten Stocks Lists
Find Best Stocks In Any Market - Bull or Bear Market
Take A Peek At Our Top Ten Stocks Lists: Daily, Weekly, Year-to-Date & Top Trends
Find Best Stocks In Any Market - Bull or Bear Market
Take A Peek At Our Top Ten Stocks Lists: Daily, Weekly, Year-to-Date & Top Trends
Technology Stocks With Best Up Trends [0-bearish to 100-bullish]: Badger Meter[100], EchoStar [100], NextNav [100], Turkcell Iletisim[93], Grab [93], Full Truck[93], Zuora [93], Inspire Medical[93], GigaCloud [93], Snap One[93], GDS [88]
Best Technology Stocks Year-to-Date:
MediaCo Holding[544.37%], Super Micro[176.22%], CXApp [157.92%], Uxin [141.08%], CuriosityStream [107.37%], GigaCloud [95.49%], MicroStrategy [91.4%], D-Wave Quantum[89.2%], NextNav [78.76%], SoundHound AI[73.83%], AppLovin [69.92%] Best Technology Stocks This Week:
Snap One[29.79%], Badger Meter[17.13%], Mynaric AG[11.76%], SYLA [9.96%], Encore Wire[9.86%], Zuora [9.36%], Quhuo [8.87%], Iridium [8.72%], Applied Optoelectronics[8.28%], Bentley Systems[7.96%], Expensify [7.82%] Best Technology Stocks Daily:
CuriosityStream [10.89%], Tigo Energy[8.62%], Cheetah Mobile[7.12%], Markforged Holding[6.04%], CXApp [5.36%], Applied Optoelectronics[4.29%], MediaCo Holding[3.58%], Perficient [3.49%], Bitdeer [3.26%], QuinStreet [3.21%], Karooooo [3.20%]