
 Login Sign Up


| |||||
 |  | ||||

| 12Stocks.com Market Intelligence |
Best Tech Stocks
| In a hurry? Tech Stocks Lists: Performance & Trends, Stock Charts, FANG Stocks
Sort Tech stocks: Daily, Weekly, Year-to-Date, Market Cap & Trends. Filter Tech stocks list by size:All Tech Large Mid-Range Small and MicroCap |
| 12Stocks.com Tech Stocks Performances & Trends Daily | |||||||||
|
|  The overall Smart Investing & Trading Score is 0 (0-bearish to 100-bullish) which puts Technology sector in short term bearish trend. The Smart Investing & Trading Score from previous trading session is 13 and hence a deterioration of trend.
| ||||||||
Here are the Smart Investing & Trading Scores of the most requested Technology stocks at 12Stocks.com (click stock name for detailed review):
|


| 12Stocks.com: Investing in Technology sector with Stocks | |
|
The following table helps investors and traders sort through current performance and trends (as measured by Smart Investing & Trading Score) of various
stocks in the Tech sector. Quick View: Move mouse or cursor over stock symbol (ticker) to view short-term technical chart and over stock name to view long term chart. Click on  to add stock symbol to your watchlist and to add stock symbol to your watchlist and  to view watchlist. Click on any ticker or stock name for detailed market intelligence report for that stock. to view watchlist. Click on any ticker or stock name for detailed market intelligence report for that stock. |
12Stocks.com Performance of Stocks in Tech Sector
| Ticker | Stock Name | Watchlist | Category | Recent Price | Smart Investing & Trading Score | Change % | YTD Change% |
| CTSH | Cognizant |   | IT | 67.44 | 18 | 0.46% | -10.71% |
| PD | PagerDuty | | Software | 20.61 | 8 | -1.06% | -10.97% |
| IDCC | InterDigital | | Wireless | 96.63 | 25 | 1.01% | -10.97% |
| RBBN | Ribbon | | Telecom | 2.58 | 17 | 0.19% | -11.03% |
| RDVT | Red Violet | | Software | 17.76 | 20 | -0.17% | -11.07% |
| ADSK | Autodesk | | Software | 216.50 | 17 | 2.79% | -11.08% |
| FLEX | Flex | | Circuit Boards | 27.07 | 26 | -2.03% | -11.13% |
| TTMI | TTM | | Circuit Boards | 14.05 | 44 | -0.14% | -11.13% |
| ANSS | ANSYS | | Software | 322.11 | 10 | -0.74% | -11.24% |
| NCNO | nCino | | Software | 29.82 | 35 | 0.18% | -11.34% |
| PAYC | Paycom Software | | Software | 183.25 | 10 | -0.88% | -11.35% |
| NOVT | Novanta | | Instruments | 149.28 | 0 | -0.49% | -11.36% |
| NTCT | NetScout Systems | | Software | 19.43 | 42 | 1.89% | -11.48% |
| TER | Teradyne | | Semiconductor | 95.97 | 13 | -4.22% | -11.56% |
| HURC | Hurco | | Instruments | 19.04 | 10 | -1.40% | -11.57% |
| JD | JD.com | | Internet | 25.51 | 54 | 0.20% | -11.70% |
| BLKB | Blackbaud | | Software | 76.48 | 42 | -0.30% | -11.79% |
| MTCH | Match | | Internet | 32.18 | 37 | -0.12% | -11.84% |
| DXC | DXC | | IT | 20.14 | 52 | 2.86% | -11.94% |
| PGNY | Progyny | | Healthcare Information | 32.68 | 10 | 2.51% | -12.10% |
| DUOL | Duolingo | | Software - | 200.15 | 51 | -4.80% | -12.16% |
| SATS | EchoStar | | Communication | 14.55 | 100 | -0.07% | -12.19% |
| DOCN | DigitalOcean | | Software - Infrastructure | 32.43 | 10 | -3.11% | -12.30% |
| UMC | United Microelectronics | | Semiconductor | 7.40 | 0 | -1.73% | -12.53% |
| ALGM | Allegro MicroSystems | | Semiconductors | 26.48 | 43 | 0.23% | -12.58% |
| For chart view version of above stock list: Chart View ➞ 0 - 25 , 25 - 50 , 50 - 75 , 75 - 100 , 100 - 125 , 125 - 150 , 150 - 175 , 175 - 200 , 200 - 225 , 225 - 250 , 250 - 275 , 275 - 300 , 300 - 325 , 325 - 350 , 350 - 375 , 375 - 400 , 400 - 425 , 425 - 450 , 450 - 475 , 475 - 500 , 500 - 525 , 525 - 550 , 550 - 575 , 575 - 600 , 600 - 625 , 625 - 650 | ||
 | Click To Change The Sort Order: By Market Cap or Company Size Performance: Year-to-date, Week and Day |  |
|
Get the most comprehensive stock market coverage daily at 12Stocks.com ➞ Best Stocks Today ➞ Best Stocks Weekly ➞ Best Stocks Year-to-Date ➞ Best Stocks Trends ➞  Best Stocks Today 12Stocks.com Best Nasdaq Stocks ➞ Best S&P 500 Stocks ➞ Best Tech Stocks ➞ Best Biotech Stocks ➞ |
| Detailed Overview of Tech Stocks |
| Tech Technical Overview, Leaders & Laggards, Top Tech ETF Funds & Detailed Tech Stocks List, Charts, Trends & More |
| Tech Sector: Technical Analysis, Trends & YTD Performance | |
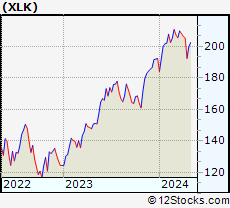
| Technology sector is composed of stocks
from semiconductors, software, web, social media
and services subsectors. Technology sector, as represented by XLK, an exchange-traded fund [ETF] that holds basket of tech stocks (e.g, Intel, Google) is up by 0.03% and is currently underperforming the overall market by -3.35% year-to-date. Below is a quick view of technical charts and trends: |
|
 XLK Weekly Chart |
|
| Long Term Trend: Not Good | |
| Medium Term Trend: Not Good | |
 XLK Daily Chart |
|
| Short Term Trend: Not Good | |
| Overall Trend Score: 0 | |
| YTD Performance: 0.03% | |
| **Trend Scores & Views Are Only For Educational Purposes And Not For Investing | |
| 12Stocks.com: Top Performing Technology Sector Stocks | ||||||||||||||||||||||||||||||||||||||||||||||||
 The top performing Technology sector stocks year to date are
Now, more recently, over last week, the top performing Technology sector stocks on the move are


|
||||||||||||||||||||||||||||||||||||||||||||||||
| 12Stocks.com: Investing in Tech Sector using Exchange Traded Funds | |
|
The following table shows list of key exchange traded funds (ETF) that
help investors track Tech Index. For detailed view, check out our ETF Funds section of our website. Quick View: Move mouse or cursor over ETF symbol (ticker) to view short-term technical chart and over ETF name to view long term chart. Click on ticker or stock name for detailed view. Click on to add stock symbol to your watchlist and to view watchlist. |
12Stocks.com List of ETFs that track Tech Index
| Ticker | ETF Name | Watchlist | Recent Price | Smart Investing & Trading Score | Change % | Week % | Year-to-date % |
| XLK | Technology | | 192.53 | 0 | -2.06 | -6.27 | 0.03% |
| QQQ | QQQ | | 414.65 | 13 | -2.07 | -5.39 | 1.25% |
| IYW | Technology | | 124.75 | 36 | -2.85 | -6.87 | 1.63% |
| VGT | Information Technology | | 479.90 | 23 | -2.65 | -6.76 | -0.85% |
| IXN | Global Tech | | 68.72 | 36 | -2.65 | -6.88 | 0.79% |
| IGV | Tech-Software | | 78.53 | 10 | -1.22 | -5.11 | -3.2% |
| XSD | Semiconductor | | 203.56 | 23 | -3.15 | -8.78 | -9.44% |
| TQQQ | QQQ | | 49.48 | 0 | -6.20 | -15.74 | -2.41% |
| SQQQ | Short QQQ | | 12.84 | 82 | 6.38 | 17.91 | -4.54% |
| SOXL | Semicondct Bull 3X | | 30.79 | 0 | -11.80 | -25.83 | -1.94% |
| SOXS | Semicondct Bear 3X | | 46.13 | 90 | 11.78 | 1210.51 | 692.61% |
| SOXX | PHLX Semiconductor | | 198.39 | 36 | -3.99 | -9.02 | 3.31% |
| QTEC | First -100-Tech | | 173.94 | 10 | -2.21 | -6.49 | -0.87% |
| SMH | Semiconductor | | 199.21 | 26 | -4.52 | -9.73 | 13.92% |
| 12Stocks.com: Charts, Trends, Fundamental Data and Performances of Tech Stocks | |
|
We now take in-depth look at all Tech stocks including charts, multi-period performances and overall trends (as measured by Smart Investing & Trading Score). One can sort Tech stocks (click link to choose) by Daily, Weekly and by Year-to-Date performances. Also, one can sort by size of the company or by market capitalization. |
| Select Your Default Chart Type: | |||||
| |||||
| Click on stock symbol or name for detailed view. Click on to add stock symbol to your watchlist and to view watchlist. Quick View: Move mouse or cursor over "Daily" to quickly view daily technical stock chart and over "Weekly" to view weekly technical stock chart. | |||||


 | CTSH Cognizant Technology Solutions Corporation |
| Sector: Technology | |
| SubSector: Information Technology Services | |
| MarketCap: 26249.7 Millions | |
| Recent Price: 67.44 Smart Investing & Trading Score: 18 | |
| Day Percent Change: 0.46% Day Change: 0.31 | |
| Week Change: -2.63% Year-to-date Change: -10.7% | |
| CTSH Links: Profile News Message Board | |
| Charts:- Daily , Weekly | |
| Add CTSH to Watchlist: View: Get Complete CTSH Trend Analysis ➞ | |
 | PD PagerDuty, Inc. |
| Sector: Technology | |
| SubSector: Application Software | |
| MarketCap: 1690.32 Millions | |
| Recent Price: 20.61 Smart Investing & Trading Score: 8 | |
| Day Percent Change: -1.06% Day Change: -0.22 | |
| Week Change: -6.83% Year-to-date Change: -11.0% | |
| PD Links: Profile News Message Board | |
| Charts:- Daily , Weekly | |
| Add PD to Watchlist: View: Get Complete PD Trend Analysis ➞ | |
 | IDCC InterDigital, Inc. |
| Sector: Technology | |
| SubSector: Wireless Communications | |
| MarketCap: 1225.27 Millions | |
| Recent Price: 96.63 Smart Investing & Trading Score: 25 | |
| Day Percent Change: 1.01% Day Change: 0.97 | |
| Week Change: 0.08% Year-to-date Change: -11.0% | |
| IDCC Links: Profile News Message Board | |
| Charts:- Daily , Weekly | |
| Add IDCC to Watchlist: View: Get Complete IDCC Trend Analysis ➞ | |
 | RBBN Ribbon Communications Inc. |
| Sector: Technology | |
| SubSector: Telecom Services - Domestic | |
| MarketCap: 284.577 Millions | |
| Recent Price: 2.58 Smart Investing & Trading Score: 17 | |
| Day Percent Change: 0.19% Day Change: 0.00 | |
| Week Change: -6.18% Year-to-date Change: -11.0% | |
| RBBN Links: Profile News Message Board | |
| Charts:- Daily , Weekly | |
| Add RBBN to Watchlist: View: Get Complete RBBN Trend Analysis ➞ | |
 | RDVT Red Violet, Inc. |
| Sector: Technology | |
| SubSector: Application Software | |
| MarketCap: 215.162 Millions | |
| Recent Price: 17.76 Smart Investing & Trading Score: 20 | |
| Day Percent Change: -0.17% Day Change: -0.03 | |
| Week Change: -4.82% Year-to-date Change: -11.1% | |
| RDVT Links: Profile News Message Board | |
| Charts:- Daily , Weekly | |
| Add RDVT to Watchlist: View: Get Complete RDVT Trend Analysis ➞ | |
 | ADSK Autodesk, Inc. |
| Sector: Technology | |
| SubSector: Technical & System Software | |
| MarketCap: 36975.8 Millions | |
| Recent Price: 216.50 Smart Investing & Trading Score: 17 | |
| Day Percent Change: 2.79% Day Change: 5.87 | |
| Week Change: -8.64% Year-to-date Change: -11.1% | |
| ADSK Links: Profile News Message Board | |
| Charts:- Daily , Weekly | |
| Add ADSK to Watchlist: View: Get Complete ADSK Trend Analysis ➞ | |
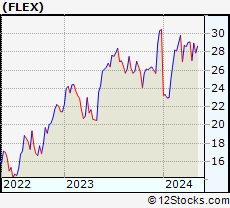 | FLEX Flex Ltd. |
| Sector: Technology | |
| SubSector: Printed Circuit Boards | |
| MarketCap: 3939.75 Millions | |
| Recent Price: 27.07 Smart Investing & Trading Score: 26 | |
| Day Percent Change: -2.03% Day Change: -0.56 | |
| Week Change: -6.98% Year-to-date Change: -11.1% | |
| FLEX Links: Profile News Message Board | |
| Charts:- Daily , Weekly | |
| Add FLEX to Watchlist: View: Get Complete FLEX Trend Analysis ➞ | |
 | TTMI TTM Technologies, Inc. |
| Sector: Technology | |
| SubSector: Printed Circuit Boards | |
| MarketCap: 1028.35 Millions | |
| Recent Price: 14.05 Smart Investing & Trading Score: 44 | |
| Day Percent Change: -0.14% Day Change: -0.02 | |
| Week Change: -2.02% Year-to-date Change: -11.1% | |
| TTMI Links: Profile News Message Board | |
| Charts:- Daily , Weekly | |
| Add TTMI to Watchlist: View: Get Complete TTMI Trend Analysis ➞ | |
 | ANSS ANSYS, Inc. |
| Sector: Technology | |
| SubSector: Application Software | |
| MarketCap: 19497.4 Millions | |
| Recent Price: 322.11 Smart Investing & Trading Score: 10 | |
| Day Percent Change: -0.74% Day Change: -2.39 | |
| Week Change: -3.62% Year-to-date Change: -11.2% | |
| ANSS Links: Profile News Message Board | |
| Charts:- Daily , Weekly | |
| Add ANSS to Watchlist: View: Get Complete ANSS Trend Analysis ➞ | |
 | NCNO nCino, Inc. |
| Sector: Technology | |
| SubSector: Software Application | |
| MarketCap: 74187 Millions | |
| Recent Price: 29.82 Smart Investing & Trading Score: 35 | |
| Day Percent Change: 0.18% Day Change: 0.05 | |
| Week Change: -7.32% Year-to-date Change: -11.3% | |
| NCNO Links: Profile News Message Board | |
| Charts:- Daily , Weekly | |
| Add NCNO to Watchlist: View: Get Complete NCNO Trend Analysis ➞ | |
 | PAYC Paycom Software, Inc. |
| Sector: Technology | |
| SubSector: Application Software | |
| MarketCap: 13041.6 Millions | |
| Recent Price: 183.25 Smart Investing & Trading Score: 10 | |
| Day Percent Change: -0.88% Day Change: -1.62 | |
| Week Change: -7.45% Year-to-date Change: -11.4% | |
| PAYC Links: Profile News Message Board | |
| Charts:- Daily , Weekly | |
| Add PAYC to Watchlist: View: Get Complete PAYC Trend Analysis ➞ | |
 | NOVT Novanta Inc. |
| Sector: Technology | |
| SubSector: Scientific & Technical Instruments | |
| MarketCap: 2680.83 Millions | |
| Recent Price: 149.28 Smart Investing & Trading Score: 0 | |
| Day Percent Change: -0.49% Day Change: -0.74 | |
| Week Change: -8.42% Year-to-date Change: -11.4% | |
| NOVT Links: Profile News Message Board | |
| Charts:- Daily , Weekly | |
| Add NOVT to Watchlist: View: Get Complete NOVT Trend Analysis ➞ | |
 | NTCT NetScout Systems, Inc. |
| Sector: Technology | |
| SubSector: Business Software & Services | |
| MarketCap: 1657.28 Millions | |
| Recent Price: 19.43 Smart Investing & Trading Score: 42 | |
| Day Percent Change: 1.89% Day Change: 0.36 | |
| Week Change: -1.27% Year-to-date Change: -11.5% | |
| NTCT Links: Profile News Message Board | |
| Charts:- Daily , Weekly | |
| Add NTCT to Watchlist: View: Get Complete NTCT Trend Analysis ➞ | |
 | TER Teradyne, Inc. |
| Sector: Technology | |
| SubSector: Semiconductor Equipment & Materials | |
| MarketCap: 8135.68 Millions | |
| Recent Price: 95.97 Smart Investing & Trading Score: 13 | |
| Day Percent Change: -4.22% Day Change: -4.23 | |
| Week Change: -9.35% Year-to-date Change: -11.6% | |
| TER Links: Profile News Message Board | |
| Charts:- Daily , Weekly | |
| Add TER to Watchlist: View: Get Complete TER Trend Analysis ➞ | |
 | HURC Hurco Companies, Inc. |
| Sector: Technology | |
| SubSector: Scientific & Technical Instruments | |
| MarketCap: 169.253 Millions | |
| Recent Price: 19.04 Smart Investing & Trading Score: 10 | |
| Day Percent Change: -1.40% Day Change: -0.27 | |
| Week Change: -1.14% Year-to-date Change: -11.6% | |
| HURC Links: Profile News Message Board | |
| Charts:- Daily , Weekly | |
| Add HURC to Watchlist: View: Get Complete HURC Trend Analysis ➞ | |
 | JD JD.com, Inc. |
| Sector: Technology | |
| SubSector: Internet Information Providers | |
| MarketCap: 59907.3 Millions | |
| Recent Price: 25.51 Smart Investing & Trading Score: 54 | |
| Day Percent Change: 0.20% Day Change: 0.05 | |
| Week Change: 0.47% Year-to-date Change: -11.7% | |
| JD Links: Profile News Message Board | |
| Charts:- Daily , Weekly | |
| Add JD to Watchlist: View: Get Complete JD Trend Analysis ➞ | |
 | BLKB Blackbaud, Inc. |
| Sector: Technology | |
| SubSector: Business Software & Services | |
| MarketCap: 2838.48 Millions | |
| Recent Price: 76.48 Smart Investing & Trading Score: 42 | |
| Day Percent Change: -0.30% Day Change: -0.23 | |
| Week Change: -0.31% Year-to-date Change: -11.8% | |
| BLKB Links: Profile News Message Board | |
| Charts:- Daily , Weekly | |
| Add BLKB to Watchlist: View: Get Complete BLKB Trend Analysis ➞ | |
 | MTCH Match Group, Inc. |
| Sector: Technology | |
| SubSector: Internet Information Providers | |
| MarketCap: 14655.8 Millions | |
| Recent Price: 32.18 Smart Investing & Trading Score: 37 | |
| Day Percent Change: -0.12% Day Change: -0.04 | |
| Week Change: -1.53% Year-to-date Change: -11.8% | |
| MTCH Links: Profile News Message Board | |
| Charts:- Daily , Weekly | |
| Add MTCH to Watchlist: View: Get Complete MTCH Trend Analysis ➞ | |
 | DXC DXC Technology Company |
| Sector: Technology | |
| SubSector: Information Technology Services | |
| MarketCap: 3622.28 Millions | |
| Recent Price: 20.14 Smart Investing & Trading Score: 52 | |
| Day Percent Change: 2.86% Day Change: 0.56 | |
| Week Change: -0.79% Year-to-date Change: -11.9% | |
| DXC Links: Profile News Message Board | |
| Charts:- Daily , Weekly | |
| Add DXC to Watchlist: View: Get Complete DXC Trend Analysis ➞ | |
 | PGNY Progyny, Inc. |
| Sector: Technology | |
| SubSector: Healthcare Information Services | |
| MarketCap: 1839.05 Millions | |
| Recent Price: 32.68 Smart Investing & Trading Score: 10 | |
| Day Percent Change: 2.51% Day Change: 0.80 | |
| Week Change: -4.44% Year-to-date Change: -12.1% | |
| PGNY Links: Profile News Message Board | |
| Charts:- Daily , Weekly | |
| Add PGNY to Watchlist: View: Get Complete PGNY Trend Analysis ➞ | |
 | DUOL Duolingo, Inc. |
| Sector: Technology | |
| SubSector: Software - Application | |
| MarketCap: 6070 Millions | |
| Recent Price: 200.15 Smart Investing & Trading Score: 51 | |
| Day Percent Change: -4.80% Day Change: -10.09 | |
| Week Change: -5.16% Year-to-date Change: -12.2% | |
| DUOL Links: Profile News Message Board | |
| Charts:- Daily , Weekly | |
| Add DUOL to Watchlist: View: Get Complete DUOL Trend Analysis ➞ | |
 | SATS EchoStar Corporation |
| Sector: Technology | |
| SubSector: Communication Equipment | |
| MarketCap: 3175.69 Millions | |
| Recent Price: 14.55 Smart Investing & Trading Score: 100 | |
| Day Percent Change: -0.07% Day Change: -0.01 | |
| Week Change: 2.46% Year-to-date Change: -12.2% | |
| SATS Links: Profile News Message Board | |
| Charts:- Daily , Weekly | |
| Add SATS to Watchlist: View: Get Complete SATS Trend Analysis ➞ | |
 | DOCN DigitalOcean Holdings, Inc. |
| Sector: Technology | |
| SubSector: Software - Infrastructure | |
| MarketCap: 3620 Millions | |
| Recent Price: 32.43 Smart Investing & Trading Score: 10 | |
| Day Percent Change: -3.11% Day Change: -1.04 | |
| Week Change: -7.63% Year-to-date Change: -12.3% | |
| DOCN Links: Profile News Message Board | |
| Charts:- Daily , Weekly | |
| Add DOCN to Watchlist: View: Get Complete DOCN Trend Analysis ➞ | |
 | UMC United Microelectronics Corporation |
| Sector: Technology | |
| SubSector: Semiconductor Equipment & Materials | |
| MarketCap: 5672.78 Millions | |
| Recent Price: 7.40 Smart Investing & Trading Score: 0 | |
| Day Percent Change: -1.73% Day Change: -0.13 | |
| Week Change: -7.15% Year-to-date Change: -12.5% | |
| UMC Links: Profile News Message Board | |
| Charts:- Daily , Weekly | |
| Add UMC to Watchlist: View: Get Complete UMC Trend Analysis ➞ | |
 | ALGM Allegro MicroSystems, Inc. |
| Sector: Technology | |
| SubSector: Semiconductors | |
| MarketCap: 50287 Millions | |
| Recent Price: 26.48 Smart Investing & Trading Score: 43 | |
| Day Percent Change: 0.23% Day Change: 0.06 | |
| Week Change: -1.34% Year-to-date Change: -12.6% | |
| ALGM Links: Profile News Message Board | |
| Charts:- Daily , Weekly | |
| Add ALGM to Watchlist: View: Get Complete ALGM Trend Analysis ➞ | |
| For tabular summary view of above stock list: Summary View ➞ 0 - 25 , 25 - 50 , 50 - 75 , 75 - 100 , 100 - 125 , 125 - 150 , 150 - 175 , 175 - 200 , 200 - 225 , 225 - 250 , 250 - 275 , 275 - 300 , 300 - 325 , 325 - 350 , 350 - 375 , 375 - 400 , 400 - 425 , 425 - 450 , 450 - 475 , 475 - 500 , 500 - 525 , 525 - 550 , 550 - 575 , 575 - 600 , 600 - 625 , 625 - 650 | ||
| Click To Change The Sort Order: By Market Cap or Company Size Performance: Year-to-date, Week and Day | |
| Select Chart Type: | ||
|
Best Stocks Today 12Stocks.com |
© 2024 12Stocks.com Terms & Conditions Privacy Contact Us
All Information Provided Only For Education And Not To Be Used For Investing or Trading. See Terms & Conditions


One More Thing ... Get Best Stocks Delivered Daily!
Never Ever Miss A Move With Our Top Ten Stocks Lists
Find Best Stocks In Any Market - Bull or Bear Market
Take A Peek At Our Top Ten Stocks Lists: Daily, Weekly, Year-to-Date & Top Trends
Find Best Stocks In Any Market - Bull or Bear Market
Take A Peek At Our Top Ten Stocks Lists: Daily, Weekly, Year-to-Date & Top Trends
Technology Stocks With Best Up Trends [0-bearish to 100-bullish]: Karooooo [100], EchoStar [100], Badger Meter[100], Full Truck[93], Turkcell Iletisim[93], Grab [93], Zuora [93], GDS [88], GigaCloud [88], Criteo S.A[83], So-Young [83]
Best Technology Stocks Year-to-Date:
Pagaya [589.78%], MediaCo Holding[544.37%], CXApp [168.73%], Smith Micro[151.82%], Super Micro[151.06%], Uxin [141.08%], CuriosityStream [107.37%], GigaCloud [89.46%], MicroStrategy [85.89%], NextNav [83.37%], D-Wave Quantum[81.22%] Best Technology Stocks This Week:
Snap One[29.73%], Badger Meter[15.61%], Mynaric AG[13.08%], Expensify [11.56%], Iridium [11.07%], NextNav [10.12%], Encore Wire[8.97%], Quhuo [8.87%], Bentley Systems[7.96%], Applied Optoelectronics[7.93%], Zuora [7.56%] Best Technology Stocks Daily:
Markforged Holding[16.32%], CuriosityStream [10.89%], CXApp [9.78%], Iridium [5.14%], Cheetah Mobile[5.04%], Aerohive Networks[4.23%], Materialise NV[3.98%], Applied Optoelectronics[3.95%], QuinStreet [3.70%], ATN [3.58%], MediaCo Holding[3.58%]