
 Login Sign Up


| |||||
 |  | ||||

| 12Stocks.com Market Intelligence |
Best SmallCap Stocks
|
| In a hurry? Small Cap Stock Lists: Performance Trends Table, Stock Charts
Sort Small Cap stocks: Daily, Weekly, Year-to-Date, Market Cap & Trends. Filter Small Cap stocks list by sector: Show all, Tech, Finance, Energy, Staples, Retail, Industrial, Materials, Utilities and HealthCare Filter Small Cap stocks list by size: All Large Medium Small and MicroCap |
| 12Stocks.com Small Cap Stocks Performances & Trends Daily | |||||||||
|
|  The overall Smart Investing & Trading Score is 49 (0-bearish to 100-bullish) which puts Small Cap index in short term neutral trend. The Smart Investing & Trading Score from previous trading session is 14 and hence an improvement of trend.
| ||||||||
Here are the Smart Investing & Trading Scores of the most requested small cap stocks at 12Stocks.com (click stock name for detailed review):
|


| 12Stocks.com: Investing in Smallcap Index with Stocks | |
|
The following table helps investors and traders sort through current performance and trends (as measured by Smart Investing & Trading Score) of various
stocks in the Smallcap Index. Quick View: Move mouse or cursor over stock symbol (ticker) to view short-term technical chart and over stock name to view long term chart. Click on  to add stock symbol to your watchlist and to add stock symbol to your watchlist and  to view watchlist. Click on any ticker or stock name for detailed market intelligence report for that stock. to view watchlist. Click on any ticker or stock name for detailed market intelligence report for that stock. |
12Stocks.com Performance of Stocks in Smallcap Index
| Ticker | Stock Name | Watchlist | Category | Recent Price | Smart Investing & Trading Score | Change % | YTD Change% |
| ALDX | Aldeyra |   | Health Care | 4.21 | 73 | 0.24% | 19.94% |
| AMPY | Amplify Energy | | Energy | 7.07 | 53 | 5.21% | 19.22% |
| TSQ | Townsquare Media | | Services & Goods | 12.47 | 60 | 4.35% | 18.09% |
| IDYA | IDEAYA Biosciences | | Health Care | 41.47 | 57 | 0.70% | 16.55% |
| KODK | Eastman Kodak | | Technology | 4.53 | 15 | 2.26% | 16.15% |
| RCKY | Rocky Brands | | Consumer Staples | 34.00 | 93 | 2.75% | 12.66% |
| MACK | Merrimack | | Health Care | 15.03 | 90 | 0.33% | 12.08% |
| LINC | Loln Educational | | Services & Goods | 11.23 | 95 | 4.47% | 11.85% |
| UEC | Uranium Energy | | Materials | 7.12 | 75 | 4.09% | 11.25% |
| IDT | IDT | | Technology | 37.64 | 52 | 3.01% | 10.41% |
| CLFD | Clearfield | | Technology | 31.91 | 95 | 3.14% | 9.73% |
| RM | Regional Management | | Financials | 27.32 | 100 | 8.03% | 8.93% |
| GENC | Gencor Industries | | Industrials | 17.46 | 95 | 0.29% | 8.18% |
| LQDA | Liquidia | | Health Care | 12.97 | 32 | -1.52% | 7.81% |
| ABUS | Arbutus Biopharma | | Health Care | 2.68 | 17 | -0.37% | 7.20% |
| WLFC | Willis Lease | | Transports | 52.30 | 100 | 7.11% | 7.00% |
| KFS | Kingsway Financial | | Financials | 8.93 | 76 | 0.11% | 6.31% |
| SPY | SPDR S&P | | Utilities | 505.03 | 30 | 0.94% | 6.25% |
| LYTS | LSI Industries | | Industrials | 14.92 | 55 | 1.36% | 5.97% |
| NR | Newpark Resources | | Energy | 7.02 | 43 | 1.30% | 5.72% |
| SBOW | SilverBow Resources | | Energy | 30.59 | 53 | 4.87% | 5.19% |
| JILL | J.Jill | | Services & Goods | 26.90 | 73 | 3.54% | 4.34% |
| AGS | PlayAGS | | Services & Goods | 8.79 | 17 | 1.74% | 4.27% |
| BHR | Braemar Hotels | | Financials | 2.58 | 61 | -4.09% | 3.20% |
| LQDT | Liquidity Services | | Services & Goods | 17.75 | 24 | 2.01% | 3.14% |
| For chart view version of above stock list: Chart View ➞ 0 - 25 , 25 - 50 , 50 - 75 , 75 - 100 , 100 - 125 , 125 - 150 , 150 - 175 , 175 - 200 | ||
 | Click To Change The Sort Order: By Market Cap or Company Size Performance: Year-to-date, Week and Day |  |
| Too many stocks? View smallcap stocks filtered by marketcap & sector |
| Marketcap: All SmallCap Stocks (default-no microcap), Large, Mid-Range, Small |
| Smallcap Sector: Tech, Finance, Energy, Staples, Retail, Industrial, Materials, & Medical |
|
Get the most comprehensive stock market coverage daily at 12Stocks.com ➞ Best Stocks Today ➞ Best Stocks Weekly ➞ Best Stocks Year-to-Date ➞ Best Stocks Trends ➞  Best Stocks Today 12Stocks.com Best Nasdaq Stocks ➞ Best S&P 500 Stocks ➞ Best Tech Stocks ➞ Best Biotech Stocks ➞ |
| Detailed Overview of SmallCap Stocks |
| SmallCap Technical Overview, Leaders & Laggards, Top SmallCap ETF Funds & Detailed SmallCap Stocks List, Charts, Trends & More |
| Smallcap: Technical Analysis, Trends & YTD Performance | |
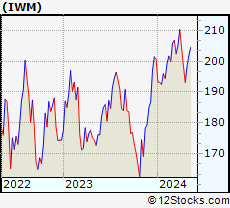
| SmallCap segment as represented by
IWM, an exchange-traded fund [ETF], holds basket of thousands of smallcap stocks from across all major sectors of the US stock market. The smallcap index (contains stocks like Riverbed & Sotheby's) is down by -0.39% and is currently underperforming the overall market by -6.01% year-to-date. Below is a quick view of technical charts and trends: | |
 IWM Weekly Chart |
|
| Long Term Trend: Not Good | |
| Medium Term Trend: Good | |
 IWM Daily Chart |
|
| Short Term Trend: Deteriorating | |
| Overall Trend Score: 49 | |
| YTD Performance: -0.39% | |
| **Trend Scores & Views Are Only For Educational Purposes And Not For Investing | |
| 12Stocks.com: Top Performing Small Cap Index Stocks | ||||||||||||||||||||||||||||||||||||||||||||||||
 The top performing Small Cap Index stocks year to date are
Now, more recently, over last week, the top performing Small Cap Index stocks on the move are


|
||||||||||||||||||||||||||||||||||||||||||||||||
| 12Stocks.com: Investing in Smallcap Index using Exchange Traded Funds | |
|
The following table shows list of key exchange traded funds (ETF) that
help investors track Smallcap index. The following list also includes leveraged ETF funds that track twice or thrice the daily returns of Smallcap indices. Short or inverse ETF funds move in the opposite direction to the index they track and are useful during market pullbacks or during bear markets. Quick View: Move mouse or cursor over ETF symbol (ticker) to view short-term technical chart and over ETF name to view long term chart. Click on ticker or stock name for detailed view. Click on to add stock symbol to your watchlist and to view watchlist. |
12Stocks.com List of ETFs that track Smallcap Index
| Ticker | ETF Name | Watchlist | Recent Price | Smart Investing & Trading Score | Change % | Week % | Year-to-date % |
| IWM | iShares Russell 2000 | | 199.92 | 49 | 1.84 | 0.77 | -0.39% |
| IJR | iShares Core S&P Small-Cap | | 106.33 | 50 | 1.52 | 0.64 | -1.77% |
| VTWO | Vanguard Russell 2000 ETF | | 80.85 | 7 | 1.88 | 0.79 | -0.31% |
| IWN | iShares Russell 2000 Value | | 152.88 | 57 | 2.04 | 1.15 | -1.58% |
| IWO | iShares Russell 2000 Growth | | 254.34 | 17 | 1.91 | 0.49 | 0.84% |
| IJS | iShares S&P Small-Cap 600 Value | | 98.02 | 13 | 1.68 | 0.85 | -4.9% |
| IJT | iShares S&P Small-Cap 600 Growth | | 126.72 | 20 | 1.42 | 0.5 | 1.26% |
| XSLV | PowerShares S&P SmallCap Low Volatil ETF | | 43.14 | 42 | 0.72 | 0.98 | -2.29% |
| SDD | ProShares UltraShort SmallCap600 | | 19.31 | 61 | -2.02 | -0.21 | 4.79% |
| SMLV | SPDR SSGA US Small Cap Low Volatil ETF | | 108.83 | 44 | 1.30 | 1.22 | -3.27% |
| SAA | ProShares Ultra SmallCap600 | | 22.93 | 32 | 1.56 | -0.46 | -8.08% |
| SBB | ProShares Short SmallCap600 | | 16.37 | 71 | -1.14 | -0.09 | 2.76% |
| 12Stocks.com: Charts, Trends, Fundamental Data and Performances of SmallCap Stocks | |
|
We now take in-depth look at all SmallCap stocks including charts, multi-period performances and overall trends (as measured by Smart Investing & Trading Score). One can sort SmallCap stocks (click link to choose) by Daily, Weekly and by Year-to-Date performances. Also, one can sort by size of the company or by market capitalization. |
| Select Your Default Chart Type: | |||||
| |||||
| Click on stock symbol or name for detailed view. Click on to add stock symbol to your watchlist and to view watchlist. Quick View: Move mouse or cursor over "Daily" to quickly view daily technical stock chart and over "Weekly" to view weekly technical stock chart. | |||||

 | ALDX Aldeyra Therapeutics, Inc. |
| Sector: Health Care | |
| SubSector: Biotechnology | |
| MarketCap: 61.2785 Millions | |
| Recent Price: 4.21 Smart Investing & Trading Score: 73 | |
| Day Percent Change: 0.24% Day Change: 0.01 | |
| Week Change: 7.12% Year-to-date Change: 19.9% | |
| ALDX Links: Profile News Message Board | |
| Charts:- Daily , Weekly | |
| Add ALDX to Watchlist: View: Get Complete ALDX Trend Analysis ➞ | |
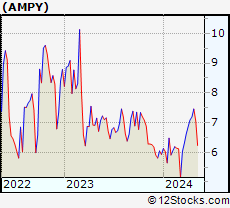 | AMPY Amplify Energy Corp. |
| Sector: Energy | |
| SubSector: Independent Oil & Gas | |
| MarketCap: 34.2593 Millions | |
| Recent Price: 7.07 Smart Investing & Trading Score: 53 | |
| Day Percent Change: 5.21% Day Change: 0.35 | |
| Week Change: -5.23% Year-to-date Change: 19.2% | |
| AMPY Links: Profile News Message Board | |
| Charts:- Daily , Weekly | |
| Add AMPY to Watchlist: View: Get Complete AMPY Trend Analysis ➞ | |
 | TSQ Townsquare Media, Inc. |
| Sector: Services & Goods | |
| SubSector: Broadcasting - Radio | |
| MarketCap: 101.795 Millions | |
| Recent Price: 12.47 Smart Investing & Trading Score: 60 | |
| Day Percent Change: 4.35% Day Change: 0.52 | |
| Week Change: 1.88% Year-to-date Change: 18.1% | |
| TSQ Links: Profile News Message Board | |
| Charts:- Daily , Weekly | |
| Add TSQ to Watchlist: View: Get Complete TSQ Trend Analysis ➞ | |
 | IDYA IDEAYA Biosciences, Inc. |
| Sector: Health Care | |
| SubSector: Biotechnology | |
| MarketCap: 89.1785 Millions | |
| Recent Price: 41.47 Smart Investing & Trading Score: 57 | |
| Day Percent Change: 0.70% Day Change: 0.29 | |
| Week Change: 3.83% Year-to-date Change: 16.6% | |
| IDYA Links: Profile News Message Board | |
| Charts:- Daily , Weekly | |
| Add IDYA to Watchlist: View: Get Complete IDYA Trend Analysis ➞ | |
 | KODK Eastman Kodak Company |
| Sector: Technology | |
| SubSector: Electronic Equipment | |
| MarketCap: 78.47 Millions | |
| Recent Price: 4.53 Smart Investing & Trading Score: 15 | |
| Day Percent Change: 2.26% Day Change: 0.10 | |
| Week Change: 0.22% Year-to-date Change: 16.2% | |
| KODK Links: Profile News Message Board | |
| Charts:- Daily , Weekly | |
| Add KODK to Watchlist: View: Get Complete KODK Trend Analysis ➞ | |
 | RCKY Rocky Brands, Inc. |
| Sector: Consumer Staples | |
| SubSector: Textile - Apparel Footwear & Accessories | |
| MarketCap: 137.47 Millions | |
| Recent Price: 34.00 Smart Investing & Trading Score: 93 | |
| Day Percent Change: 2.75% Day Change: 0.91 | |
| Week Change: 28.35% Year-to-date Change: 12.7% | |
| RCKY Links: Profile News Message Board | |
| Charts:- Daily , Weekly | |
| Add RCKY to Watchlist: View: Get Complete RCKY Trend Analysis ➞ | |
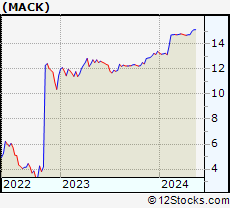 | MACK Merrimack Pharmaceuticals, Inc. |
| Sector: Health Care | |
| SubSector: Biotechnology | |
| MarketCap: 23.4785 Millions | |
| Recent Price: 15.03 Smart Investing & Trading Score: 90 | |
| Day Percent Change: 0.33% Day Change: 0.05 | |
| Week Change: 2.04% Year-to-date Change: 12.1% | |
| MACK Links: Profile News Message Board | |
| Charts:- Daily , Weekly | |
| Add MACK to Watchlist: View: Get Complete MACK Trend Analysis ➞ | |
 | LINC Lincoln Educational Services Corporation |
| Sector: Services & Goods | |
| SubSector: Education & Training Services | |
| MarketCap: 59.5006 Millions | |
| Recent Price: 11.23 Smart Investing & Trading Score: 95 | |
| Day Percent Change: 4.47% Day Change: 0.48 | |
| Week Change: 11.08% Year-to-date Change: 11.9% | |
| LINC Links: Profile News Message Board | |
| Charts:- Daily , Weekly | |
| Add LINC to Watchlist: View: Get Complete LINC Trend Analysis ➞ | |
 | UEC Uranium Energy Corp. |
| Sector: Materials | |
| SubSector: Industrial Metals & Minerals | |
| MarketCap: 138.91 Millions | |
| Recent Price: 7.12 Smart Investing & Trading Score: 75 | |
| Day Percent Change: 4.09% Day Change: 0.28 | |
| Week Change: 3.04% Year-to-date Change: 11.3% | |
| UEC Links: Profile News Message Board | |
| Charts:- Daily , Weekly | |
| Add UEC to Watchlist: View: Get Complete UEC Trend Analysis ➞ | |
 | IDT IDT Corporation |
| Sector: Technology | |
| SubSector: Diversified Communication Services | |
| MarketCap: 130.064 Millions | |
| Recent Price: 37.64 Smart Investing & Trading Score: 52 | |
| Day Percent Change: 3.01% Day Change: 1.10 | |
| Week Change: 4.12% Year-to-date Change: 10.4% | |
| IDT Links: Profile News Message Board | |
| Charts:- Daily , Weekly | |
| Add IDT to Watchlist: View: Get Complete IDT Trend Analysis ➞ | |
 | CLFD Clearfield, Inc. |
| Sector: Technology | |
| SubSector: Communication Equipment | |
| MarketCap: 138.439 Millions | |
| Recent Price: 31.91 Smart Investing & Trading Score: 95 | |
| Day Percent Change: 3.14% Day Change: 0.97 | |
| Week Change: 8.13% Year-to-date Change: 9.7% | |
| CLFD Links: Profile News Message Board | |
| Charts:- Daily , Weekly | |
| Add CLFD to Watchlist: View: Get Complete CLFD Trend Analysis ➞ | |
 | RM Regional Management Corp. |
| Sector: Financials | |
| SubSector: Credit Services | |
| MarketCap: 148.008 Millions | |
| Recent Price: 27.32 Smart Investing & Trading Score: 100 | |
| Day Percent Change: 8.03% Day Change: 2.03 | |
| Week Change: 3.41% Year-to-date Change: 8.9% | |
| RM Links: Profile News Message Board | |
| Charts:- Daily , Weekly | |
| Add RM to Watchlist: View: Get Complete RM Trend Analysis ➞ | |
 | GENC Gencor Industries, Inc. |
| Sector: Industrials | |
| SubSector: Farm & Construction Machinery | |
| MarketCap: 147.607 Millions | |
| Recent Price: 17.46 Smart Investing & Trading Score: 95 | |
| Day Percent Change: 0.29% Day Change: 0.05 | |
| Week Change: 2.89% Year-to-date Change: 8.2% | |
| GENC Links: Profile News Message Board | |
| Charts:- Daily , Weekly | |
| Add GENC to Watchlist: View: Get Complete GENC Trend Analysis ➞ | |
 | LQDA Liquidia Technologies, Inc. |
| Sector: Health Care | |
| SubSector: Biotechnology | |
| MarketCap: 80.4785 Millions | |
| Recent Price: 12.97 Smart Investing & Trading Score: 32 | |
| Day Percent Change: -1.52% Day Change: -0.20 | |
| Week Change: 3.51% Year-to-date Change: 7.8% | |
| LQDA Links: Profile News Message Board | |
| Charts:- Daily , Weekly | |
| Add LQDA to Watchlist: View: Get Complete LQDA Trend Analysis ➞ | |
 | ABUS Arbutus Biopharma Corporation |
| Sector: Health Care | |
| SubSector: Biotechnology | |
| MarketCap: 110.885 Millions | |
| Recent Price: 2.68 Smart Investing & Trading Score: 17 | |
| Day Percent Change: -0.37% Day Change: -0.01 | |
| Week Change: -1.83% Year-to-date Change: 7.2% | |
| ABUS Links: Profile News Message Board | |
| Charts:- Daily , Weekly | |
| Add ABUS to Watchlist: View: Get Complete ABUS Trend Analysis ➞ | |
 | WLFC Willis Lease Finance Corporation |
| Sector: Transports | |
| SubSector: Rental & Leasing Services | |
| MarketCap: 122.044 Millions | |
| Recent Price: 52.30 Smart Investing & Trading Score: 100 | |
| Day Percent Change: 7.11% Day Change: 3.47 | |
| Week Change: 6.63% Year-to-date Change: 7.0% | |
| WLFC Links: Profile News Message Board | |
| Charts:- Daily , Weekly | |
| Add WLFC to Watchlist: View: Get Complete WLFC Trend Analysis ➞ | |
 | KFS Kingsway Financial Services Inc. |
| Sector: Financials | |
| SubSector: Property & Casualty Insurance | |
| MarketCap: 47.5812 Millions | |
| Recent Price: 8.93 Smart Investing & Trading Score: 76 | |
| Day Percent Change: 0.11% Day Change: 0.01 | |
| Week Change: 4.08% Year-to-date Change: 6.3% | |
| KFS Links: Profile News Message Board | |
| Charts:- Daily , Weekly | |
| Add KFS to Watchlist: View: Get Complete KFS Trend Analysis ➞ | |
 | SPY SPDR S&P 500 ETF |
| Sector: Utilities | |
| SubSector: Exchange Traded Fund | |
| MarketCap: 0 Millions | |
| Recent Price: 505.03 Smart Investing & Trading Score: 30 | |
| Day Percent Change: 0.94% Day Change: 4.68 | |
| Week Change: -0.64% Year-to-date Change: 6.3% | |
| SPY Links: Profile News Message Board | |
| Charts:- Daily , Weekly | |
| Add SPY to Watchlist: View: Get Complete SPY Trend Analysis ➞ | |
 | LYTS LSI Industries Inc. |
| Sector: Industrials | |
| SubSector: Industrial Electrical Equipment | |
| MarketCap: 85.7879 Millions | |
| Recent Price: 14.92 Smart Investing & Trading Score: 55 | |
| Day Percent Change: 1.36% Day Change: 0.20 | |
| Week Change: 1.02% Year-to-date Change: 6.0% | |
| LYTS Links: Profile News Message Board | |
| Charts:- Daily , Weekly | |
| Add LYTS to Watchlist: View: Get Complete LYTS Trend Analysis ➞ | |
 | NR Newpark Resources, Inc. |
| Sector: Energy | |
| SubSector: Oil & Gas Equipment & Services | |
| MarketCap: 109.261 Millions | |
| Recent Price: 7.02 Smart Investing & Trading Score: 43 | |
| Day Percent Change: 1.30% Day Change: 0.09 | |
| Week Change: -3.44% Year-to-date Change: 5.7% | |
| NR Links: Profile News Message Board | |
| Charts:- Daily , Weekly | |
| Add NR to Watchlist: View: Get Complete NR Trend Analysis ➞ | |
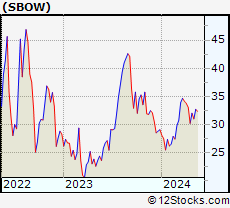 | SBOW SilverBow Resources, Inc. |
| Sector: Energy | |
| SubSector: Independent Oil & Gas | |
| MarketCap: 25.9593 Millions | |
| Recent Price: 30.59 Smart Investing & Trading Score: 53 | |
| Day Percent Change: 4.87% Day Change: 1.42 | |
| Week Change: -4.5% Year-to-date Change: 5.2% | |
| SBOW Links: Profile News Message Board | |
| Charts:- Daily , Weekly | |
| Add SBOW to Watchlist: View: Get Complete SBOW Trend Analysis ➞ | |
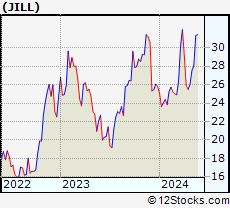 | JILL J.Jill, Inc. |
| Sector: Services & Goods | |
| SubSector: Apparel Stores | |
| MarketCap: 38.7408 Millions | |
| Recent Price: 26.90 Smart Investing & Trading Score: 73 | |
| Day Percent Change: 3.54% Day Change: 0.92 | |
| Week Change: 3.42% Year-to-date Change: 4.3% | |
| JILL Links: Profile News Message Board | |
| Charts:- Daily , Weekly | |
| Add JILL to Watchlist: View: Get Complete JILL Trend Analysis ➞ | |
 | AGS PlayAGS, Inc. |
| Sector: Services & Goods | |
| SubSector: Gaming Activities | |
| MarketCap: 77.1289 Millions | |
| Recent Price: 8.79 Smart Investing & Trading Score: 17 | |
| Day Percent Change: 1.74% Day Change: 0.15 | |
| Week Change: -1.35% Year-to-date Change: 4.3% | |
| AGS Links: Profile News Message Board | |
| Charts:- Daily , Weekly | |
| Add AGS to Watchlist: View: Get Complete AGS Trend Analysis ➞ | |
 | BHR Braemar Hotels & Resorts, Inc. |
| Sector: Financials | |
| SubSector: REIT - Hotel/Motel | |
| MarketCap: 88.9434 Millions | |
| Recent Price: 2.58 Smart Investing & Trading Score: 61 | |
| Day Percent Change: -4.09% Day Change: -0.11 | |
| Week Change: -7.53% Year-to-date Change: 3.2% | |
| BHR Links: Profile News Message Board | |
| Charts:- Daily , Weekly | |
| Add BHR to Watchlist: View: Get Complete BHR Trend Analysis ➞ | |
 | LQDT Liquidity Services, Inc. |
| Sector: Services & Goods | |
| SubSector: Catalog & Mail Order Houses | |
| MarketCap: 144.492 Millions | |
| Recent Price: 17.75 Smart Investing & Trading Score: 24 | |
| Day Percent Change: 2.01% Day Change: 0.35 | |
| Week Change: 1.89% Year-to-date Change: 3.1% | |
| LQDT Links: Profile News Message Board | |
| Charts:- Daily , Weekly | |
| Add LQDT to Watchlist: View: Get Complete LQDT Trend Analysis ➞ | |
| For tabular summary view of above stock list: Summary View ➞ 0 - 25 , 25 - 50 , 50 - 75 , 75 - 100 , 100 - 125 , 125 - 150 , 150 - 175 , 175 - 200 | ||
| Click To Change The Sort Order: By Market Cap or Company Size Performance: Year-to-date, Week and Day | |
| Select Chart Type: | ||
| Too many stocks? View smallcap stocks filtered by marketcap & sector |
| Marketcap: All SmallCap Stocks (default-no microcap), Large, Mid-Range, Small & MicroCap |
| Sector: Tech, Finance, Energy, Staples, Retail, Industrial, Materials, Utilities & Medical |
|
Best Stocks Today 12Stocks.com |
© 2024 12Stocks.com Terms & Conditions Privacy Contact Us
All Information Provided Only For Education And Not To Be Used For Investing or Trading. See Terms & Conditions


One More Thing ... Get Best Stocks Delivered Daily!
Never Ever Miss A Move With Our Top Ten Stocks Lists
Find Best Stocks In Any Market - Bull or Bear Market
Take A Peek At Our Top Ten Stocks Lists: Daily, Weekly, Year-to-Date & Top Trends
Find Best Stocks In Any Market - Bull or Bear Market
Take A Peek At Our Top Ten Stocks Lists: Daily, Weekly, Year-to-Date & Top Trends
Smallcap Stocks With Best Up Trends [0-bearish to 100-bullish]: Emergent BioSolutions[100], Aspen Aerogels[100], Perdoceo Education[100], Gannett Co[100], Pitney Bowes[100], Benchmark Electronics[100], Origin Materials[100], FormFactor [100], Lantheus [100], Q2 [100], Blueprint Medicines[100]
Best Smallcap Stocks Year-to-Date:
Janux [440.16%], Viking [307.09%], Longboard [273.98%], Alpine Immune[239.23%], Bakkt [187.89%], Avidity Biosciences[182.96%], Vera [170.74%], Cullinan Oncology[169.74%], Super Micro[168.25%], Arcutis Bio[166.25%], Y-mAbs [152.93%] Best Smallcap Stocks This Week:
Deciphera [73.24%], Emergent BioSolutions[71.88%], Eyenovia [48.36%], Aspen Aerogels[48.14%], P3 Health[38.51%], Carvana Co[38.18%], Cue Biopharma[37.73%], Origin Materials[36.24%], TransMedics Group[35.14%], Seres [34.55%], Enovix [32.07%] Best Smallcap Stocks Daily:
Emergent BioSolutions[70.98%], Aspen Aerogels[56.70%], Carvana Co[33.77%], Perdoceo Education[31.46%], Enovix [31.06%], Office Properties[28.00%], Gannett Co[26.97%], Sunnova Energy[25.21%], Pitney Bowes[24.70%], Pulmonx [21.37%], CommScope Holding[20.95%]