
 Login Sign Up


| |||||
 |  | ||||

| 12Stocks.com Market Intelligence |
Best SmallCap Stocks
|
| In a hurry? Small Cap Stock Lists: Performance Trends Table, Stock Charts
Sort Small Cap stocks: Daily, Weekly, Year-to-Date, Market Cap & Trends. Filter Small Cap stocks list by sector: Show all, Tech, Finance, Energy, Staples, Retail, Industrial, Materials, Utilities and HealthCare Filter Small Cap stocks list by size: All Large Medium Small and MicroCap |
| 12Stocks.com Small Cap Stocks Performances & Trends Daily | |||||||||
|
|  The overall Smart Investing & Trading Score is 90 (0-bearish to 100-bullish) which puts Small Cap index in short term bullish trend. The Smart Investing & Trading Score from previous trading session is 100 and hence a deterioration of trend.
| ||||||||
Here are the Smart Investing & Trading Scores of the most requested small cap stocks at 12Stocks.com (click stock name for detailed review):
|


| 12Stocks.com: Investing in Smallcap Index with Stocks | |
|
The following table helps investors and traders sort through current performance and trends (as measured by Smart Investing & Trading Score) of various
stocks in the Smallcap Index. Quick View: Move mouse or cursor over stock symbol (ticker) to view short-term technical chart and over stock name to view long term chart. Click on  to add stock symbol to your watchlist and to add stock symbol to your watchlist and  to view watchlist. Click on any ticker or stock name for detailed market intelligence report for that stock. to view watchlist. Click on any ticker or stock name for detailed market intelligence report for that stock. |
12Stocks.com Performance of Stocks in Smallcap Index
| Ticker | Stock Name | Watchlist | Category | Recent Price | Smart Investing & Trading Score | Change % | YTD Change% |
| ALPN | Alpine Immune |   | Health Care | 64.96 | 68 | -0.02% | 241.18% |
| TRVI | Trevi | | Health Care | 2.84 | 47 | 2.71% | 111.94% |
| ATNM | Actinium | | Health Care | 9.85 | 88 | 1.23% | 93.90% |
| JYNT | Joint | | Health Care | 17.52 | 90 | 2.94% | 82.31% |
| VERI | Veritone | | Technology | 3.12 | 36 | -3.41% | 71.43% |
| ASC | Ardmore Shipping | | Transports | 22.56 | 95 | 1.21% | 60.11% |
| KRUS | Kura Sushi | | Services & Goods | 116.08 | 100 | 8.80% | 52.58% |
| INOD | Innodata | | Technology | 12.18 | 95 | 3.18% | 49.57% |
| HEAR | Turtle Beach | | Technology | 16.14 | 73 | -3.59% | 47.35% |
| HROW | Harrow Health | | Health Care | 16.16 | 93 | 1.48% | 44.29% |
| SB | Safe Bulkers | | Transports | 5.58 | 88 | 2.39% | 41.98% |
| EGY | VAALCO Energy | | Energy | 6.26 | 68 | -0.87% | 39.53% |
| CRMD | CorMedix | | Health Care | 5.21 | 36 | -0.86% | 38.56% |
| ACTG | Acacia Research | | Services & Goods | 5.38 | 100 | 1.51% | 37.24% |
| SLCA | U.S. Silica | | Materials | 15.51 | 51 | -0.06% | 37.14% |
| AGS | PlayAGS | | Services & Goods | 11.56 | 90 | 1.05% | 37.13% |
| PMTS | CPI Card | | Financials | 25.64 | 100 | 2.03% | 33.61% |
| WLFC | Willis Lease | | Transports | 64.58 | 76 | -0.03% | 32.12% |
| BH | Biglari | | Services & Goods | 215.80 | 95 | 0.92% | 30.84% |
| BBW | Build-A-Bear Workshop | | Services & Goods | 29.95 | 83 | -1.19% | 30.27% |
| EOLS | Evolus | | Health Care | 13.70 | 69 | 3.47% | 30.10% |
| KODK | Eastman Kodak | | Technology | 5.05 | 74 | 0.60% | 29.49% |
| CLFD | Clearfield | | Technology | 37.02 | 90 | -2.55% | 27.30% |
| SBOW | SilverBow Resources | | Energy | 36.62 | 100 | 13.20% | 25.93% |
| GENC | Gencor Industries | | Industrials | 20.31 | 95 | 1.15% | 25.84% |
| For chart view version of above stock list: Chart View ➞ 0 - 25 , 25 - 50 , 50 - 75 , 75 - 100 , 100 - 125 , 125 - 150 , 150 - 175 , 175 - 200 | ||
 | Click To Change The Sort Order: By Market Cap or Company Size Performance: Year-to-date, Week and Day |  |
| Too many stocks? View smallcap stocks filtered by marketcap & sector |
| Marketcap: All SmallCap Stocks (default-no microcap), Large, Mid-Range, Small |
| Smallcap Sector: Tech, Finance, Energy, Staples, Retail, Industrial, Materials, & Medical |
|
Get the most comprehensive stock market coverage daily at 12Stocks.com ➞ Best Stocks Today ➞ Best Stocks Weekly ➞ Best Stocks Year-to-Date ➞ Best Stocks Trends ➞  Best Stocks Today 12Stocks.com Best Nasdaq Stocks ➞ Best S&P 500 Stocks ➞ Best Tech Stocks ➞ Best Biotech Stocks ➞ |
| Detailed Overview of SmallCap Stocks |
| SmallCap Technical Overview, Leaders & Laggards, Top SmallCap ETF Funds & Detailed SmallCap Stocks List, Charts, Trends & More |
| Smallcap: Technical Analysis, Trends & YTD Performance | |
| SmallCap segment as represented by
IWM, an exchange-traded fund [ETF], holds basket of thousands of smallcap stocks from across all major sectors of the US stock market. The smallcap index (contains stocks like Riverbed & Sotheby's) is up by 3.6% and is currently underperforming the overall market by -6.82% year-to-date. Below is a quick view of technical charts and trends: | |
 IWM Weekly Chart |
|
| Long Term Trend: Very Good | |
| Medium Term Trend: Very Good | |
 IWM Daily Chart |
|
| Short Term Trend: Good | |
| Overall Trend Score: 90 | |
| YTD Performance: 3.6% | |
| **Trend Scores & Views Are Only For Educational Purposes And Not For Investing | |
| 12Stocks.com: Top Performing Small Cap Index Stocks | ||||||||||||||||||||||||||||||||||||||||||||||||
 The top performing Small Cap Index stocks year to date are
Now, more recently, over last week, the top performing Small Cap Index stocks on the move are


|
||||||||||||||||||||||||||||||||||||||||||||||||
| 12Stocks.com: Investing in Smallcap Index using Exchange Traded Funds | |
|
The following table shows list of key exchange traded funds (ETF) that
help investors track Smallcap index. The following list also includes leveraged ETF funds that track twice or thrice the daily returns of Smallcap indices. Short or inverse ETF funds move in the opposite direction to the index they track and are useful during market pullbacks or during bear markets. Quick View: Move mouse or cursor over ETF symbol (ticker) to view short-term technical chart and over ETF name to view long term chart. Click on ticker or stock name for detailed view. Click on to add stock symbol to your watchlist and to view watchlist. |
12Stocks.com List of ETFs that track Smallcap Index
| Ticker | ETF Name | Watchlist | Recent Price | Smart Investing & Trading Score | Change % | Week % | Year-to-date % |
| IWM | iShares Russell 2000 | | 207.93 | 90 | -0.72 | 1.77 | 3.6% |
| VTWO | Vanguard Russell 2000 ETF | | 84.11 | 85 | -0.61 | 1.8 | 3.71% |
| IJR | iShares Core S&P Small-Cap | | 110.63 | 83 | -0.14 | 1.51 | 2.2% |
| IWN | iShares Russell 2000 Value | | 158.82 | 88 | 0.06 | 1.68 | 2.25% |
| IJT | iShares S&P Small-Cap 600 Growth | | 131.29 | 78 | -0.69 | 1.1 | 4.91% |
| IJS | iShares S&P Small-Cap 600 Value | | 102.02 | 83 | -0.11 | 1.49 | -1.02% |
| IWO | iShares Russell 2000 Growth | | 267.15 | 95 | 0.21 | 2.78 | 5.92% |
| XSLV | PowerShares S&P SmallCap Low Volatil ETF | | 44.48 | 76 | -0.02 | 0.57 | 0.75% |
| SBB | ProShares Short SmallCap600 | | 15.71 | 17 | 0.32 | -1.54 | -1.38% |
| SAA | ProShares Ultra SmallCap600 | | 24.78 | 71 | -1.69 | 1.77 | -0.68% |
| SMLV | SPDR SSGA US Small Cap Low Volatil ETF | | 112.79 | 95 | 0.22 | 1.41 | 0.24% |
| SDD | ProShares UltraShort SmallCap600 | | 17.67 | 27 | 0.00 | -3.34 | -4.11% |
| 12Stocks.com: Charts, Trends, Fundamental Data and Performances of SmallCap Stocks | |
|
We now take in-depth look at all SmallCap stocks including charts, multi-period performances and overall trends (as measured by Smart Investing & Trading Score). One can sort SmallCap stocks (click link to choose) by Daily, Weekly and by Year-to-Date performances. Also, one can sort by size of the company or by market capitalization. |
| Select Your Default Chart Type: | |||||
| |||||
| Click on stock symbol or name for detailed view. Click on to add stock symbol to your watchlist and to view watchlist. Quick View: Move mouse or cursor over "Daily" to quickly view daily technical stock chart and over "Weekly" to view weekly technical stock chart. | |||||

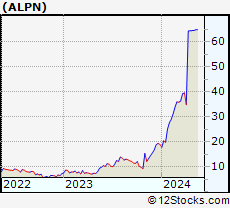 | ALPN Alpine Immune Sciences, Inc. |
| Sector: Health Care | |
| SubSector: Biotechnology | |
| MarketCap: 43.0785 Millions | |
| Recent Price: 64.96 Smart Investing & Trading Score: 68 | |
| Day Percent Change: -0.02% Day Change: -0.01 | |
| Week Change: 0.03% Year-to-date Change: 241.2% | |
| ALPN Links: Profile News Message Board | |
| Charts:- Daily , Weekly | |
| Add ALPN to Watchlist: View: Get Complete ALPN Trend Analysis ➞ | |
 | TRVI Trevi Therapeutics, Inc. |
| Sector: Health Care | |
| SubSector: Biotechnology | |
| MarketCap: 50.6785 Millions | |
| Recent Price: 2.84 Smart Investing & Trading Score: 47 | |
| Day Percent Change: 2.71% Day Change: 0.07 | |
| Week Change: 4.03% Year-to-date Change: 111.9% | |
| TRVI Links: Profile News Message Board | |
| Charts:- Daily , Weekly | |
| Add TRVI to Watchlist: View: Get Complete TRVI Trend Analysis ➞ | |
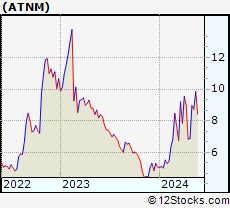 | ATNM Actinium Pharmaceuticals, Inc. |
| Sector: Health Care | |
| SubSector: Biotechnology | |
| MarketCap: 34.6785 Millions | |
| Recent Price: 9.85 Smart Investing & Trading Score: 88 | |
| Day Percent Change: 1.23% Day Change: 0.12 | |
| Week Change: 12.83% Year-to-date Change: 93.9% | |
| ATNM Links: Profile News Message Board | |
| Charts:- Daily , Weekly | |
| Add ATNM to Watchlist: View: Get Complete ATNM Trend Analysis ➞ | |
 | JYNT The Joint Corp. |
| Sector: Health Care | |
| SubSector: Hospitals | |
| MarketCap: 125.146 Millions | |
| Recent Price: 17.52 Smart Investing & Trading Score: 90 | |
| Day Percent Change: 2.94% Day Change: 0.50 | |
| Week Change: 6.57% Year-to-date Change: 82.3% | |
| JYNT Links: Profile News Message Board | |
| Charts:- Daily , Weekly | |
| Add JYNT to Watchlist: View: Get Complete JYNT Trend Analysis ➞ | |
 | VERI Veritone, Inc. |
| Sector: Technology | |
| SubSector: Application Software | |
| MarketCap: 52.1662 Millions | |
| Recent Price: 3.12 Smart Investing & Trading Score: 36 | |
| Day Percent Change: -3.41% Day Change: -0.11 | |
| Week Change: -0.95% Year-to-date Change: 71.4% | |
| VERI Links: Profile News Message Board | |
| Charts:- Daily , Weekly | |
| Add VERI to Watchlist: View: Get Complete VERI Trend Analysis ➞ | |
 | ASC Ardmore Shipping Corporation |
| Sector: Transports | |
| SubSector: Shipping | |
| MarketCap: 147.014 Millions | |
| Recent Price: 22.56 Smart Investing & Trading Score: 95 | |
| Day Percent Change: 1.21% Day Change: 0.27 | |
| Week Change: 10.75% Year-to-date Change: 60.1% | |
| ASC Links: Profile News Message Board | |
| Charts:- Daily , Weekly | |
| Add ASC to Watchlist: View: Get Complete ASC Trend Analysis ➞ | |
 | KRUS Kura Sushi USA, Inc. |
| Sector: Services & Goods | |
| SubSector: Restaurants | |
| MarketCap: 74.057 Millions | |
| Recent Price: 116.08 Smart Investing & Trading Score: 100 | |
| Day Percent Change: 8.80% Day Change: 9.39 | |
| Week Change: 3.74% Year-to-date Change: 52.6% | |
| KRUS Links: Profile News Message Board | |
| Charts:- Daily , Weekly | |
| Add KRUS to Watchlist: View: Get Complete KRUS Trend Analysis ➞ | |
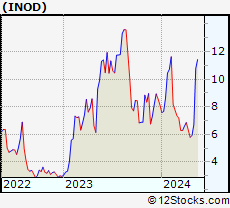 | INOD Innodata Inc. |
| Sector: Technology | |
| SubSector: Information Technology Services | |
| MarketCap: 19.9468 Millions | |
| Recent Price: 12.18 Smart Investing & Trading Score: 95 | |
| Day Percent Change: 3.18% Day Change: 0.38 | |
| Week Change: 12.94% Year-to-date Change: 49.6% | |
| INOD Links: Profile News Message Board | |
| Charts:- Daily , Weekly | |
| Add INOD to Watchlist: View: Get Complete INOD Trend Analysis ➞ | |
 | HEAR Turtle Beach Corporation |
| Sector: Technology | |
| SubSector: Communication Equipment | |
| MarketCap: 73.0539 Millions | |
| Recent Price: 16.14 Smart Investing & Trading Score: 73 | |
| Day Percent Change: -3.59% Day Change: -0.60 | |
| Week Change: 0.97% Year-to-date Change: 47.4% | |
| HEAR Links: Profile News Message Board | |
| Charts:- Daily , Weekly | |
| Add HEAR to Watchlist: View: Get Complete HEAR Trend Analysis ➞ | |
 | HROW Harrow Health, Inc. |
| Sector: Health Care | |
| SubSector: Drug Manufacturers - Other | |
| MarketCap: 104.033 Millions | |
| Recent Price: 16.16 Smart Investing & Trading Score: 93 | |
| Day Percent Change: 1.48% Day Change: 0.23 | |
| Week Change: 39.31% Year-to-date Change: 44.3% | |
| HROW Links: Profile News Message Board | |
| Charts:- Daily , Weekly | |
| Add HROW to Watchlist: View: Get Complete HROW Trend Analysis ➞ | |
 | SB Safe Bulkers, Inc. |
| Sector: Transports | |
| SubSector: Shipping | |
| MarketCap: 108.114 Millions | |
| Recent Price: 5.58 Smart Investing & Trading Score: 88 | |
| Day Percent Change: 2.39% Day Change: 0.13 | |
| Week Change: 2.57% Year-to-date Change: 42.0% | |
| SB Links: Profile News Message Board | |
| Charts:- Daily , Weekly | |
| Add SB to Watchlist: View: Get Complete SB Trend Analysis ➞ | |
 | EGY VAALCO Energy, Inc. |
| Sector: Energy | |
| SubSector: Independent Oil & Gas | |
| MarketCap: 59.5593 Millions | |
| Recent Price: 6.26 Smart Investing & Trading Score: 68 | |
| Day Percent Change: -0.87% Day Change: -0.06 | |
| Week Change: 1.05% Year-to-date Change: 39.5% | |
| EGY Links: Profile News Message Board | |
| Charts:- Daily , Weekly | |
| Add EGY to Watchlist: View: Get Complete EGY Trend Analysis ➞ | |
 | CRMD CorMedix, Inc. |
| Sector: Health Care | |
| SubSector: Biotechnology | |
| MarketCap: 90.7785 Millions | |
| Recent Price: 5.21 Smart Investing & Trading Score: 36 | |
| Day Percent Change: -0.86% Day Change: -0.04 | |
| Week Change: 0.77% Year-to-date Change: 38.6% | |
| CRMD Links: Profile News Message Board | |
| Charts:- Daily , Weekly | |
| Add CRMD to Watchlist: View: Get Complete CRMD Trend Analysis ➞ | |
 | ACTG Acacia Research Corporation |
| Sector: Services & Goods | |
| SubSector: Business Services | |
| MarketCap: 112.782 Millions | |
| Recent Price: 5.38 Smart Investing & Trading Score: 100 | |
| Day Percent Change: 1.51% Day Change: 0.08 | |
| Week Change: 5.91% Year-to-date Change: 37.2% | |
| ACTG Links: Profile News Message Board | |
| Charts:- Daily , Weekly | |
| Add ACTG to Watchlist: View: Get Complete ACTG Trend Analysis ➞ | |
 | SLCA U.S. Silica Holdings, Inc. |
| Sector: Materials | |
| SubSector: Industrial Metals & Minerals | |
| MarketCap: 93 Millions | |
| Recent Price: 15.51 Smart Investing & Trading Score: 51 | |
| Day Percent Change: -0.06% Day Change: -0.01 | |
| Week Change: -0.06% Year-to-date Change: 37.1% | |
| SLCA Links: Profile News Message Board | |
| Charts:- Daily , Weekly | |
| Add SLCA to Watchlist: View: Get Complete SLCA Trend Analysis ➞ | |
 | AGS PlayAGS, Inc. |
| Sector: Services & Goods | |
| SubSector: Gaming Activities | |
| MarketCap: 77.1289 Millions | |
| Recent Price: 11.56 Smart Investing & Trading Score: 90 | |
| Day Percent Change: 1.05% Day Change: 0.12 | |
| Week Change: 2.39% Year-to-date Change: 37.1% | |
| AGS Links: Profile News Message Board | |
| Charts:- Daily , Weekly | |
| Add AGS to Watchlist: View: Get Complete AGS Trend Analysis ➞ | |
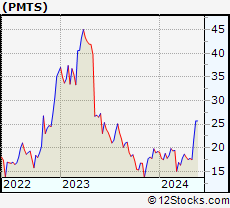 | PMTS CPI Card Group Inc. |
| Sector: Financials | |
| SubSector: Credit Services | |
| MarketCap: 7.78208 Millions | |
| Recent Price: 25.64 Smart Investing & Trading Score: 100 | |
| Day Percent Change: 2.03% Day Change: 0.51 | |
| Week Change: 17.4% Year-to-date Change: 33.6% | |
| PMTS Links: Profile News Message Board | |
| Charts:- Daily , Weekly | |
| Add PMTS to Watchlist: View: Get Complete PMTS Trend Analysis ➞ | |
 | WLFC Willis Lease Finance Corporation |
| Sector: Transports | |
| SubSector: Rental & Leasing Services | |
| MarketCap: 122.044 Millions | |
| Recent Price: 64.58 Smart Investing & Trading Score: 76 | |
| Day Percent Change: -0.03% Day Change: -0.02 | |
| Week Change: 1.52% Year-to-date Change: 32.1% | |
| WLFC Links: Profile News Message Board | |
| Charts:- Daily , Weekly | |
| Add WLFC to Watchlist: View: Get Complete WLFC Trend Analysis ➞ | |
 | BH Biglari Holdings Inc. |
| Sector: Services & Goods | |
| SubSector: Restaurants | |
| MarketCap: 149.07 Millions | |
| Recent Price: 215.80 Smart Investing & Trading Score: 95 | |
| Day Percent Change: 0.92% Day Change: 1.97 | |
| Week Change: 1.79% Year-to-date Change: 30.8% | |
| BH Links: Profile News Message Board | |
| Charts:- Daily , Weekly | |
| Add BH to Watchlist: View: Get Complete BH Trend Analysis ➞ | |
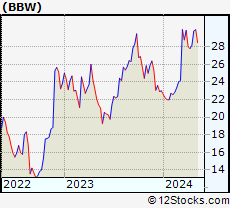 | BBW Build-A-Bear Workshop, Inc. |
| Sector: Services & Goods | |
| SubSector: Toy & Hobby Stores | |
| MarketCap: 31.997 Millions | |
| Recent Price: 29.95 Smart Investing & Trading Score: 83 | |
| Day Percent Change: -1.19% Day Change: -0.36 | |
| Week Change: 5.2% Year-to-date Change: 30.3% | |
| BBW Links: Profile News Message Board | |
| Charts:- Daily , Weekly | |
| Add BBW to Watchlist: View: Get Complete BBW Trend Analysis ➞ | |
 | EOLS Evolus, Inc. |
| Sector: Health Care | |
| SubSector: Drugs - Generic | |
| MarketCap: 145.885 Millions | |
| Recent Price: 13.70 Smart Investing & Trading Score: 69 | |
| Day Percent Change: 3.47% Day Change: 0.46 | |
| Week Change: 7.45% Year-to-date Change: 30.1% | |
| EOLS Links: Profile News Message Board | |
| Charts:- Daily , Weekly | |
| Add EOLS to Watchlist: View: Get Complete EOLS Trend Analysis ➞ | |
 | KODK Eastman Kodak Company |
| Sector: Technology | |
| SubSector: Electronic Equipment | |
| MarketCap: 78.47 Millions | |
| Recent Price: 5.05 Smart Investing & Trading Score: 74 | |
| Day Percent Change: 0.60% Day Change: 0.03 | |
| Week Change: 10.75% Year-to-date Change: 29.5% | |
| KODK Links: Profile News Message Board | |
| Charts:- Daily , Weekly | |
| Add KODK to Watchlist: View: Get Complete KODK Trend Analysis ➞ | |
 | CLFD Clearfield, Inc. |
| Sector: Technology | |
| SubSector: Communication Equipment | |
| MarketCap: 138.439 Millions | |
| Recent Price: 37.02 Smart Investing & Trading Score: 90 | |
| Day Percent Change: -2.55% Day Change: -0.97 | |
| Week Change: -0.03% Year-to-date Change: 27.3% | |
| CLFD Links: Profile News Message Board | |
| Charts:- Daily , Weekly | |
| Add CLFD to Watchlist: View: Get Complete CLFD Trend Analysis ➞ | |
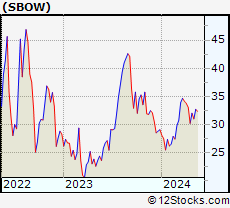 | SBOW SilverBow Resources, Inc. |
| Sector: Energy | |
| SubSector: Independent Oil & Gas | |
| MarketCap: 25.9593 Millions | |
| Recent Price: 36.62 Smart Investing & Trading Score: 100 | |
| Day Percent Change: 13.20% Day Change: 4.27 | |
| Week Change: 11.95% Year-to-date Change: 25.9% | |
| SBOW Links: Profile News Message Board | |
| Charts:- Daily , Weekly | |
| Add SBOW to Watchlist: View: Get Complete SBOW Trend Analysis ➞ | |
 | GENC Gencor Industries, Inc. |
| Sector: Industrials | |
| SubSector: Farm & Construction Machinery | |
| MarketCap: 147.607 Millions | |
| Recent Price: 20.31 Smart Investing & Trading Score: 95 | |
| Day Percent Change: 1.15% Day Change: 0.23 | |
| Week Change: 7.97% Year-to-date Change: 25.8% | |
| GENC Links: Profile News Message Board | |
| Charts:- Daily , Weekly | |
| Add GENC to Watchlist: View: Get Complete GENC Trend Analysis ➞ | |
| For tabular summary view of above stock list: Summary View ➞ 0 - 25 , 25 - 50 , 50 - 75 , 75 - 100 , 100 - 125 , 125 - 150 , 150 - 175 , 175 - 200 | ||
| Click To Change The Sort Order: By Market Cap or Company Size Performance: Year-to-date, Week and Day | |
| Select Chart Type: | ||
| Too many stocks? View smallcap stocks filtered by marketcap & sector |
| Marketcap: All SmallCap Stocks (default-no microcap), Large, Mid-Range, Small & MicroCap |
| Sector: Tech, Finance, Energy, Staples, Retail, Industrial, Materials, Utilities & Medical |
|
Best Stocks Today 12Stocks.com |
© 2024 12Stocks.com Terms & Conditions Privacy Contact Us
All Information Provided Only For Education And Not To Be Used For Investing or Trading. See Terms & Conditions


One More Thing ... Get Best Stocks Delivered Daily!
Never Ever Miss A Move With Our Top Ten Stocks Lists
Find Best Stocks In Any Market - Bull or Bear Market
Take A Peek At Our Top Ten Stocks Lists: Daily, Weekly, Year-to-Date & Top Trends
Find Best Stocks In Any Market - Bull or Bear Market
Take A Peek At Our Top Ten Stocks Lists: Daily, Weekly, Year-to-Date & Top Trends
Smallcap Stocks With Best Up Trends [0-bearish to 100-bullish]: Trupanion [100], Zura Bio[100], SilverBow Resources[100], Novavax [100], Third Harmonic[100], Hawkins [100], BRP Group[100], Kura Sushi[100], Aurinia [100], Heron [100], Cadiz [100]
Best Smallcap Stocks Year-to-Date:
CareMax [471.13%], Bakkt [370.4%], Janux [342.16%], Viking [304.73%], Alpine Immune[241.18%], Longboard [235.68%], Super Micro[218.16%], Avidity Biosciences[217.7%], Novavax [200%], Arcutis Bio[182.35%], Sweetgreen [181.24%] Best Smallcap Stocks This Week:
Novavax [62.16%], MacroGenics [54.68%], Maxeon Solar[49.31%], SunPower [43.04%], Harrow Health[39.31%], Workhorse Group[39.06%], Humacyte [36.6%], ProKidney [34.88%], Allbirds [33.47%], Cadiz [28.76%], Fossil Group[28.72%] Best Smallcap Stocks Daily:
Maxeon Solar[26.56%], Allakos [22.36%], Ventyx Biosciences[18.85%], Trupanion [15.85%], Zura Bio[15.61%], Beyond Air[15.42%], SilverBow Resources[13.20%], Children s[13.09%], Comtech Tele[12.92%], Aceto [12.14%], Novavax [11.63%]