
 Login Sign Up


| |||||
 |  | ||||

| 12Stocks.com Market Intelligence |
Best SmallCap Stocks
|
| In a hurry? Small Cap Stock Lists: Performance Trends Table, Stock Charts
Sort Small Cap stocks: Daily, Weekly, Year-to-Date, Market Cap & Trends. Filter Small Cap stocks list by sector: Show all, Tech, Finance, Energy, Staples, Retail, Industrial, Materials, Utilities and HealthCare Filter Small Cap stocks list by size: All Large Medium Small and MicroCap |
| 12Stocks.com Small Cap Stocks Performances & Trends Daily | |||||||||
|
|  The overall Smart Investing & Trading Score is 100 (0-bearish to 100-bullish) which puts Small Cap index in short term bullish trend. The Smart Investing & Trading Score from previous trading session is 88 and hence an improvement of trend.
| ||||||||
Here are the Smart Investing & Trading Scores of the most requested small cap stocks at 12Stocks.com (click stock name for detailed review):
|


| 12Stocks.com: Investing in Smallcap Index with Stocks | |
|
The following table helps investors and traders sort through current performance and trends (as measured by Smart Investing & Trading Score) of various
stocks in the Smallcap Index. Quick View: Move mouse or cursor over stock symbol (ticker) to view short-term technical chart and over stock name to view long term chart. Click on  to add stock symbol to your watchlist and to add stock symbol to your watchlist and  to view watchlist. Click on any ticker or stock name for detailed market intelligence report for that stock. to view watchlist. Click on any ticker or stock name for detailed market intelligence report for that stock. |
12Stocks.com Performance of Stocks in Smallcap Index
| Ticker | Stock Name | Watchlist | Category | Recent Price | Smart Investing & Trading Score | Change % | YTD Change% |
| SHBI | Shore Bancshares |   | Financials | 11.13 | 42 | 0.45% | -21.89% |
| FFIC | Flushing Financial | | Financials | 12.76 | 69 | 1.80% | -22.60% |
| GNL | Global Net | | Financials | 7.70 | 95 | 0.52% | -22.61% |
| NFBK | Northfield Bancorp | | Financials | 9.54 | 62 | 4.26% | -24.17% |
| ACNB | ACNB | | Financials | 33.80 | 49 | 0.75% | -24.49% |
| SFST | Southern First | | Financials | 27.60 | 47 | 0.36% | -25.61% |
| KREF | KKR Real | | Financials | 9.79 | 100 | 0.41% | -26.00% |
| NWFL | Norwood Financial | | Financials | 24.33 | 50 | -1.52% | -26.07% |
| NYMT | New York | | Financials | 6.28 | 49 | 0.80% | -26.38% |
| DCOM | Dime Community | | Financials | 19.82 | 76 | -0.10% | -26.40% |
| CLPR | Clipper Realty | | Financials | 3.97 | 15 | -0.25% | -26.48% |
| VLY | Valley National | | Financials | 7.98 | 69 | -0.50% | -26.52% |
| RMAX | RE/MAX | | Financials | 9.63 | 73 | 1.16% | -27.76% |
| BMRC | Bank of Marin Bancorp | | Financials | 15.88 | 57 | 0.25% | -27.88% |
| PKST | Peakstone Realty | | Financials | 14.79 | 88 | -1.27% | -27.92% |
| upst | Upstart | | Financials | 28.11 | 88 | -1.68% | -30.61% |
| SVC | Service Properties | | Financials | 5.79 | 35 | -1.36% | -32.20% |
| EGBN | Eagle Bancorp | | Financials | 20.36 | 74 | 1.55% | -32.45% |
| ATLC | Atlanticus | | Financials | 25.95 | 10 | -5.20% | -32.88% |
| KRNY | Kearny Financial | | Financials | 5.96 | 74 | 5.49% | -33.56% |
| GOCO | GoHealth | | Financials | 8.71 | 10 | 0.11% | -33.66% |
| UNIT | Uniti Group | | Financials | 3.79 | 17 | -1.43% | -34.34% |
| ACRE | Ares Commercial | | Financials | 6.78 | 35 | -1.88% | -34.56% |
| ONL | Orion Office | | Financials | 3.74 | 73 | 0.81% | -34.62% |
| DHC | Diversified Healthcare | | Financials | 2.39 | 50 | -8.08% | -36.10% |
| For chart view version of above stock list: Chart View ➞ 0 - 25 , 25 - 50 , 50 - 75 , 75 - 100 , 100 - 125 , 125 - 150 , 150 - 175 , 175 - 200 , 200 - 225 , 225 - 250 , 250 - 275 , 275 - 300 , 300 - 325 , 325 - 350 , 350 - 375 , 375 - 400 | ||
 | Click To Change The Sort Order: By Market Cap or Company Size Performance: Year-to-date, Week and Day |  |
| Too many stocks? View smallcap stocks filtered by marketcap & sector |
| Marketcap: All SmallCap Stocks (default-no microcap), Large, Mid-Range, Small |
| Smallcap Sector: Tech, Finance, Energy, Staples, Retail, Industrial, Materials, & Medical |
|
Get the most comprehensive stock market coverage daily at 12Stocks.com ➞ Best Stocks Today ➞ Best Stocks Weekly ➞ Best Stocks Year-to-Date ➞ Best Stocks Trends ➞  Best Stocks Today 12Stocks.com Best Nasdaq Stocks ➞ Best S&P 500 Stocks ➞ Best Tech Stocks ➞ Best Biotech Stocks ➞ |
| Detailed Overview of SmallCap Stocks |
| SmallCap Technical Overview, Leaders & Laggards, Top SmallCap ETF Funds & Detailed SmallCap Stocks List, Charts, Trends & More |
| Smallcap: Technical Analysis, Trends & YTD Performance | |
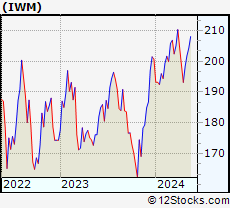
| SmallCap segment as represented by
IWM, an exchange-traded fund [ETF], holds basket of thousands of smallcap stocks from across all major sectors of the US stock market. The smallcap index (contains stocks like Riverbed & Sotheby's) is up by 4.35% and is currently underperforming the overall market by -6.37% year-to-date. Below is a quick view of technical charts and trends: | |
 IWM Weekly Chart |
|
| Long Term Trend: Very Good | |
| Medium Term Trend: Very Good | |
 IWM Daily Chart |
|
| Short Term Trend: Very Good | |
| Overall Trend Score: 100 | |
| YTD Performance: 4.35% | |
| **Trend Scores & Views Are Only For Educational Purposes And Not For Investing | |
| 12Stocks.com: Top Performing Small Cap Index Stocks | ||||||||||||||||||||||||||||||||||||||||||||||||
 The top performing Small Cap Index stocks year to date are
Now, more recently, over last week, the top performing Small Cap Index stocks on the move are


|
||||||||||||||||||||||||||||||||||||||||||||||||
| 12Stocks.com: Investing in Smallcap Index using Exchange Traded Funds | |
|
The following table shows list of key exchange traded funds (ETF) that
help investors track Smallcap index. The following list also includes leveraged ETF funds that track twice or thrice the daily returns of Smallcap indices. Short or inverse ETF funds move in the opposite direction to the index they track and are useful during market pullbacks or during bear markets. Quick View: Move mouse or cursor over ETF symbol (ticker) to view short-term technical chart and over ETF name to view long term chart. Click on ticker or stock name for detailed view. Click on to add stock symbol to your watchlist and to view watchlist. |
12Stocks.com List of ETFs that track Smallcap Index
| Ticker | ETF Name | Watchlist | Recent Price | Smart Investing & Trading Score | Change % | Week % | Year-to-date % |
| IWM | iShares Russell 2000 | | 209.44 | 100 | 1.25 | 2.51 | 4.35% |
| VTWO | Vanguard Russell 2000 ETF | | 84.39 | 95 | 1.07 | 2.14 | 4.06% |
| IJR | iShares Core S&P Small-Cap | | 110.78 | 95 | 0.34 | 1.65 | 2.34% |
| IWN | iShares Russell 2000 Value | | 158.72 | 95 | 0.58 | 1.62 | 2.18% |
| IWO | iShares Russell 2000 Growth | | 266.58 | 100 | 1.17 | 2.56 | 5.69% |
| IJS | iShares S&P Small-Cap 600 Value | | 102.22 | 95 | 0.01 | 1.69 | -0.82% |
| IJT | iShares S&P Small-Cap 600 Growth | | 131.73 | 95 | 0.77 | 1.44 | 5.27% |
| XSLV | PowerShares S&P SmallCap Low Volatil ETF | | 44.53 | 83 | 0.46 | 0.68 | 0.86% |
| SAA | ProShares Ultra SmallCap600 | | 25.20 | 78 | 0.90 | 3.51 | 1.02% |
| SBB | ProShares Short SmallCap600 | | 15.70 | 18 | -0.44 | -1.6 | -1.44% |
| SMLV | SPDR SSGA US Small Cap Low Volatil ETF | | 112.15 | 95 | 0.45 | 0.84 | -0.33% |
| SDD | ProShares UltraShort SmallCap600 | | 17.37 | 20 | -2.90 | -4.98 | -5.73% |
| 12Stocks.com: Charts, Trends, Fundamental Data and Performances of SmallCap Stocks | |
|
We now take in-depth look at all SmallCap stocks including charts, multi-period performances and overall trends (as measured by Smart Investing & Trading Score). One can sort SmallCap stocks (click link to choose) by Daily, Weekly and by Year-to-Date performances. Also, one can sort by size of the company or by market capitalization. |
| Select Your Default Chart Type: | |||||
| |||||
| Click on stock symbol or name for detailed view. Click on to add stock symbol to your watchlist and to view watchlist. Quick View: Move mouse or cursor over "Daily" to quickly view daily technical stock chart and over "Weekly" to view weekly technical stock chart. | |||||

 | SHBI Shore Bancshares, Inc. |
| Sector: Financials | |
| SubSector: Regional - Mid-Atlantic Banks | |
| MarketCap: 131.359 Millions | |
| Recent Price: 11.13 Smart Investing & Trading Score: 42 | |
| Day Percent Change: 0.45% Day Change: 0.05 | |
| Week Change: -0.71% Year-to-date Change: -21.9% | |
| SHBI Links: Profile News Message Board | |
| Charts:- Daily , Weekly | |
| Add SHBI to Watchlist: View: Get Complete SHBI Trend Analysis ➞ | |
 | FFIC Flushing Financial Corporation |
| Sector: Financials | |
| SubSector: Savings & Loans | |
| MarketCap: 336.43 Millions | |
| Recent Price: 12.76 Smart Investing & Trading Score: 69 | |
| Day Percent Change: 1.80% Day Change: 0.23 | |
| Week Change: 3.28% Year-to-date Change: -22.6% | |
| FFIC Links: Profile News Message Board | |
| Charts:- Daily , Weekly | |
| Add FFIC to Watchlist: View: Get Complete FFIC Trend Analysis ➞ | |
 | GNL Global Net Lease, Inc. |
| Sector: Financials | |
| SubSector: REIT - Diversified | |
| MarketCap: 1362.73 Millions | |
| Recent Price: 7.70 Smart Investing & Trading Score: 95 | |
| Day Percent Change: 0.52% Day Change: 0.04 | |
| Week Change: 3.22% Year-to-date Change: -22.6% | |
| GNL Links: Profile News Message Board | |
| Charts:- Daily , Weekly | |
| Add GNL to Watchlist: View: Get Complete GNL Trend Analysis ➞ | |
 | NFBK Northfield Bancorp, Inc. (Staten Island, NY) |
| Sector: Financials | |
| SubSector: Regional - Northeast Banks | |
| MarketCap: 540.699 Millions | |
| Recent Price: 9.54 Smart Investing & Trading Score: 62 | |
| Day Percent Change: 4.26% Day Change: 0.39 | |
| Week Change: 1.38% Year-to-date Change: -24.2% | |
| NFBK Links: Profile News Message Board | |
| Charts:- Daily , Weekly | |
| Add NFBK to Watchlist: View: Get Complete NFBK Trend Analysis ➞ | |
 | ACNB ACNB Corporation |
| Sector: Financials | |
| SubSector: Regional - Southwest Banks | |
| MarketCap: 231.065 Millions | |
| Recent Price: 33.80 Smart Investing & Trading Score: 49 | |
| Day Percent Change: 0.75% Day Change: 0.25 | |
| Week Change: 4.39% Year-to-date Change: -24.5% | |
| ACNB Links: Profile News Message Board | |
| Charts:- Daily , Weekly | |
| Add ACNB to Watchlist: View: Get Complete ACNB Trend Analysis ➞ | |
 | SFST Southern First Bancshares, Inc. |
| Sector: Financials | |
| SubSector: Money Center Banks | |
| MarketCap: 189.099 Millions | |
| Recent Price: 27.60 Smart Investing & Trading Score: 47 | |
| Day Percent Change: 0.36% Day Change: 0.10 | |
| Week Change: 0% Year-to-date Change: -25.6% | |
| SFST Links: Profile News Message Board | |
| Charts:- Daily , Weekly | |
| Add SFST to Watchlist: View: Get Complete SFST Trend Analysis ➞ | |
 | KREF KKR Real Estate Finance Trust Inc. |
| Sector: Financials | |
| SubSector: Mortgage Investment | |
| MarketCap: 645.939 Millions | |
| Recent Price: 9.79 Smart Investing & Trading Score: 100 | |
| Day Percent Change: 0.41% Day Change: 0.04 | |
| Week Change: 2.51% Year-to-date Change: -26.0% | |
| KREF Links: Profile News Message Board | |
| Charts:- Daily , Weekly | |
| Add KREF to Watchlist: View: Get Complete KREF Trend Analysis ➞ | |
 | NWFL Norwood Financial Corp. |
| Sector: Financials | |
| SubSector: Regional - Northeast Banks | |
| MarketCap: 201.899 Millions | |
| Recent Price: 24.33 Smart Investing & Trading Score: 50 | |
| Day Percent Change: -1.52% Day Change: -0.38 | |
| Week Change: 2.96% Year-to-date Change: -26.1% | |
| NWFL Links: Profile News Message Board | |
| Charts:- Daily , Weekly | |
| Add NWFL to Watchlist: View: Get Complete NWFL Trend Analysis ➞ | |
 | NYMT New York Mortgage Trust, Inc. |
| Sector: Financials | |
| SubSector: Mortgage Investment | |
| MarketCap: 1038.39 Millions | |
| Recent Price: 6.28 Smart Investing & Trading Score: 49 | |
| Day Percent Change: 0.80% Day Change: 0.05 | |
| Week Change: 2.11% Year-to-date Change: -26.4% | |
| NYMT Links: Profile News Message Board | |
| Charts:- Daily , Weekly | |
| Add NYMT to Watchlist: View: Get Complete NYMT Trend Analysis ➞ | |
 | DCOM Dime Community Bancshares, Inc. |
| Sector: Financials | |
| SubSector: Savings & Loans | |
| MarketCap: 477.83 Millions | |
| Recent Price: 19.82 Smart Investing & Trading Score: 76 | |
| Day Percent Change: -0.10% Day Change: -0.02 | |
| Week Change: -0.35% Year-to-date Change: -26.4% | |
| DCOM Links: Profile News Message Board | |
| Charts:- Daily , Weekly | |
| Add DCOM to Watchlist: View: Get Complete DCOM Trend Analysis ➞ | |
 | CLPR Clipper Realty Inc. |
| Sector: Financials | |
| SubSector: REIT - Diversified | |
| MarketCap: 113.253 Millions | |
| Recent Price: 3.97 Smart Investing & Trading Score: 15 | |
| Day Percent Change: -0.25% Day Change: -0.01 | |
| Week Change: -1% Year-to-date Change: -26.5% | |
| CLPR Links: Profile News Message Board | |
| Charts:- Daily , Weekly | |
| Add CLPR to Watchlist: View: Get Complete CLPR Trend Analysis ➞ | |
 | VLY Valley National Bancorp |
| Sector: Financials | |
| SubSector: Regional - Northeast Banks | |
| MarketCap: 2843.09 Millions | |
| Recent Price: 7.98 Smart Investing & Trading Score: 69 | |
| Day Percent Change: -0.50% Day Change: -0.04 | |
| Week Change: 3.23% Year-to-date Change: -26.5% | |
| VLY Links: Profile News Message Board | |
| Charts:- Daily , Weekly | |
| Add VLY to Watchlist: View: Get Complete VLY Trend Analysis ➞ | |
 | RMAX RE/MAX Holdings, Inc. |
| Sector: Financials | |
| SubSector: Property Management | |
| MarketCap: 334.742 Millions | |
| Recent Price: 9.63 Smart Investing & Trading Score: 73 | |
| Day Percent Change: 1.16% Day Change: 0.11 | |
| Week Change: 0.63% Year-to-date Change: -27.8% | |
| RMAX Links: Profile News Message Board | |
| Charts:- Daily , Weekly | |
| Add RMAX to Watchlist: View: Get Complete RMAX Trend Analysis ➞ | |
 | BMRC Bank of Marin Bancorp |
| Sector: Financials | |
| SubSector: Regional - Pacific Banks | |
| MarketCap: 367.929 Millions | |
| Recent Price: 15.88 Smart Investing & Trading Score: 57 | |
| Day Percent Change: 0.25% Day Change: 0.04 | |
| Week Change: -0.56% Year-to-date Change: -27.9% | |
| BMRC Links: Profile News Message Board | |
| Charts:- Daily , Weekly | |
| Add BMRC to Watchlist: View: Get Complete BMRC Trend Analysis ➞ | |
 | PKST Peakstone Realty Trust |
| Sector: Financials | |
| SubSector: REIT - Diversified | |
| MarketCap: 1050 Millions | |
| Recent Price: 14.79 Smart Investing & Trading Score: 88 | |
| Day Percent Change: -1.27% Day Change: -0.19 | |
| Week Change: -0.54% Year-to-date Change: -27.9% | |
| PKST Links: Profile News Message Board | |
| Charts:- Daily , Weekly | |
| Add PKST to Watchlist: View: Get Complete PKST Trend Analysis ➞ | |
 | upst Upstart Holdings, Inc. |
| Sector: Financials | |
| SubSector: Credit Services | |
| MarketCap: 2900 Millions | |
| Recent Price: 28.11 Smart Investing & Trading Score: 88 | |
| Day Percent Change: -1.68% Day Change: -0.48 | |
| Week Change: 10.67% Year-to-date Change: -30.6% | |
| upst Links: Profile News Message Board | |
| Charts:- Daily , Weekly | |
| Add upst to Watchlist: View: Get Complete upst Trend Analysis ➞ | |
 | SVC Service Properties Trust |
| Sector: Financials | |
| SubSector: REIT - Hotel/Motel | |
| MarketCap: 1067.74 Millions | |
| Recent Price: 5.79 Smart Investing & Trading Score: 35 | |
| Day Percent Change: -1.36% Day Change: -0.08 | |
| Week Change: 0.26% Year-to-date Change: -32.2% | |
| SVC Links: Profile News Message Board | |
| Charts:- Daily , Weekly | |
| Add SVC to Watchlist: View: Get Complete SVC Trend Analysis ➞ | |
 | EGBN Eagle Bancorp, Inc. |
| Sector: Financials | |
| SubSector: Regional - Mid-Atlantic Banks | |
| MarketCap: 906.559 Millions | |
| Recent Price: 20.36 Smart Investing & Trading Score: 74 | |
| Day Percent Change: 1.55% Day Change: 0.31 | |
| Week Change: 2.11% Year-to-date Change: -32.5% | |
| EGBN Links: Profile News Message Board | |
| Charts:- Daily , Weekly | |
| Add EGBN to Watchlist: View: Get Complete EGBN Trend Analysis ➞ | |
 | ATLC Atlanticus Holdings Corporation |
| Sector: Financials | |
| SubSector: Credit Services | |
| MarketCap: 122.008 Millions | |
| Recent Price: 25.95 Smart Investing & Trading Score: 10 | |
| Day Percent Change: -5.20% Day Change: -1.43 | |
| Week Change: -10.22% Year-to-date Change: -32.9% | |
| ATLC Links: Profile News Message Board | |
| Charts:- Daily , Weekly | |
| Add ATLC to Watchlist: View: Get Complete ATLC Trend Analysis ➞ | |
 | KRNY Kearny Financial Corp. |
| Sector: Financials | |
| SubSector: Savings & Loans | |
| MarketCap: 781.73 Millions | |
| Recent Price: 5.96 Smart Investing & Trading Score: 74 | |
| Day Percent Change: 5.49% Day Change: 0.31 | |
| Week Change: 5.67% Year-to-date Change: -33.6% | |
| KRNY Links: Profile News Message Board | |
| Charts:- Daily , Weekly | |
| Add KRNY to Watchlist: View: Get Complete KRNY Trend Analysis ➞ | |
 | GOCO GoHealth, Inc. |
| Sector: Financials | |
| SubSector: Insurance Brokers | |
| MarketCap: 44157 Millions | |
| Recent Price: 8.71 Smart Investing & Trading Score: 10 | |
| Day Percent Change: 0.11% Day Change: 0.01 | |
| Week Change: -3.33% Year-to-date Change: -33.7% | |
| GOCO Links: Profile News Message Board | |
| Charts:- Daily , Weekly | |
| Add GOCO to Watchlist: View: Get Complete GOCO Trend Analysis ➞ | |
 | UNIT Uniti Group Inc. |
| Sector: Financials | |
| SubSector: REIT - Industrial | |
| MarketCap: 1363.09 Millions | |
| Recent Price: 3.79 Smart Investing & Trading Score: 17 | |
| Day Percent Change: -1.43% Day Change: -0.06 | |
| Week Change: -1.94% Year-to-date Change: -34.3% | |
| UNIT Links: Profile News Message Board | |
| Charts:- Daily , Weekly | |
| Add UNIT to Watchlist: View: Get Complete UNIT Trend Analysis ➞ | |
 | ACRE Ares Commercial Real Estate Corporation |
| Sector: Financials | |
| SubSector: Mortgage Investment | |
| MarketCap: 242.339 Millions | |
| Recent Price: 6.78 Smart Investing & Trading Score: 35 | |
| Day Percent Change: -1.88% Day Change: -0.13 | |
| Week Change: -1.88% Year-to-date Change: -34.6% | |
| ACRE Links: Profile News Message Board | |
| Charts:- Daily , Weekly | |
| Add ACRE to Watchlist: View: Get Complete ACRE Trend Analysis ➞ | |
 | ONL Orion Office REIT Inc. |
| Sector: Financials | |
| SubSector: REIT - Office | |
| MarketCap: 375 Millions | |
| Recent Price: 3.74 Smart Investing & Trading Score: 73 | |
| Day Percent Change: 0.81% Day Change: 0.03 | |
| Week Change: 0.54% Year-to-date Change: -34.6% | |
| ONL Links: Profile News Message Board | |
| Charts:- Daily , Weekly | |
| Add ONL to Watchlist: View: Get Complete ONL Trend Analysis ➞ | |
 | DHC Diversified Healthcare Trust |
| Sector: Financials | |
| SubSector: REIT - Healthcare Facilities | |
| MarketCap: 814.114 Millions | |
| Recent Price: 2.39 Smart Investing & Trading Score: 50 | |
| Day Percent Change: -8.08% Day Change: -0.21 | |
| Week Change: 5.29% Year-to-date Change: -36.1% | |
| DHC Links: Profile News Message Board | |
| Charts:- Daily , Weekly | |
| Add DHC to Watchlist: View: Get Complete DHC Trend Analysis ➞ | |
| For tabular summary view of above stock list: Summary View ➞ 0 - 25 , 25 - 50 , 50 - 75 , 75 - 100 , 100 - 125 , 125 - 150 , 150 - 175 , 175 - 200 , 200 - 225 , 225 - 250 , 250 - 275 , 275 - 300 , 300 - 325 , 325 - 350 , 350 - 375 , 375 - 400 | ||
| Click To Change The Sort Order: By Market Cap or Company Size Performance: Year-to-date, Week and Day | |
| Select Chart Type: | ||
| Too many stocks? View smallcap stocks filtered by marketcap & sector |
| Marketcap: All SmallCap Stocks (default-no microcap), Large, Mid-Range, Small & MicroCap |
| Sector: Tech, Finance, Energy, Staples, Retail, Industrial, Materials, Utilities & Medical |
|
Best Stocks Today 12Stocks.com |
© 2024 12Stocks.com Terms & Conditions Privacy Contact Us
All Information Provided Only For Education And Not To Be Used For Investing or Trading. See Terms & Conditions


One More Thing ... Get Best Stocks Delivered Daily!
Never Ever Miss A Move With Our Top Ten Stocks Lists
Find Best Stocks In Any Market - Bull or Bear Market
Take A Peek At Our Top Ten Stocks Lists: Daily, Weekly, Year-to-Date & Top Trends
Find Best Stocks In Any Market - Bull or Bear Market
Take A Peek At Our Top Ten Stocks Lists: Daily, Weekly, Year-to-Date & Top Trends
Smallcap Stocks With Best Up Trends [0-bearish to 100-bullish]: BioCryst [100], MicroStrategy [100], Stoke [100], Astronics [100], PTC [100], Valhi [100], Hovnanian Enterprises[100], Protagonist [100], Immersion [100], Denali [100], Blue Bird[100]
Best Smallcap Stocks Year-to-Date:
CareMax [483.51%], Bakkt [446.19%], Janux [341.97%], Viking [299.84%], Longboard [245.58%], Alpine Immune[241.18%], Super Micro[234.91%], Avidity Biosciences[226.66%], Arcutis Bio[185.29%], Sweetgreen [182.39%], Vera [175.65%] Best Smallcap Stocks This Week:
Novavax [45.16%], MacroGenics [42.45%], LivePerson [41.51%], ProKidney [39.15%], Humacyte [37.66%], Harrow Health[37.28%], Eyenovia [36.13%], Treace Medical[36.07%], SunPower [35%], Emergent BioSolutions[31.26%], Poseida [30.43%] Best Smallcap Stocks Daily:
Eyenovia [27.07%], OptimizeRx [25.95%], Treace Medical[19.20%], BioCryst [18.47%], Poseida [18.15%], MicroStrategy [15.78%], Super Micro[15.77%], HilleVax [15.31%], Douglas Elliman[15.18%], CPI Card[14.52%], Arcutis Bio[13.35%]