
 Login Sign Up


| |||||
 |  | ||||

| 12Stocks.com Market Intelligence |
Best SmallCap Stocks
|
| In a hurry? Small Cap Stock Lists: Performance Trends Table, Stock Charts
Sort Small Cap stocks: Daily, Weekly, Year-to-Date, Market Cap & Trends. Filter Small Cap stocks list by sector: Show all, Tech, Finance, Energy, Staples, Retail, Industrial, Materials, Utilities and HealthCare Filter Small Cap stocks list by size: All Large Medium Small and MicroCap |
| 12Stocks.com Small Cap Stocks Performances & Trends Daily | |||||||||
|
|  The overall Smart Investing & Trading Score is 39 (0-bearish to 100-bullish) which puts Small Cap index in short term bearish to neutral trend. The Smart Investing & Trading Score from previous trading session is 41 and hence a deterioration of trend.
| ||||||||
Here are the Smart Investing & Trading Scores of the most requested small cap stocks at 12Stocks.com (click stock name for detailed review):
|


| 12Stocks.com: Investing in Smallcap Index with Stocks | |
|
The following table helps investors and traders sort through current performance and trends (as measured by Smart Investing & Trading Score) of various
stocks in the Smallcap Index. Quick View: Move mouse or cursor over stock symbol (ticker) to view short-term technical chart and over stock name to view long term chart. Click on  to add stock symbol to your watchlist and to add stock symbol to your watchlist and  to view watchlist. Click on any ticker or stock name for detailed market intelligence report for that stock. to view watchlist. Click on any ticker or stock name for detailed market intelligence report for that stock. |
12Stocks.com Performance of Stocks in Smallcap Index
| Ticker | Stock Name | Watchlist | Category | Recent Price | Smart Investing & Trading Score | Change % | Weekly Change% |
| HBI | Hanesbrands |   | Consumer Staples | 4.62 | 32 | 1.32% | 3.13% |
| ISPR | Ispire | | Consumer Staples | 5.37 | 49 | 3.87% | 3.07% |
| CYRX | Cryoport | | Consumer Staples | 16.86 | 42 | 4.14% | 2.93% |
| LANC | Lancaster Colony | | Consumer Staples | 192.38 | 32 | 0.82% | 2.86% |
| UVV | Universal | | Consumer Staples | 52.22 | 85 | 1.54% | 2.80% |
| CLAR | Clarus | | Consumer Staples | 6.46 | 90 | 1.97% | 2.79% |
| EBF | Ennis | | Consumer Staples | 20.21 | 64 | 1.56% | 2.59% |
| GT | Goodyear Tire | | Consumer Staples | 12.14 | 68 | 1.46% | 2.49% |
| ENR | Energizer | | Consumer Staples | 29.19 | 100 | 1.64% | 2.39% |
| VGR | Vector Group | | Consumer Staples | 10.52 | 59 | 1.59% | 2.39% |
| FDP | Fresh Del | | Consumer Staples | 26.16 | 100 | 2.29% | 2.09% |
| LMNR | Limoneira | | Consumer Staples | 20.25 | 88 | 2.35% | 1.99% |
| COKE | Coca-Cola Consolidated | | Consumer Staples | 838.15 | 47 | 1.47% | 1.91% |
| DORM | Dorman Products | | Consumer Staples | 90.79 | 30 | 3.82% | 1.75% |
| MYE | Myers Industries | | Consumer Staples | 22.40 | 83 | 2.26% | 1.61% |
| WEST | Westrock Coffee | | Consumer Staples | 10.18 | 80 | 0.49% | 1.60% |
| VSTO | Vista Outdoor | | Consumer Staples | 35.52 | 83 | 1.23% | 1.57% |
| PLOW | Douglas Dynamics | | Consumer Staples | 22.73 | 67 | 0.40% | 1.56% |
| OXM | Oxford Industries | | Consumer Staples | 108.31 | 58 | 0.49% | 1.50% |
| EPC | Edgewell Personal | | Consumer Staples | 37.95 | 82 | 0.86% | 1.38% |
| VC | Visteon | | Consumer Staples | 113.60 | 87 | 2.68% | 1.26% |
| JOUT | Johnson Outdoors | | Consumer Staples | 42.27 | 35 | 3.07% | 1.25% |
| PRTS | U.S. Auto | | Consumer Staples | 1.23 | 20 | -2.00% | 1.24% |
| WEYS | Weyco Group | | Consumer Staples | 29.58 | 57 | 0.78% | 1.23% |
| AVO | Mission Produce | | Consumer Staples | 11.48 | 76 | 1.15% | 1.23% |
| For chart view version of above stock list: Chart View ➞ 0 - 25 , 25 - 50 , 50 - 75 , 75 - 100 , 100 - 125 | ||
 | Click To Change The Sort Order: By Market Cap or Company Size Performance: Year-to-date, Week and Day |  |
| Too many stocks? View smallcap stocks filtered by marketcap & sector |
| Marketcap: All SmallCap Stocks (default-no microcap), Large, Mid-Range, Small |
| Smallcap Sector: Tech, Finance, Energy, Staples, Retail, Industrial, Materials, & Medical |
|
Get the most comprehensive stock market coverage daily at 12Stocks.com ➞ Best Stocks Today ➞ Best Stocks Weekly ➞ Best Stocks Year-to-Date ➞ Best Stocks Trends ➞  Best Stocks Today 12Stocks.com Best Nasdaq Stocks ➞ Best S&P 500 Stocks ➞ Best Tech Stocks ➞ Best Biotech Stocks ➞ |
| Detailed Overview of SmallCap Stocks |
| SmallCap Technical Overview, Leaders & Laggards, Top SmallCap ETF Funds & Detailed SmallCap Stocks List, Charts, Trends & More |
| Smallcap: Technical Analysis, Trends & YTD Performance | |
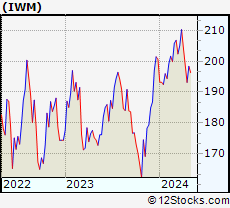
| SmallCap segment as represented by
IWM, an exchange-traded fund [ETF], holds basket of thousands of smallcap stocks from across all major sectors of the US stock market. The smallcap index (contains stocks like Riverbed & Sotheby's) is down by -0.82% and is currently underperforming the overall market by -6.65% year-to-date. Below is a quick view of technical charts and trends: | |
 IWM Weekly Chart |
|
| Long Term Trend: Not Good | |
| Medium Term Trend: Good | |
 IWM Daily Chart |
|
| Short Term Trend: Very Good | |
| Overall Trend Score: 39 | |
| YTD Performance: -0.82% | |
| **Trend Scores & Views Are Only For Educational Purposes And Not For Investing | |
| 12Stocks.com: Top Performing Small Cap Index Stocks | ||||||||||||||||||||||||||||||||||||||||||||||||
 The top performing Small Cap Index stocks year to date are
Now, more recently, over last week, the top performing Small Cap Index stocks on the move are


|
||||||||||||||||||||||||||||||||||||||||||||||||
| 12Stocks.com: Investing in Smallcap Index using Exchange Traded Funds | |
|
The following table shows list of key exchange traded funds (ETF) that
help investors track Smallcap index. The following list also includes leveraged ETF funds that track twice or thrice the daily returns of Smallcap indices. Short or inverse ETF funds move in the opposite direction to the index they track and are useful during market pullbacks or during bear markets. Quick View: Move mouse or cursor over ETF symbol (ticker) to view short-term technical chart and over ETF name to view long term chart. Click on ticker or stock name for detailed view. Click on to add stock symbol to your watchlist and to view watchlist. |
12Stocks.com List of ETFs that track Smallcap Index
| Ticker | ETF Name | Watchlist | Recent Price | Smart Investing & Trading Score | Change % | Week % | Year-to-date % |
| IWM | iShares Russell 2000 | | 199.06 | 39 | 1.61 | 0.34 | -0.82% |
| IJR | iShares Core S&P Small-Cap | | 106.12 | 22 | 1.66 | 0.44 | -1.97% |
| VTWO | Vanguard Russell 2000 ETF | | 80.54 | 14 | 1.74 | 0.4 | -0.69% |
| IWN | iShares Russell 2000 Value | | 151.57 | 22 | 1.70 | 0.28 | -2.42% |
| IJS | iShares S&P Small-Cap 600 Value | | 97.58 | 15 | 1.56 | 0.4 | -5.33% |
| IWO | iShares Russell 2000 Growth | | 253.61 | 7 | 1.31 | 0.21 | 0.55% |
| IJT | iShares S&P Small-Cap 600 Growth | | 125.91 | 15 | 1.05 | -0.14 | 0.62% |
| XSLV | PowerShares S&P SmallCap Low Volatil ETF | | 42.89 | 45 | 0.82 | 0.4 | -2.85% |
| SDD | ProShares UltraShort SmallCap600 | | 19.55 | 37 | -0.10 | 1.03 | 6.1% |
| SMLV | SPDR SSGA US Small Cap Low Volatil ETF | | 107.40 | 22 | 1.07 | -0.11 | -4.55% |
| SBB | ProShares Short SmallCap600 | | 16.54 | 27 | -0.06 | 0.95 | 3.83% |
| SAA | ProShares Ultra SmallCap600 | | 22.53 | 13 | -0.31 | -2.21 | -9.7% |
| 12Stocks.com: Charts, Trends, Fundamental Data and Performances of SmallCap Stocks | |
|
We now take in-depth look at all SmallCap stocks including charts, multi-period performances and overall trends (as measured by Smart Investing & Trading Score). One can sort SmallCap stocks (click link to choose) by Daily, Weekly and by Year-to-Date performances. Also, one can sort by size of the company or by market capitalization. |
| Select Your Default Chart Type: | |||||
| |||||
| Click on stock symbol or name for detailed view. Click on to add stock symbol to your watchlist and to view watchlist. Quick View: Move mouse or cursor over "Daily" to quickly view daily technical stock chart and over "Weekly" to view weekly technical stock chart. | |||||

 | HBI Hanesbrands Inc. |
| Sector: Consumer Staples | |
| SubSector: Textile - Apparel Clothing | |
| MarketCap: 3559.75 Millions | |
| Recent Price: 4.62 Smart Investing & Trading Score: 32 | |
| Day Percent Change: 1.32% Day Change: 0.06 | |
| Week Change: 3.13% Year-to-date Change: 3.6% | |
| HBI Links: Profile News Message Board | |
| Charts:- Daily , Weekly | |
| Add HBI to Watchlist: View: Get Complete HBI Trend Analysis ➞ | |
 | ISPR Ispire Technology Inc. |
| Sector: Consumer Staples | |
| SubSector: Tobacco | |
| MarketCap: 447 Millions | |
| Recent Price: 5.37 Smart Investing & Trading Score: 49 | |
| Day Percent Change: 3.87% Day Change: 0.20 | |
| Week Change: 3.07% Year-to-date Change: -56.0% | |
| ISPR Links: Profile News Message Board | |
| Charts:- Daily , Weekly | |
| Add ISPR to Watchlist: View: Get Complete ISPR Trend Analysis ➞ | |
 | CYRX Cryoport, Inc. |
| Sector: Consumer Staples | |
| SubSector: Packaging & Containers | |
| MarketCap: 576.653 Millions | |
| Recent Price: 16.86 Smart Investing & Trading Score: 42 | |
| Day Percent Change: 4.14% Day Change: 0.67 | |
| Week Change: 2.93% Year-to-date Change: 8.8% | |
| CYRX Links: Profile News Message Board | |
| Charts:- Daily , Weekly | |
| Add CYRX to Watchlist: View: Get Complete CYRX Trend Analysis ➞ | |
 | LANC Lancaster Colony Corporation |
| Sector: Consumer Staples | |
| SubSector: Food - Major Diversified | |
| MarketCap: 4060.83 Millions | |
| Recent Price: 192.38 Smart Investing & Trading Score: 32 | |
| Day Percent Change: 0.82% Day Change: 1.57 | |
| Week Change: 2.86% Year-to-date Change: 15.6% | |
| LANC Links: Profile News Message Board | |
| Charts:- Daily , Weekly | |
| Add LANC to Watchlist: View: Get Complete LANC Trend Analysis ➞ | |
 | UVV Universal Corporation |
| Sector: Consumer Staples | |
| SubSector: Tobacco Products, Other | |
| MarketCap: 1107.7 Millions | |
| Recent Price: 52.22 Smart Investing & Trading Score: 85 | |
| Day Percent Change: 1.54% Day Change: 0.79 | |
| Week Change: 2.8% Year-to-date Change: -22.4% | |
| UVV Links: Profile News Message Board | |
| Charts:- Daily , Weekly | |
| Add UVV to Watchlist: View: Get Complete UVV Trend Analysis ➞ | |
 | CLAR Clarus Corporation |
| Sector: Consumer Staples | |
| SubSector: Sporting Goods | |
| MarketCap: 290.144 Millions | |
| Recent Price: 6.46 Smart Investing & Trading Score: 90 | |
| Day Percent Change: 1.97% Day Change: 0.13 | |
| Week Change: 2.79% Year-to-date Change: -6.4% | |
| CLAR Links: Profile News Message Board | |
| Charts:- Daily , Weekly | |
| Add CLAR to Watchlist: View: Get Complete CLAR Trend Analysis ➞ | |
 | EBF Ennis, Inc. |
| Sector: Consumer Staples | |
| SubSector: Office Supplies | |
| MarketCap: 464.5 Millions | |
| Recent Price: 20.21 Smart Investing & Trading Score: 64 | |
| Day Percent Change: 1.56% Day Change: 0.31 | |
| Week Change: 2.59% Year-to-date Change: -7.8% | |
| EBF Links: Profile News Message Board | |
| Charts:- Daily , Weekly | |
| Add EBF to Watchlist: View: Get Complete EBF Trend Analysis ➞ | |
 | GT The Goodyear Tire & Rubber Company |
| Sector: Consumer Staples | |
| SubSector: Rubber & Plastics | |
| MarketCap: 1483.7 Millions | |
| Recent Price: 12.14 Smart Investing & Trading Score: 68 | |
| Day Percent Change: 1.46% Day Change: 0.17 | |
| Week Change: 2.49% Year-to-date Change: -15.3% | |
| GT Links: Profile News Message Board | |
| Charts:- Daily , Weekly | |
| Add GT to Watchlist: View: Get Complete GT Trend Analysis ➞ | |
 | ENR Energizer Holdings, Inc. |
| Sector: Consumer Staples | |
| SubSector: Personal Products | |
| MarketCap: 2469.55 Millions | |
| Recent Price: 29.19 Smart Investing & Trading Score: 100 | |
| Day Percent Change: 1.64% Day Change: 0.47 | |
| Week Change: 2.39% Year-to-date Change: -7.9% | |
| ENR Links: Profile News Message Board | |
| Charts:- Daily , Weekly | |
| Add ENR to Watchlist: View: Get Complete ENR Trend Analysis ➞ | |
 | VGR Vector Group Ltd. |
| Sector: Consumer Staples | |
| SubSector: Cigarettes | |
| MarketCap: 1676.53 Millions | |
| Recent Price: 10.52 Smart Investing & Trading Score: 59 | |
| Day Percent Change: 1.59% Day Change: 0.17 | |
| Week Change: 2.39% Year-to-date Change: -6.8% | |
| VGR Links: Profile News Message Board | |
| Charts:- Daily , Weekly | |
| Add VGR to Watchlist: View: Get Complete VGR Trend Analysis ➞ | |
 | FDP Fresh Del Monte Produce Inc. |
| Sector: Consumer Staples | |
| SubSector: Farm Products | |
| MarketCap: 1862.37 Millions | |
| Recent Price: 26.16 Smart Investing & Trading Score: 100 | |
| Day Percent Change: 2.29% Day Change: 0.59 | |
| Week Change: 2.09% Year-to-date Change: -0.4% | |
| FDP Links: Profile News Message Board | |
| Charts:- Daily , Weekly | |
| Add FDP to Watchlist: View: Get Complete FDP Trend Analysis ➞ | |
 | LMNR Limoneira Company |
| Sector: Consumer Staples | |
| SubSector: Farm Products | |
| MarketCap: 324.987 Millions | |
| Recent Price: 20.25 Smart Investing & Trading Score: 88 | |
| Day Percent Change: 2.35% Day Change: 0.46 | |
| Week Change: 1.99% Year-to-date Change: -1.9% | |
| LMNR Links: Profile News Message Board | |
| Charts:- Daily , Weekly | |
| Add LMNR to Watchlist: View: Get Complete LMNR Trend Analysis ➞ | |
 | COKE Coca-Cola Consolidated, Inc. |
| Sector: Consumer Staples | |
| SubSector: Beverages - Soft Drinks | |
| MarketCap: 1392.2 Millions | |
| Recent Price: 838.15 Smart Investing & Trading Score: 47 | |
| Day Percent Change: 1.47% Day Change: 12.15 | |
| Week Change: 1.91% Year-to-date Change: -9.7% | |
| COKE Links: Profile News Message Board | |
| Charts:- Daily , Weekly | |
| Add COKE to Watchlist: View: Get Complete COKE Trend Analysis ➞ | |
 | DORM Dorman Products, Inc. |
| Sector: Consumer Staples | |
| SubSector: Auto Parts | |
| MarketCap: 2028.79 Millions | |
| Recent Price: 90.79 Smart Investing & Trading Score: 30 | |
| Day Percent Change: 3.82% Day Change: 3.34 | |
| Week Change: 1.75% Year-to-date Change: 8.9% | |
| DORM Links: Profile News Message Board | |
| Charts:- Daily , Weekly | |
| Add DORM to Watchlist: View: Get Complete DORM Trend Analysis ➞ | |
 | MYE Myers Industries, Inc. |
| Sector: Consumer Staples | |
| SubSector: Rubber & Plastics | |
| MarketCap: 347.57 Millions | |
| Recent Price: 22.40 Smart Investing & Trading Score: 83 | |
| Day Percent Change: 2.26% Day Change: 0.50 | |
| Week Change: 1.61% Year-to-date Change: 14.6% | |
| MYE Links: Profile News Message Board | |
| Charts:- Daily , Weekly | |
| Add MYE to Watchlist: View: Get Complete MYE Trend Analysis ➞ | |
 | WEST Westrock Coffee Company, LLC |
| Sector: Consumer Staples | |
| SubSector: Packaged Foods | |
| MarketCap: 799 Millions | |
| Recent Price: 10.18 Smart Investing & Trading Score: 80 | |
| Day Percent Change: 0.49% Day Change: 0.05 | |
| Week Change: 1.6% Year-to-date Change: 0.2% | |
| WEST Links: Profile News Message Board | |
| Charts:- Daily , Weekly | |
| Add WEST to Watchlist: View: Get Complete WEST Trend Analysis ➞ | |
 | VSTO Vista Outdoor Inc. |
| Sector: Consumer Staples | |
| SubSector: Sporting Goods | |
| MarketCap: 405.144 Millions | |
| Recent Price: 35.52 Smart Investing & Trading Score: 83 | |
| Day Percent Change: 1.23% Day Change: 0.43 | |
| Week Change: 1.57% Year-to-date Change: 20.1% | |
| VSTO Links: Profile News Message Board | |
| Charts:- Daily , Weekly | |
| Add VSTO to Watchlist: View: Get Complete VSTO Trend Analysis ➞ | |
 | PLOW Douglas Dynamics, Inc. |
| Sector: Consumer Staples | |
| SubSector: Auto Parts | |
| MarketCap: 654.739 Millions | |
| Recent Price: 22.73 Smart Investing & Trading Score: 67 | |
| Day Percent Change: 0.40% Day Change: 0.09 | |
| Week Change: 1.56% Year-to-date Change: -23.4% | |
| PLOW Links: Profile News Message Board | |
| Charts:- Daily , Weekly | |
| Add PLOW to Watchlist: View: Get Complete PLOW Trend Analysis ➞ | |
 | OXM Oxford Industries, Inc. |
| Sector: Consumer Staples | |
| SubSector: Textile - Apparel Clothing | |
| MarketCap: 647.665 Millions | |
| Recent Price: 108.31 Smart Investing & Trading Score: 58 | |
| Day Percent Change: 0.49% Day Change: 0.53 | |
| Week Change: 1.5% Year-to-date Change: 8.3% | |
| OXM Links: Profile News Message Board | |
| Charts:- Daily , Weekly | |
| Add OXM to Watchlist: View: Get Complete OXM Trend Analysis ➞ | |
 | EPC Edgewell Personal Care Company |
| Sector: Consumer Staples | |
| SubSector: Personal Products | |
| MarketCap: 1605.95 Millions | |
| Recent Price: 37.95 Smart Investing & Trading Score: 82 | |
| Day Percent Change: 0.86% Day Change: 0.33 | |
| Week Change: 1.38% Year-to-date Change: 3.6% | |
| EPC Links: Profile News Message Board | |
| Charts:- Daily , Weekly | |
| Add EPC to Watchlist: View: Get Complete EPC Trend Analysis ➞ | |
 | VC Visteon Corporation |
| Sector: Consumer Staples | |
| SubSector: Auto Parts | |
| MarketCap: 1441.49 Millions | |
| Recent Price: 113.60 Smart Investing & Trading Score: 87 | |
| Day Percent Change: 2.68% Day Change: 2.97 | |
| Week Change: 1.26% Year-to-date Change: -9.1% | |
| VC Links: Profile News Message Board | |
| Charts:- Daily , Weekly | |
| Add VC to Watchlist: View: Get Complete VC Trend Analysis ➞ | |
 | JOUT Johnson Outdoors Inc. |
| Sector: Consumer Staples | |
| SubSector: Sporting Goods | |
| MarketCap: 572.844 Millions | |
| Recent Price: 42.27 Smart Investing & Trading Score: 35 | |
| Day Percent Change: 3.07% Day Change: 1.26 | |
| Week Change: 1.25% Year-to-date Change: -20.9% | |
| JOUT Links: Profile News Message Board | |
| Charts:- Daily , Weekly | |
| Add JOUT to Watchlist: View: Get Complete JOUT Trend Analysis ➞ | |
 | PRTS U.S. Auto Parts Network, Inc. |
| Sector: Consumer Staples | |
| SubSector: Auto Parts | |
| MarketCap: 65.0939 Millions | |
| Recent Price: 1.23 Smart Investing & Trading Score: 20 | |
| Day Percent Change: -2.00% Day Change: -0.02 | |
| Week Change: 1.24% Year-to-date Change: -61.2% | |
| PRTS Links: Profile News Message Board | |
| Charts:- Daily , Weekly | |
| Add PRTS to Watchlist: View: Get Complete PRTS Trend Analysis ➞ | |
 | WEYS Weyco Group, Inc. |
| Sector: Consumer Staples | |
| SubSector: Textile - Apparel Footwear & Accessories | |
| MarketCap: 198.87 Millions | |
| Recent Price: 29.58 Smart Investing & Trading Score: 57 | |
| Day Percent Change: 0.78% Day Change: 0.23 | |
| Week Change: 1.23% Year-to-date Change: -5.7% | |
| WEYS Links: Profile News Message Board | |
| Charts:- Daily , Weekly | |
| Add WEYS to Watchlist: View: Get Complete WEYS Trend Analysis ➞ | |
 | AVO Mission Produce, Inc. |
| Sector: Consumer Staples | |
| SubSector: Farm Products | |
| MarketCap: 91347 Millions | |
| Recent Price: 11.48 Smart Investing & Trading Score: 76 | |
| Day Percent Change: 1.15% Day Change: 0.13 | |
| Week Change: 1.23% Year-to-date Change: 13.4% | |
| AVO Links: Profile News Message Board | |
| Charts:- Daily , Weekly | |
| Add AVO to Watchlist: View: Get Complete AVO Trend Analysis ➞ | |
| For tabular summary view of above stock list: Summary View ➞ 0 - 25 , 25 - 50 , 50 - 75 , 75 - 100 , 100 - 125 | ||
| Click To Change The Sort Order: By Market Cap or Company Size Performance: Year-to-date, Week and Day | |
| Select Chart Type: | ||
| Too many stocks? View smallcap stocks filtered by marketcap & sector |
| Marketcap: All SmallCap Stocks (default-no microcap), Large, Mid-Range, Small & MicroCap |
| Sector: Tech, Finance, Energy, Staples, Retail, Industrial, Materials, Utilities & Medical |
|
Best Stocks Today 12Stocks.com |
© 2024 12Stocks.com Terms & Conditions Privacy Contact Us
All Information Provided Only For Education And Not To Be Used For Investing or Trading. See Terms & Conditions


One More Thing ... Get Best Stocks Delivered Daily!
Never Ever Miss A Move With Our Top Ten Stocks Lists
Find Best Stocks In Any Market - Bull or Bear Market
Take A Peek At Our Top Ten Stocks Lists: Daily, Weekly, Year-to-Date & Top Trends
Find Best Stocks In Any Market - Bull or Bear Market
Take A Peek At Our Top Ten Stocks Lists: Daily, Weekly, Year-to-Date & Top Trends
Smallcap Stocks With Best Up Trends [0-bearish to 100-bullish]: Surmodics [100], TransMedics Group[100], Rocky Brands[100], LendingClub [100], A10 s[100], UFP [100], Carpenter [100], Xencor [100], TPG RE[100], Trinity Industries[100], OneSpaWorld [100]
Best Smallcap Stocks Year-to-Date:
Janux [426.11%], Viking [319.13%], Longboard [240.1%], Alpine Immune[239.26%], Arcutis Bio[183.9%], Cullinan Oncology[174.84%], Super Micro[168.41%], Avidity Biosciences[167.7%], Vera [165.02%], Bakkt [157.85%], Y-mAbs [142.16%] Best Smallcap Stocks This Week:
Deciphera [73.31%], Cue Biopharma[41.39%], Seres [34.55%], Poseida [32.63%], TransMedics Group[31.92%], P3 Health[31.62%], Phibro Animal[31.5%], LendingTree [27.72%], TPI Composites[27.7%], Surmodics [27.57%], Summit [23.83%] Best Smallcap Stocks Daily:
Surmodics [29.95%], TransMedics Group[29.04%], Rocky Brands[27.01%], Summit [21.63%], LendingClub [20.61%], Powell Industries[20.15%], TG [20.10%], A10 s[18.68%], MiMedx Group[18.59%], Inari Medical[18.51%], CareDx [17.01%]