
 Login Sign Up


| |||||
 |  | ||||

| 12Stocks.com Market Intelligence |
Best SmallCap Stocks
|
| In a hurry? Small Cap Stock Lists: Performance Trends Table, Stock Charts
Sort Small Cap stocks: Daily, Weekly, Year-to-Date, Market Cap & Trends. Filter Small Cap stocks list by sector: Show all, Tech, Finance, Energy, Staples, Retail, Industrial, Materials, Utilities and HealthCare Filter Small Cap stocks list by size: All Large Medium Small and MicroCap |
| 12Stocks.com Small Cap Stocks Performances & Trends Daily | |||||||||
|
|  The overall Smart Investing & Trading Score is 76 (0-bearish to 100-bullish) which puts Small Cap index in short term neutral to bullish trend. The Smart Investing & Trading Score from previous trading session is 90 and hence a deterioration of trend.
| ||||||||
Here are the Smart Investing & Trading Scores of the most requested small cap stocks at 12Stocks.com (click stock name for detailed review):
|


| 12Stocks.com: Investing in Smallcap Index with Stocks | |
|
The following table helps investors and traders sort through current performance and trends (as measured by Smart Investing & Trading Score) of various
stocks in the Smallcap Index. Quick View: Move mouse or cursor over stock symbol (ticker) to view short-term technical chart and over stock name to view long term chart. Click on  to add stock symbol to your watchlist and to add stock symbol to your watchlist and  to view watchlist. Click on any ticker or stock name for detailed market intelligence report for that stock. to view watchlist. Click on any ticker or stock name for detailed market intelligence report for that stock. |
12Stocks.com Performance of Stocks in Smallcap Index
| Ticker | Stock Name | Watchlist | Category | Recent Price | Smart Investing & Trading Score | Change % | YTD Change% |
| UHT | Universal Health |   | Financials | 37.32 | 57 | -0.85 | -13.71% |
| JJSF | J & J Snack Foods | | Consumer Staples | 164.15 | 90 | -0.86 | -1.79% |
| ARWR | Arrowhead | | Health Care | 24.79 | 50 | -0.86 | -18.99% |
| DOCN | DigitalOcean | | Technology | 37.00 | 42 | -0.86 | 0.05% |
| SAFT | Safety Insurance | | Financials | 80.26 | 35 | -0.88 | 5.62% |
| CIM | Chimera | | Financials | 4.52 | 83 | -0.88 | -9.42% |
| TARS | Tarsus | | Health Care | 38.24 | 56 | -0.88 | 88.56% |
| ODP | Office Depot | | Services & Goods | 40.24 | 10 | -0.89 | -28.53% |
| ALRM | Alarm.com | | Technology | 69.04 | 47 | -0.89 | 6.84% |
| DORM | Dorman Products | | Consumer Staples | 91.33 | 40 | -0.90 | 9.50% |
| PAX | Patria s | | Financials | 13.03 | 30 | -0.91 | -16.95% |
| ALEC | Alector | | Health Care | 5.44 | 52 | -0.91 | -31.83% |
| URBN | Urban Outfitters | | Services & Goods | 41.20 | 32 | -0.94 | 15.44% |
| HAIN | Hain Celestial | | Consumer Staples | 7.38 | 49 | -0.94 | -32.60% |
| NOVT | Novanta | | Technology | 163.00 | 32 | -0.94 | -3.21% |
| NYMT | New York | | Financials | 6.27 | 42 | -0.95 | -26.49% |
| STNE | StoneCo | | Technology | 14.63 | 0 | -0.95 | -18.86% |
| RXRX | Recursion | | Health Care | 9.42 | 32 | -0.95 | -3.78% |
| KLIC | Kulicke and | | Technology | 47.51 | 55 | -0.96 | -13.18% |
| HRMY | Harmony Biosciences | | Health Care | 29.03 | 10 | -0.96 | -10.10% |
| NSP | Insperity | | Services & Goods | 104.21 | 83 | -0.97 | -11.10% |
| KN | Knowles | | Technology | 17.42 | 83 | -0.97 | -2.74% |
| OUT | Outfront Media | | Services & Goods | 14.91 | 38 | -1.00 | 6.81% |
| XHR | Xenia Hotels | | Financials | 14.69 | 40 | -1.01 | 7.86% |
| CSGS | CSG Systems | | Technology | 42.78 | 27 | -1.02 | -19.60% |
| For chart view version of above stock list: Chart View ➞ 0 - 25 , 25 - 50 , 50 - 75 , 75 - 100 , 100 - 125 , 125 - 150 , 150 - 175 , 175 - 200 , 200 - 225 , 225 - 250 , 250 - 275 , 275 - 300 , 300 - 325 , 325 - 350 , 350 - 375 , 375 - 400 , 400 - 425 , 425 - 450 , 450 - 475 , 475 - 500 , 500 - 525 , 525 - 550 , 550 - 575 , 575 - 600 , 600 - 625 , 625 - 650 , 650 - 675 , 675 - 700 | ||
 | Click To Change The Sort Order: By Market Cap or Company Size Performance: Year-to-date, Week and Day |  |
| Too many stocks? View smallcap stocks filtered by marketcap & sector |
| Marketcap: All SmallCap Stocks (default-no microcap), Large, Mid-Range, Small |
| Smallcap Sector: Tech, Finance, Energy, Staples, Retail, Industrial, Materials, & Medical |
|
Get the most comprehensive stock market coverage daily at 12Stocks.com ➞ Best Stocks Today ➞ Best Stocks Weekly ➞ Best Stocks Year-to-Date ➞ Best Stocks Trends ➞  Best Stocks Today 12Stocks.com Best Nasdaq Stocks ➞ Best S&P 500 Stocks ➞ Best Tech Stocks ➞ Best Biotech Stocks ➞ |
| Detailed Overview of SmallCap Stocks |
| SmallCap Technical Overview, Leaders & Laggards, Top SmallCap ETF Funds & Detailed SmallCap Stocks List, Charts, Trends & More |
| Smallcap: Technical Analysis, Trends & YTD Performance | |
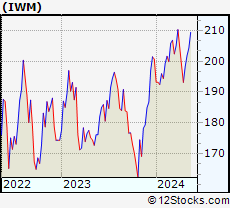
| SmallCap segment as represented by
IWM, an exchange-traded fund [ETF], holds basket of thousands of smallcap stocks from across all major sectors of the US stock market. The smallcap index (contains stocks like Riverbed & Sotheby's) is up by 3.67% and is currently underperforming the overall market by -6.9% year-to-date. Below is a quick view of technical charts and trends: | |
 IWM Weekly Chart |
|
| Long Term Trend: Very Good | |
| Medium Term Trend: Very Good | |
 IWM Daily Chart |
|
| Short Term Trend: Good | |
| Overall Trend Score: 76 | |
| YTD Performance: 3.67% | |
| **Trend Scores & Views Are Only For Educational Purposes And Not For Investing | |
| 12Stocks.com: Top Performing Small Cap Index Stocks | ||||||||||||||||||||||||||||||||||||||||||||||||
 The top performing Small Cap Index stocks year to date are
Now, more recently, over last week, the top performing Small Cap Index stocks on the move are


|
||||||||||||||||||||||||||||||||||||||||||||||||
| 12Stocks.com: Investing in Smallcap Index using Exchange Traded Funds | |
|
The following table shows list of key exchange traded funds (ETF) that
help investors track Smallcap index. The following list also includes leveraged ETF funds that track twice or thrice the daily returns of Smallcap indices. Short or inverse ETF funds move in the opposite direction to the index they track and are useful during market pullbacks or during bear markets. Quick View: Move mouse or cursor over ETF symbol (ticker) to view short-term technical chart and over ETF name to view long term chart. Click on ticker or stock name for detailed view. Click on to add stock symbol to your watchlist and to view watchlist. |
12Stocks.com List of ETFs that track Smallcap Index
| Ticker | ETF Name | Watchlist | Recent Price | Smart Investing & Trading Score | Change % | Week % | Year-to-date % |
| IWM | iShares Russell 2000 | | 208.08 | 76 | 0.07 | 1.85 | 3.67% |
| VTWO | Vanguard Russell 2000 ETF | | 84.11 | 71 | 0.00 | 1.8 | 3.71% |
| IJR | iShares Core S&P Small-Cap | | 110.39 | 68 | -0.22 | 1.29 | 1.98% |
| IWN | iShares Russell 2000 Value | | 158.71 | 76 | -0.07 | 1.61 | 2.18% |
| IWO | iShares Russell 2000 Growth | | 265.15 | 63 | -0.75 | 2.01 | 5.13% |
| IJS | iShares S&P Small-Cap 600 Value | | 101.87 | 76 | -0.15 | 1.34 | -1.16% |
| IJT | iShares S&P Small-Cap 600 Growth | | 131.34 | 71 | 0.04 | 1.14 | 4.95% |
| XSLV | PowerShares S&P SmallCap Low Volatil ETF | | 44.48 | 83 | -0.01 | 0.55 | 0.74% |
| SAA | ProShares Ultra SmallCap600 | | 24.90 | 71 | 0.50 | 2.28 | -0.18% |
| SMLV | SPDR SSGA US Small Cap Low Volatil ETF | | 113.28 | 95 | 0.43 | 1.85 | 0.68% |
| SDD | ProShares UltraShort SmallCap600 | | 17.84 | 35 | 0.96 | -2.41 | -3.19% |
| SBB | ProShares Short SmallCap600 | | 15.77 | 25 | 0.41 | -1.14 | -0.98% |
| 12Stocks.com: Charts, Trends, Fundamental Data and Performances of SmallCap Stocks | |
|
We now take in-depth look at all SmallCap stocks including charts, multi-period performances and overall trends (as measured by Smart Investing & Trading Score). One can sort SmallCap stocks (click link to choose) by Daily, Weekly and by Year-to-Date performances. Also, one can sort by size of the company or by market capitalization. |
| Select Your Default Chart Type: | |||||
| |||||
| Click on stock symbol or name for detailed view. Click on to add stock symbol to your watchlist and to view watchlist. Quick View: Move mouse or cursor over "Daily" to quickly view daily technical stock chart and over "Weekly" to view weekly technical stock chart. | |||||

 | UHT Universal Health Realty Income Trust |
| Sector: Financials | |
| SubSector: REIT - Healthcare Facilities | |
| MarketCap: 1121.14 Millions | |
| Recent Price: 37.32 Smart Investing & Trading Score: 57 | |
| Day Percent Change: -0.85% Day Change: -0.32 | |
| Week Change: -0.53% Year-to-date Change: -13.7% | |
| UHT Links: Profile News Message Board | |
| Charts:- Daily , Weekly | |
| Add UHT to Watchlist: View: Get Complete UHT Trend Analysis ➞ | |
 | JJSF J & J Snack Foods Corp. |
| Sector: Consumer Staples | |
| SubSector: Processed & Packaged Goods | |
| MarketCap: 2706.28 Millions | |
| Recent Price: 164.15 Smart Investing & Trading Score: 90 | |
| Day Percent Change: -0.86% Day Change: -1.43 | |
| Week Change: 0.47% Year-to-date Change: -1.8% | |
| JJSF Links: Profile News Message Board | |
| Charts:- Daily , Weekly | |
| Add JJSF to Watchlist: View: Get Complete JJSF Trend Analysis ➞ | |
 | ARWR Arrowhead Pharmaceuticals, Inc. |
| Sector: Health Care | |
| SubSector: Biotechnology | |
| MarketCap: 3226.15 Millions | |
| Recent Price: 24.79 Smart Investing & Trading Score: 50 | |
| Day Percent Change: -0.86% Day Change: -0.21 | |
| Week Change: 12.27% Year-to-date Change: -19.0% | |
| ARWR Links: Profile News Message Board | |
| Charts:- Daily , Weekly | |
| Add ARWR to Watchlist: View: Get Complete ARWR Trend Analysis ➞ | |
 | DOCN DigitalOcean Holdings, Inc. |
| Sector: Technology | |
| SubSector: Software - Infrastructure | |
| MarketCap: 3620 Millions | |
| Recent Price: 37.00 Smart Investing & Trading Score: 42 | |
| Day Percent Change: -0.86% Day Change: -0.32 | |
| Week Change: 3.04% Year-to-date Change: 0.1% | |
| DOCN Links: Profile News Message Board | |
| Charts:- Daily , Weekly | |
| Add DOCN to Watchlist: View: Get Complete DOCN Trend Analysis ➞ | |
 | SAFT Safety Insurance Group, Inc. |
| Sector: Financials | |
| SubSector: Property & Casualty Insurance | |
| MarketCap: 1145.12 Millions | |
| Recent Price: 80.26 Smart Investing & Trading Score: 35 | |
| Day Percent Change: -0.88% Day Change: -0.71 | |
| Week Change: -3.38% Year-to-date Change: 5.6% | |
| SAFT Links: Profile News Message Board | |
| Charts:- Daily , Weekly | |
| Add SAFT to Watchlist: View: Get Complete SAFT Trend Analysis ➞ | |
 | CIM Chimera Investment Corporation |
| Sector: Financials | |
| SubSector: Mortgage Investment | |
| MarketCap: 2164.09 Millions | |
| Recent Price: 4.52 Smart Investing & Trading Score: 83 | |
| Day Percent Change: -0.88% Day Change: -0.04 | |
| Week Change: -1.95% Year-to-date Change: -9.4% | |
| CIM Links: Profile News Message Board | |
| Charts:- Daily , Weekly | |
| Add CIM to Watchlist: View: Get Complete CIM Trend Analysis ➞ | |
 | TARS Tarsus Pharmaceuticals, Inc. |
| Sector: Health Care | |
| SubSector: Biotechnology | |
| MarketCap: 74487 Millions | |
| Recent Price: 38.24 Smart Investing & Trading Score: 56 | |
| Day Percent Change: -0.88% Day Change: -0.34 | |
| Week Change: 3.35% Year-to-date Change: 88.6% | |
| TARS Links: Profile News Message Board | |
| Charts:- Daily , Weekly | |
| Add TARS to Watchlist: View: Get Complete TARS Trend Analysis ➞ | |
 | ODP Office Depot, Inc. |
| Sector: Services & Goods | |
| SubSector: Specialty Retail, Other | |
| MarketCap: 1024.44 Millions | |
| Recent Price: 40.24 Smart Investing & Trading Score: 10 | |
| Day Percent Change: -0.89% Day Change: -0.36 | |
| Week Change: -1.28% Year-to-date Change: -28.5% | |
| ODP Links: Profile News Message Board | |
| Charts:- Daily , Weekly | |
| Add ODP to Watchlist: View: Get Complete ODP Trend Analysis ➞ | |
 | ALRM Alarm.com Holdings, Inc. |
| Sector: Technology | |
| SubSector: Application Software | |
| MarketCap: 2035.62 Millions | |
| Recent Price: 69.04 Smart Investing & Trading Score: 47 | |
| Day Percent Change: -0.89% Day Change: -0.62 | |
| Week Change: 1.63% Year-to-date Change: 6.8% | |
| ALRM Links: Profile News Message Board | |
| Charts:- Daily , Weekly | |
| Add ALRM to Watchlist: View: Get Complete ALRM Trend Analysis ➞ | |
 | DORM Dorman Products, Inc. |
| Sector: Consumer Staples | |
| SubSector: Auto Parts | |
| MarketCap: 2028.79 Millions | |
| Recent Price: 91.33 Smart Investing & Trading Score: 40 | |
| Day Percent Change: -0.90% Day Change: -0.83 | |
| Week Change: -1.2% Year-to-date Change: 9.5% | |
| DORM Links: Profile News Message Board | |
| Charts:- Daily , Weekly | |
| Add DORM to Watchlist: View: Get Complete DORM Trend Analysis ➞ | |
 | PAX Patria Investments Limited |
| Sector: Financials | |
| SubSector: Asset Management | |
| MarketCap: 2130 Millions | |
| Recent Price: 13.03 Smart Investing & Trading Score: 30 | |
| Day Percent Change: -0.91% Day Change: -0.12 | |
| Week Change: 0.93% Year-to-date Change: -17.0% | |
| PAX Links: Profile News Message Board | |
| Charts:- Daily , Weekly | |
| Add PAX to Watchlist: View: Get Complete PAX Trend Analysis ➞ | |
 | ALEC Alector, Inc. |
| Sector: Health Care | |
| SubSector: Biotechnology | |
| MarketCap: 2719.35 Millions | |
| Recent Price: 5.44 Smart Investing & Trading Score: 52 | |
| Day Percent Change: -0.91% Day Change: -0.05 | |
| Week Change: 2.06% Year-to-date Change: -31.8% | |
| ALEC Links: Profile News Message Board | |
| Charts:- Daily , Weekly | |
| Add ALEC to Watchlist: View: Get Complete ALEC Trend Analysis ➞ | |
 | URBN Urban Outfitters, Inc. |
| Sector: Services & Goods | |
| SubSector: Apparel Stores | |
| MarketCap: 1638.08 Millions | |
| Recent Price: 41.20 Smart Investing & Trading Score: 32 | |
| Day Percent Change: -0.94% Day Change: -0.39 | |
| Week Change: -0.05% Year-to-date Change: 15.4% | |
| URBN Links: Profile News Message Board | |
| Charts:- Daily , Weekly | |
| Add URBN to Watchlist: View: Get Complete URBN Trend Analysis ➞ | |
 | HAIN The Hain Celestial Group, Inc. |
| Sector: Consumer Staples | |
| SubSector: Food Wholesale | |
| MarketCap: 2684.69 Millions | |
| Recent Price: 7.38 Smart Investing & Trading Score: 49 | |
| Day Percent Change: -0.94% Day Change: -0.07 | |
| Week Change: 4.98% Year-to-date Change: -32.6% | |
| HAIN Links: Profile News Message Board | |
| Charts:- Daily , Weekly | |
| Add HAIN to Watchlist: View: Get Complete HAIN Trend Analysis ➞ | |
 | NOVT Novanta Inc. |
| Sector: Technology | |
| SubSector: Scientific & Technical Instruments | |
| MarketCap: 2680.83 Millions | |
| Recent Price: 163.00 Smart Investing & Trading Score: 32 | |
| Day Percent Change: -0.94% Day Change: -1.55 | |
| Week Change: 0.88% Year-to-date Change: -3.2% | |
| NOVT Links: Profile News Message Board | |
| Charts:- Daily , Weekly | |
| Add NOVT to Watchlist: View: Get Complete NOVT Trend Analysis ➞ | |
 | NYMT New York Mortgage Trust, Inc. |
| Sector: Financials | |
| SubSector: Mortgage Investment | |
| MarketCap: 1038.39 Millions | |
| Recent Price: 6.27 Smart Investing & Trading Score: 42 | |
| Day Percent Change: -0.95% Day Change: -0.06 | |
| Week Change: 1.95% Year-to-date Change: -26.5% | |
| NYMT Links: Profile News Message Board | |
| Charts:- Daily , Weekly | |
| Add NYMT to Watchlist: View: Get Complete NYMT Trend Analysis ➞ | |
 | STNE StoneCo Ltd. |
| Sector: Technology | |
| SubSector: Application Software | |
| MarketCap: 7347.82 Millions | |
| Recent Price: 14.63 Smart Investing & Trading Score: 0 | |
| Day Percent Change: -0.95% Day Change: -0.14 | |
| Week Change: -11.89% Year-to-date Change: -18.9% | |
| STNE Links: Profile News Message Board | |
| Charts:- Daily , Weekly | |
| Add STNE to Watchlist: View: Get Complete STNE Trend Analysis ➞ | |
 | RXRX Recursion Pharmaceuticals, Inc. |
| Sector: Health Care | |
| SubSector: Biotechnology | |
| MarketCap: 1470 Millions | |
| Recent Price: 9.42 Smart Investing & Trading Score: 32 | |
| Day Percent Change: -0.95% Day Change: -0.09 | |
| Week Change: 9.53% Year-to-date Change: -3.8% | |
| RXRX Links: Profile News Message Board | |
| Charts:- Daily , Weekly | |
| Add RXRX to Watchlist: View: Get Complete RXRX Trend Analysis ➞ | |
 | KLIC Kulicke and Soffa Industries, Inc. |
| Sector: Technology | |
| SubSector: Semiconductor Equipment & Materials | |
| MarketCap: 1336.68 Millions | |
| Recent Price: 47.51 Smart Investing & Trading Score: 55 | |
| Day Percent Change: -0.96% Day Change: -0.46 | |
| Week Change: -1.25% Year-to-date Change: -13.2% | |
| KLIC Links: Profile News Message Board | |
| Charts:- Daily , Weekly | |
| Add KLIC to Watchlist: View: Get Complete KLIC Trend Analysis ➞ | |
 | HRMY Harmony Biosciences Holdings, Inc. |
| Sector: Health Care | |
| SubSector: Biotechnology | |
| MarketCap: 24487 Millions | |
| Recent Price: 29.03 Smart Investing & Trading Score: 10 | |
| Day Percent Change: -0.96% Day Change: -0.28 | |
| Week Change: -3.68% Year-to-date Change: -10.1% | |
| HRMY Links: Profile News Message Board | |
| Charts:- Daily , Weekly | |
| Add HRMY to Watchlist: View: Get Complete HRMY Trend Analysis ➞ | |
 | NSP Insperity, Inc. |
| Sector: Services & Goods | |
| SubSector: Business Services | |
| MarketCap: 1385.32 Millions | |
| Recent Price: 104.21 Smart Investing & Trading Score: 83 | |
| Day Percent Change: -0.97% Day Change: -1.02 | |
| Week Change: -0.89% Year-to-date Change: -11.1% | |
| NSP Links: Profile News Message Board | |
| Charts:- Daily , Weekly | |
| Add NSP to Watchlist: View: Get Complete NSP Trend Analysis ➞ | |
 | KN Knowles Corporation |
| Sector: Technology | |
| SubSector: Communication Equipment | |
| MarketCap: 1231.39 Millions | |
| Recent Price: 17.42 Smart Investing & Trading Score: 83 | |
| Day Percent Change: -0.97% Day Change: -0.17 | |
| Week Change: 0.99% Year-to-date Change: -2.7% | |
| KN Links: Profile News Message Board | |
| Charts:- Daily , Weekly | |
| Add KN to Watchlist: View: Get Complete KN Trend Analysis ➞ | |
 | OUT Outfront Media Inc. |
| Sector: Services & Goods | |
| SubSector: Marketing Services | |
| MarketCap: 1388.15 Millions | |
| Recent Price: 14.91 Smart Investing & Trading Score: 38 | |
| Day Percent Change: -1.00% Day Change: -0.15 | |
| Week Change: -1.26% Year-to-date Change: 6.8% | |
| OUT Links: Profile News Message Board | |
| Charts:- Daily , Weekly | |
| Add OUT to Watchlist: View: Get Complete OUT Trend Analysis ➞ | |
 | XHR Xenia Hotels & Resorts, Inc. |
| Sector: Financials | |
| SubSector: REIT - Hotel/Motel | |
| MarketCap: 1058.24 Millions | |
| Recent Price: 14.69 Smart Investing & Trading Score: 40 | |
| Day Percent Change: -1.01% Day Change: -0.15 | |
| Week Change: -1.21% Year-to-date Change: 7.9% | |
| XHR Links: Profile News Message Board | |
| Charts:- Daily , Weekly | |
| Add XHR to Watchlist: View: Get Complete XHR Trend Analysis ➞ | |
 | CSGS CSG Systems International, Inc. |
| Sector: Technology | |
| SubSector: Business Software & Services | |
| MarketCap: 1336.78 Millions | |
| Recent Price: 42.78 Smart Investing & Trading Score: 27 | |
| Day Percent Change: -1.02% Day Change: -0.44 | |
| Week Change: 1.78% Year-to-date Change: -19.6% | |
| CSGS Links: Profile News Message Board | |
| Charts:- Daily , Weekly | |
| Add CSGS to Watchlist: View: Get Complete CSGS Trend Analysis ➞ | |
| For tabular summary view of above stock list: Summary View ➞ 0 - 25 , 25 - 50 , 50 - 75 , 75 - 100 , 100 - 125 , 125 - 150 , 150 - 175 , 175 - 200 , 200 - 225 , 225 - 250 , 250 - 275 , 275 - 300 , 300 - 325 , 325 - 350 , 350 - 375 , 375 - 400 , 400 - 425 , 425 - 450 , 450 - 475 , 475 - 500 , 500 - 525 , 525 - 550 , 550 - 575 , 575 - 600 , 600 - 625 , 625 - 650 , 650 - 675 , 675 - 700 | ||
| Click To Change The Sort Order: By Market Cap or Company Size Performance: Year-to-date, Week and Day | |
| Select Chart Type: | ||
| Too many stocks? View smallcap stocks filtered by marketcap & sector |
| Marketcap: All SmallCap Stocks (default-no microcap), Large, Mid-Range, Small & MicroCap |
| Sector: Tech, Finance, Energy, Staples, Retail, Industrial, Materials, Utilities & Medical |
|
Best Stocks Today 12Stocks.com |
© 2024 12Stocks.com Terms & Conditions Privacy Contact Us
All Information Provided Only For Education And Not To Be Used For Investing or Trading. See Terms & Conditions


One More Thing ... Get Best Stocks Delivered Daily!
Never Ever Miss A Move With Our Top Ten Stocks Lists
Find Best Stocks In Any Market - Bull or Bear Market
Take A Peek At Our Top Ten Stocks Lists: Daily, Weekly, Year-to-Date & Top Trends
Find Best Stocks In Any Market - Bull or Bear Market
Take A Peek At Our Top Ten Stocks Lists: Daily, Weekly, Year-to-Date & Top Trends
Smallcap Stocks With Best Up Trends [0-bearish to 100-bullish]: CommScope Holding[100], Coeur Mining[100], Hecla Mining[100], MicroStrategy [100], Enovix [100], Rayonier Advanced[100], Nurix [100], Energy Fuels[100], NovaGold Resources[100], Piedmont Lithium[100], Wave Life[100]
Best Smallcap Stocks Year-to-Date:
CareMax [495.88%], Bakkt [413.9%], Janux [338.34%], Viking [260.02%], Alpine Immune[241.23%], Longboard [238.63%], Avidity Biosciences[226.33%], Super Micro[212.35%], Arcutis Bio[184.83%], Sweetgreen [180.97%], Novavax [171.04%] Best Smallcap Stocks This Week:
Vaxxinity [58.82%], Novavax [46.51%], Vicarious Surgical[45.62%], Harrow Health[44.48%], ProKidney [44.31%], Workhorse Group[36.06%], Maxeon Solar[35.94%], Fossil Group[35.44%], Humacyte [34.68%], MicroStrategy [34.23%], Cadiz [33.48%] Best Smallcap Stocks Daily:
Vaxxinity [45.95%], Presto Automation[31.90%], Vicarious Surgical[27.93%], Orchestra BioMed[12.77%], CommScope Holding[11.86%], Coeur Mining[11.57%], Hecla Mining[11.11%], MicroStrategy [10.04%], Tenaya [9.65%], Bakkt [9.25%], Enovix [9.25%]